KVLE ETF: Dynamic Dividend ETF | Adaptive Risk Management
by Kraneshares
Quality Stocks for Long -Term Growth Potential KraneShares Value Line® Dynamic Dividend Equity Index ETF (Ticker: KVLE) 1 info@kfafunds.comKVLE 9/30/2026
2Investment Strategy KVLE seeks to track the Value Line® Dynamic Dividend Equity Index, which introduces a market adaptive approach to investing in US large cap companies. The strategy seeks to capture quality US companies based on a three -factor process that selects stocks with high dividend yields and are the highest rated among Value Line®’s Safety and Timeliness Ranking Systems. Careful quantitative modelling that incorporates a unique set of risk management tools. The index is rebalanced monthly. KVLE Features •Uses Optimization technology that emphasizes companies with the highest Value Line® Safety and Timeliness rankings in addition to strong dividend yields. •Adaptive risk -management approach that seeks to limit the impact of significant market declines while capturing positive returns in typical market environments. •Smart beta strategy which seeks to deliver cost- effective alpha. KVLE Providers •Value Line® has revolutionized the practice of securities analysis and is one of the nation’s largest independent investment research services, covering over 5,000 equities. •KraneShares licenses specific lists of securities and rankings of such securities from the Value Line® Safety and Timeliness Ranking Systems to use in the security selection process defined in the KVLE strategy.KVLE KraneShares Value Line® Dynamic Dividend Equity Index ETF* *Effective 1/4/2024 the fund was formerly known as the KFA Value Line® Dynamic Core Equity Index ETF
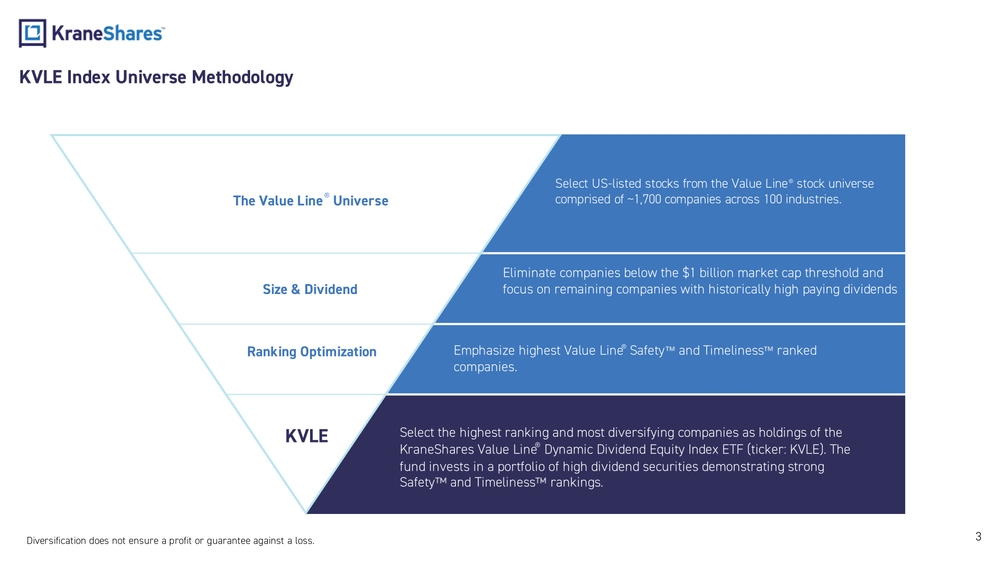
KVLE Index Universe Methodology 3Select US -listed stocks from the Value Line® stock universe comprised of ~1,700 companies across 100 industries. Eliminate companies below the $1 billion market cap threshold and focus on remaining companies with historically high paying dividends Emphasize highest Value Line® Safety and Timeliness ranked companies. Select the highest ranking and most diversifying companies as holdings of the KraneShares Value Line® Dynamic Dividend Equity Index ETF (ticker: KVLE). The fund invests in a portfolio of high dividend securities demonstrating strong Safety and Timeliness rankings.The Value Line® Universe Size & Dividend Ranking Optimization KVLE Diversification does not ensure a profit or guarantee against a loss.
4•The Value Line Safety Rank measures the total risk of a stock relative to the approximately 1,700 other stocks. It takes into account a stock’s Price Stability, Financial Strength, and other factors. Safety ranks are also given on a scale from 1 (Safest) to 5 (Riskiest) •Stocks with high Safety ranks are often associated with large, financially sound companies, many of which regularly pay cash dividends; these same companies also often have somewhat more moderate growth prospects because their primary markets tend to be mature. •Stocks with low Safety ranks are often associated with companies that are smaller and/or have weaker -than- average finances; on the other hand, these smaller companies sometimes have above -average growth prospects because they start with a lower revenue and earnings base. •Safety becomes particularly important in periods of stock market downswings, when many investors want to try to limit their losses. Stocks that had high Safety ranks generally fell less than the market as a whole when stock prices dropped. Safety Rank Performance Value Line® Safety Ranking Overview Data from Value Line ® as of 9/30/2026. The Value Line® Safety Ranking is based on historical data and applies to the underlying securities of the fund, and not the fund itself. Past performance is no guarantee of future results. Safety does not imply stocks cannot lose value. All investing involves risk including the potential loss of principal.
5•The Value Line Timeliness Rank measures predicted relative price performance of approximately 1,700 stocks during the next six to 12 months on an easy- to-understand scale from 1 (Highest) to 5 (Lowest). •Components of the Timeliness Rank include historical stock- price performance, financial results, and earnings surprises. •A proprietary algorithm combines these elements into a forecast of the price change of each stock, relative to all of the approximately 1,700 stocks in The Value Line universe, for the next six to 12 months. •The Value Line universe accounts for approximately 90% of the market capitalization of all stocks traded on the U.S. exchange s. •Rank 1 (Highest) and Rank 2 (Above Average) stocks, as a group, are expected to outperform the Value Line universe during the next six to 12 months (100 stocks are Rank 1; 300 are Rank 2).Timeliness Rank Performance Data from Value Line ® as of 9/30/2026. The Value Line® Timeliness Ranking applies to underlying securities and not to the Fund. Rankings and foreca sts are not guarantees of future results, and securities may underperform their indicated rankings. All investing involves risk, including possible loss of principal.Value Line® Timeliness Ranking Overview
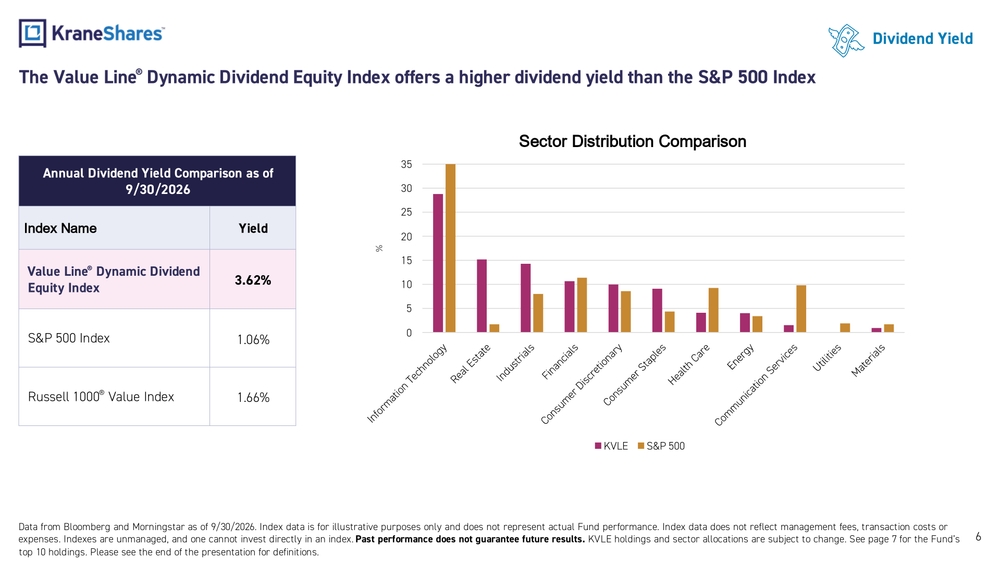
The Value Line® Dynamic Dividend Equity Index offers a higher dividend yield than the S&P 500 Index 6Dividend Yield Annual Dividend Yield Comparison as of 9/30/2026 Index Name Yield Value Line® Dynamic Dividend Equity Index3.62% S&P 500 Index 1.06% Russell 1000® Value Index 1.66% Data from Bloomberg and Morningstar as of 9/30/2026. Index data is for illustrative purposes only and does not represent actual Fund performance. Index data does not reflect management fees, transaction costs or expenses. Indexes are unmanaged, and one cannot invest directly in an index. Past performance does not guarantee future results. KVLE holdings and sector allocations are subject to change. See page 7 for the Fund’s top 10 holdings. Please see the end of the presentation for definitions.05101520253035%Sector Distribution Comparison KVLE S&P 500
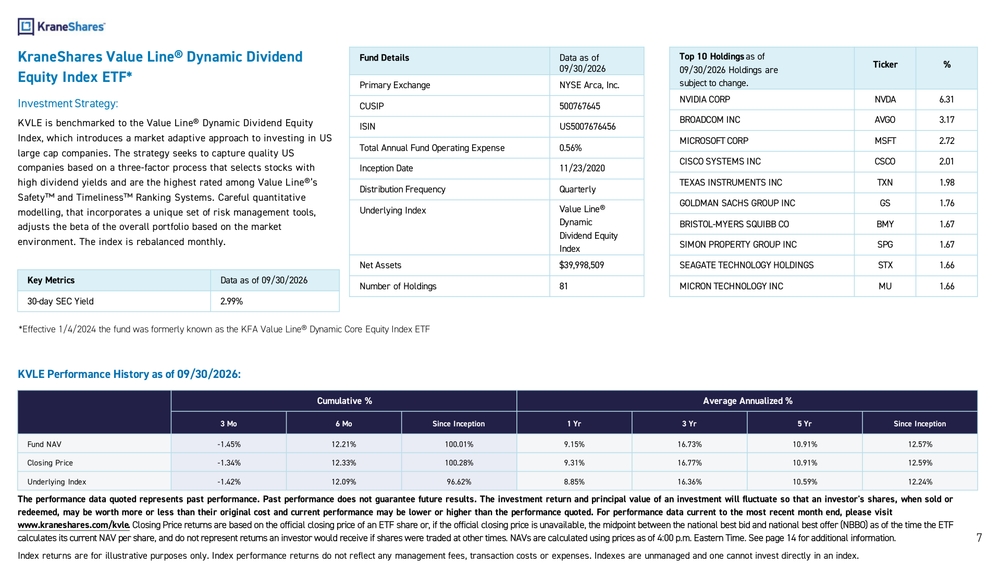
KraneShares Value Line® Dynamic Dividend Equity Index ETF* Investment Strategy: KVLE is benchmarked to the Value Line® Dynamic Dividend Equity Index, which introduces a market adaptive approach to investing in US large cap companies. The strategy seeks to capture quality US companies based on a three -factor process that selects stocks with high dividend yields and are the highest rated among Value Line®’s Safety and Timeliness Ranking Systems. Careful quantitative modelling, that incorporates a unique set of risk management tools, adjusts the beta of the overall portfolio based on the market environment. The index is rebalanced monthly.Fund Details Data as of 09/30/2026 Primary Exchange NYSE Arca, Inc. CUSIP 500767645 ISIN US5007676456 Total Annual Fund Operating Expense 0.56% Inception Date 11/23/2020 Distribution Frequency Quarterly Underlying Index Value Line® Dynamic Dividend Equity Index Net Assets $39,998,509 Number ofHoldings 81Top10Holdings asof 09/30/2026 Holdings are subject tochange.Ticker % NVIDIA CORP NVDA 6.31 BROADCOM INC AVGO 3.17 MICROSOFT CORP MSFT 2.72 CISCO SYSTEMS INC CSCO 2.01 TEXAS INSTRUMENTS INC TXN 1.98 GOLDMAN SACHS GROUP INC GS 1.76 BRISTOL -MYERS SQUIBB CO BMY 1.67 SIMON PROPERTY GROUP INC SPG 1.67 SEAGATE TECHNOLOGY HOLDINGS STX 1.66 MICRON TECHNOLOGY INC MU 1.66 KVLE Performance History asof09/30/2026: Cumulative % Average Annualized % 3Mo 6Mo Since Inception 1Yr 3Yr 5Yr Since Inception Fund NAV -1.45% 12.21% 100.01% 9.15% 16.73% 10.91% 12.57% Closing Price -1.34% 12.33% 100.28% 9.31% 16.77% 10.91% 12.59% Underlying Index -1.42% 12.09% 96.62% 8.85% 16.36% 10.59% 12.24% Theperformance data quoted represents past performance. Past performance does notguarantee future results. Theinvestment return andprincipal value ofaninvestment willfluctuate sothat aninvestor 'sshares, when sold or redeemed, may beworth more orless than their original cost andcurrent performance may belower orhigher than theperformance quoted. Forperformance data current tothemost recent month end, please visit www.kraneshares.com/kvle . Closing Price returns are based on the official closing price of an ETF share or, if the official closing price is unavailabl e, the midpoint between the national best bid and national best offer (NBBO) as of the time the ETF calculates its current NAV per share, and do not represent returns an investor would receive if shares were traded at other t imes. NAVs are calculated using prices as of 4:00 p.m. Eastern Time. See page 14 for additional information. Index returns areforillustrative purposes only. Index performance returns donotreflect anymanagement fees, transaction costs orexpenses. Indexes areunmanaged andonecannot invest directly inanindex.KeyMetrics Data asof09/30/2026 30-daySEC Yield 2.99% *Effective 1/4/2024 the fund was formerly known as the KFA Value Line® Dynamic Core Equity Index ETF 7
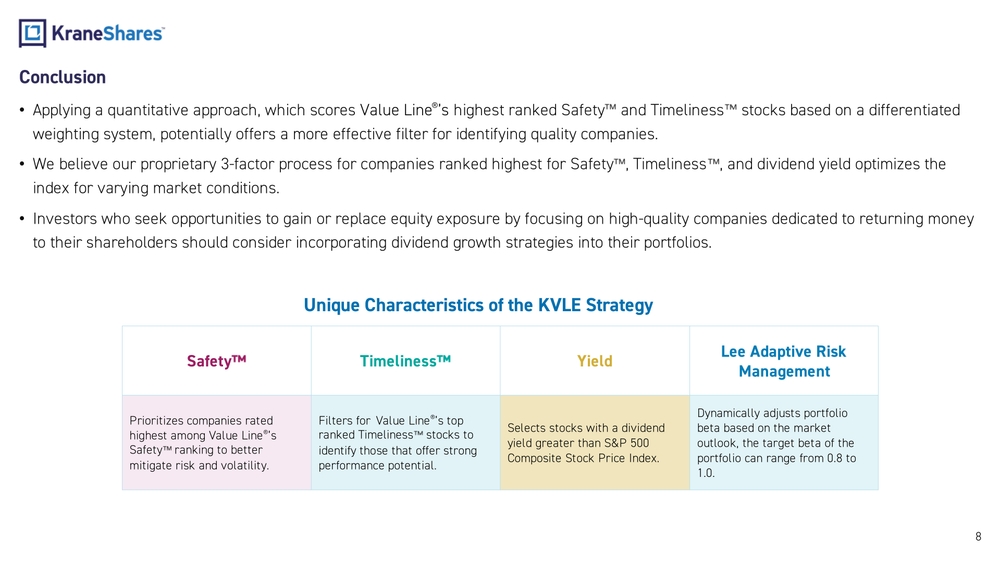
8Conclusion •Applying a quantitative approach, which scores Value Line®’s highest ranked Safety and Timeliness stocks based on a differentiated weighting system, potentially offers a more effective filter for identifying quality companies. •We believe our proprietary 3 -factor process for companies ranked highest for Safety , Timeliness , and dividend yield optimizes the index for varying market conditions. •Investors who seek opportunities to gain or replace equity exposure by focusing on high- quality companies dedicated to returning money to their shareholders should consider incorporating dividend growth strategies into their portfolios. Safety Timeliness YieldLee Adaptive Risk Management Prioritizes companies rated highest among Value Line®’s Safety ranking to better mitigate risk and volatility.Filters for Value Line®’s top ranked Timeliness stocks to identify those that offer strong performance potential.Selects stocks with a dividend yield greater than S&P 500 Composite Stock Price Index.Dynamically adjusts portfolio beta based on the market outlook, the target beta of the portfolio can range from 0.8 to 1.0. Unique Characteristics of the KVLE Strategy
9KraneShares Investment Team Jonathan Shelon, CFA Chief Operating Officer James MaundHead of Capital MarketsGeorgia Kammas Director, Capital Markets Jeffrey CaseyDirector, Capital Markets

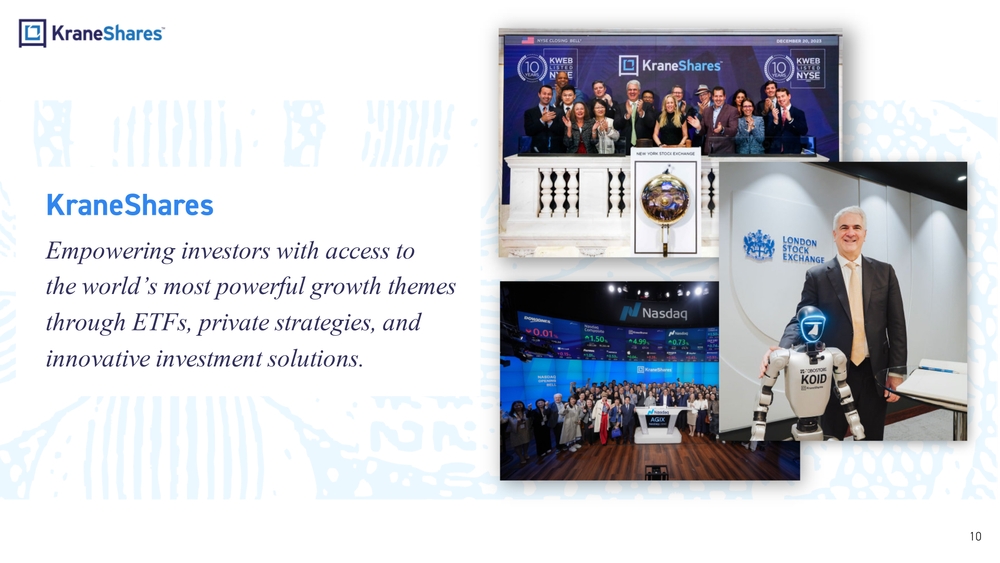
KraneShares Empowering investors with access to the world’ s most powerful growth themes through ETFs, private strategies, and innovative investment solutions. 10
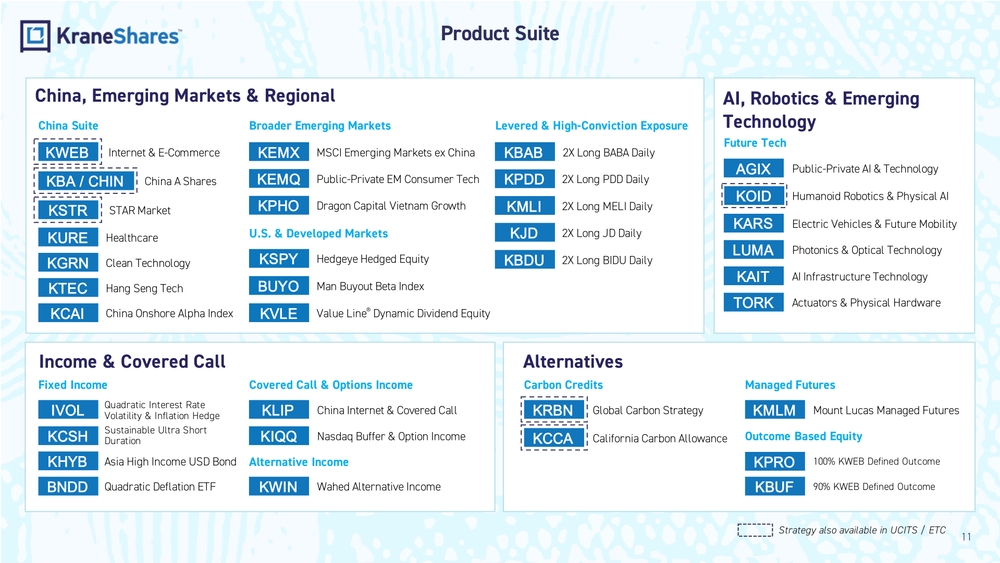
China, Emerging Markets & Regional Alternatives Income & Covered Call AI, Robotics & Emerging Technology KURE Healthcare KGRN Clean Technology KTEC Hang Seng Tech KCAI China Onshore Alpha IndexAGIX Public -Private AI & TechnologyChina Suite Future TechBroader Emerging Markets KEMQ Public -Private EM Consumer Tech KPHO Dragon Capital Vietnam GrowthKEMX MSCI Emerging Markets ex China U.S. & Developed Markets KVLE Value Line® Dynamic Dividend EquityHedgeye Hedged Equity KSPY Man Buyout Beta Index BUYO Fixed Income BNDD Quadratic Deflation ETFIVOLQuadratic Interest Rate Volatility & Inflation Hedge KHYB Asia High Income USD BondSustainable Ultra Short DurationKCSHCarbon CreditsKPDD 2X Long PDD Daily KJD 2X Long JD DailyKBAB 2X Long BABA Daily KMLI 2X Long MELI Daily Covered Call & Options Income Managed Futures KMLM Mount Lucas Managed Futures KWIN Wahed Alternative IncomeKLIP China Internet & Covered Call Outcome Based Equity KIQQ Nasdaq Buffer & Option IncomeLevered & High- Conviction Exposure KBUF 90% KWEB Defined Outcome100% KWEB Defined Outcome KPRO Alternative Income Product Suite KWEB Internet & E -Commerce KOID Humanoid Robotics & Physical AI Strategy also available in UCITS / ETCKBDU 2X Long BIDU DailyChina A Shares KBA / CHIN KSTR STAR Market Global Carbon Strategy KRBN KCCA California Carbon AllowanceElectric Vehicles & Future Mobility KARS LUMA Photonics & Optical Technology KAIT AI Infrastructure Technology TORK Actuators & Physical Hardware 11
12Index Definitions: S&P 500 Index: The S&P 500 Index is widely regarded as the best single gauge of large -cap U.S. equities. There is over USD 9.9 trillion indexed or benchmarked to the index, with indexed assets comprising approximately USD 3.4 trillion of this total. The index includes 500 leading companies and covers approximately 80 % of available market capitalization. The index was launched on March 4, 1957.The Russell 1000 ® Value Index: measures the performance of the large -cap value segment of the US equity universe. It includes those Russell 1000® companies with lower price -to-book ratios and lower expected growth values. Terminology Definitions: Smart Beta: Smart beta is a rules -based system for selecting investments to be included in a fund portfolio. Smart beta is gener ally used to ensure that investments exhibiting a certain, measurable characteristic are automatically included in a fund. Dividend Yield: The ratio of a company’s annual dividend compared to its share price. Dividend yield is expressed by the for mula: annual dividend/share price. Price/Earnings (P/E): The ratio of a company’s share price compared to its earnings per share over a period of time . P/E is expressed by the formula: market value per share/earnings per share. Alpha: the active return on an investment, gauges the performance of an investment against a market index or benchmark which is considered to represent the market's movement as a whole . Volatility: the degree of variation of a trading price series over time as measured by the standard deviation of returns. Sta ndard deviation is a quantity calculated to indicate the extent of deviation for a group as a whole . A low standard deviation indicates that the data points tend to be close to the mean (also called the expected value) of the s et, while a high standard deviation indicates that the data points are spread out over a wider range of values. 30-day SEC Yield: standard yield calculation developed by the U.S. Securities and Exchange Commission (SEC) that allows for fair er comparisons of bond funds. It is based on the most recent 30 -day period covered by the fund's filings with the SEC.
13Important Notes Carefully consider the Fund ’s investment objectives, risk factors, charges and expenses before investing. This and additional information can be found in t he Fund ’s full and summary prospectus, which may be obtained by visiting www.kfafunds.com/kvle . Read the prospectus carefully before investing. Risk Disclosures: Investing involves risk, including possible loss of principal. There can be no assurance that a Fund will achieve its stated obj ectives. Indices are unmanaged and do not include the effect of fees. One cannot invest directly in an index.This information should not be relied upon as research, investment advice, or a recommendation regarding any products, strate gies, or any security in particular . This material is strictly for illustrative, educational, or informational purposes and is subject to change. Certain content represents an assessment of the market envir onment at a specific time and is not intended to be a forecast of future events or a guarantee of future results; material is as of the dates noted and is subject to change without notice.The Fund may invest in derivatives, which are often more volatile than other investments and may magnify the Fund’s gains or losses. A derivative (i.e., futures/forward contracts, swaps, and options) is a contract that derives its value from the performance of an underlying asset. The primary risk of derivatives is that changes in the asset’s market value and the derivative may not be proportionate, and some derivatives can have the potential for unlimited losses. Derivatives are also subject to liquidity and counterparty risk . The Fund is subject to liquidity risk, meaning that certain investments may become difficult to purchase or sell at a reasonable time and price. If a transaction for these securities is large, it may not be possible to initiate, which may cause the Fund to suffer losses. Counterparty risk is the risk of loss in the event that the counterparty to an agreement fails to make required payments or otherwise comply with the terms of the derivative.
14Risk Disc losures Continued: Value Line®, the Value Line® Logo, Timeliness and Safety are trademarks or registered trademarks of Value Line, Inc. and/or its affiliates in the United States and other countries. U sed by permission. This Fund is not sponsored, endorsed, sold or promoted by Value Line Publishing LLC (“VLP”), Value Line, Inc. (“VLI”) or any of t heir affiliates (collectively, “VL”). VL makes no representation or warranty, express or implied, to the owners and advisors of the KFA VALUE LINE® DYNAMIC DIVIDEND EQUITY INDEX ETF or any member of the public rega rding the advisability of investing in securities generally or in the KFA VALUE LINE® DYNAMIC DIVIDEND EQUITY INDEX ETF particularly. VL’s only relationship to Krane Funds Advisors LLC and in connection wi th this KFA VALUE LINE® DYNAMIC DIVIDEND EQUITY INDEX ETF is Licensees' right to license certain VL service marks and trade names and to use authorized advisory and sub -advisory service providers tha t license the Value Line® Safety Ranking System and the Value Line® Timeliness Ranking System (the “Ranks”), which are composed by VL without regard to Licensees, this KFA VALUE LINE® DYNAMIC DIVIDEND EQU ITY INDEX ETF or any investor. VL has no obligation to take the needs of Licensees or any investor in the KFA VALUE LINE® DYNAMIC DIVIDEND EQUITY INDEX ETF into consideration in composing t he Ranks. The KFA VALUE LINE® DYNAMIC DIVIDEND EQUITY INDEX ETF results may differ from the hypothetical or published results of the Ranks. VL is not responsible for and has not participated i n the determination of the prices and composition of the KFA VALUE LINE® DYNAMIC DIVIDEND EQUITY INDEX ETF or the timing of the issuance for sale of the KFA VALUE LINE® DYNAMIC DIVIDEND EQUITY INDEX ETF or in the calculation of the equations by which the KFA VALUE LINE® DYNAMIC DIVIDEND EQUITY INDEX ETF is to be converted into cash. VL MAKES NO WARRANTY AND EXPRESSLY DISCLAIMS ALL WARRANTIES CONCERNING T HE RANKS, EXPRESS OR IMPLIED, INCLUDING, BUT NOT LIMITED TO, ANY IMPLIED WARRANTIES OF MERCHANTABILITY OR FITNESS FOR A PARTICULAR PURPOSE OR ANY IMPLIED WARRANTIES ARISING FROM USAGE OF TRADE, COURSE OF DEALING OR COURSE OF PERFORMANCE, AND VL MAKES NO WARRANTY AS TO THE POTENTIAL PROFITS OR ANY OTHER BENEFITS THAT MAY BE ACHIEVED BY USING THE RANKS OR ANY INFORMATION OR MATERIALS GENERATED THEREFROM. VL DOES NOT WARRANT THAT THE RANKS WILL MEET ANY REQUIREMENTS OR THAT IT WILL BE ACCURATE OR ERROR- FREE. VL ALSO DOES NOT GUARANTEE ANY USES, INFORMATION, DATA OR OTHER RESULTS GENERATED FROM THE RANKS. VLP HAS NO OBLIGATION OR LIABILITY (I) IN CONNECTION WITH THE ADMINISTRATION, MARKETI NG OR TRADING OF THIS KFA VALUE LINE® DYNAMIC DIVIDEND EQUITY INDEX ETF; OR (II) FOR ANY LOSS, DAMAGE, COST OR EXPENSE SUFFERED OR INCURRED BY ANY INVESTOR OR OTHER PERSON OR ENTITY IN CONNECTION WITH THIS KFA VALUE LINE® DYNAMIC DIVIDEND EQUITY INDEX ETF, AND IN NO EVENT SHALL VL BE LIABLE FOR ANY LOST PROFITS OR OTHER CONSEQUENTIAL, SPECIAL, P UNITIVE, INCIDENTAL, INDIRECT OR EXEMPLARY DAMAGES IN CONNECTION WITH THIS KFA VALUE LINE® DYNAMIC DIVIDEND EQUITY INDEX ETF, EVEN IF IT HAS BEEN ADVISED OF THE POSSIBILITY OF SUC H DAMAGES, WHETHER IN CONTRACT, TORT, STRICT LIABILITY OR OTHERWISE. THE LICENSING AGREEMENT TO WHICH KRANE FUNDS ADVISORS, LLC ARE PARTIES (COLLECTIVELY THE “LICENSEES”) IS SOLELY FOR THEIR BENEFIT AND THE BENEFIT OF VL AND EAM, AND NOT FOR THE BENEFIT OF ANY OTHER OWNERS OF THE KFA VALUE LINE® DYNAMIC DIVIDEND EQUITY INDEX ETF OR ANY OTHER THIRD PARTIES. There is no guarantee that issuers of the stocks held by the Fund will declare dividends in the future or that, if declared, suc h dividends will remain at current levels or increase over time. Narrowly focused investments typically exhibit higher volatility. The Fund’s assets are expected to be concentrated in a sector, industry, market, or group of concentrations to the extent tha t the Underlying Index has such concentrations. The securities or futures in that concentration could react similarly to market developments. Thus, the Fund is subject to loss due to adverse occurrences that affect that concentration. ETF shares are bought and sold on an exchange at market price (not NAV) and are not individually redeemed from the Fund. However , shares may be redeemed at NAV directly by certain authorized broker - dealers (Authorized Participants) in very large creation/redemption units. The returns shown do not represent the returns you would receive if you traded shares at other times. Shares may trade at a premium or discount to their NAV in the secondary market. Brokerage commissions will reduce returns. Beginning 12/23/2020, market price returns are based on the official closing price of an ETF share or, if the official closing price isn't available, the midpoint between the national best bid and national best offer ("NBBO") as of the time the ETF calculates the current NAV per share. Prior to that date, market price returns were based on the midpoint between the Bid and Ask price. NAVs are calculated using prices as of 4:00 PM Eastern Time. The KraneShares ETFs and KFA Funds ETFs are distributed by SEI Investments Distribution Company (SIDCO), 1 Freedom Valley Dri ve, Oaks, PA 19456, which is not affiliated with Krane Funds Advisors, LLC, the Investment Adviser for the Funds, or any sub -advisers for the Funds.