CHIN UCITS ETF: China ETF | S&P China 500 | KraneShares
by Kraneshares
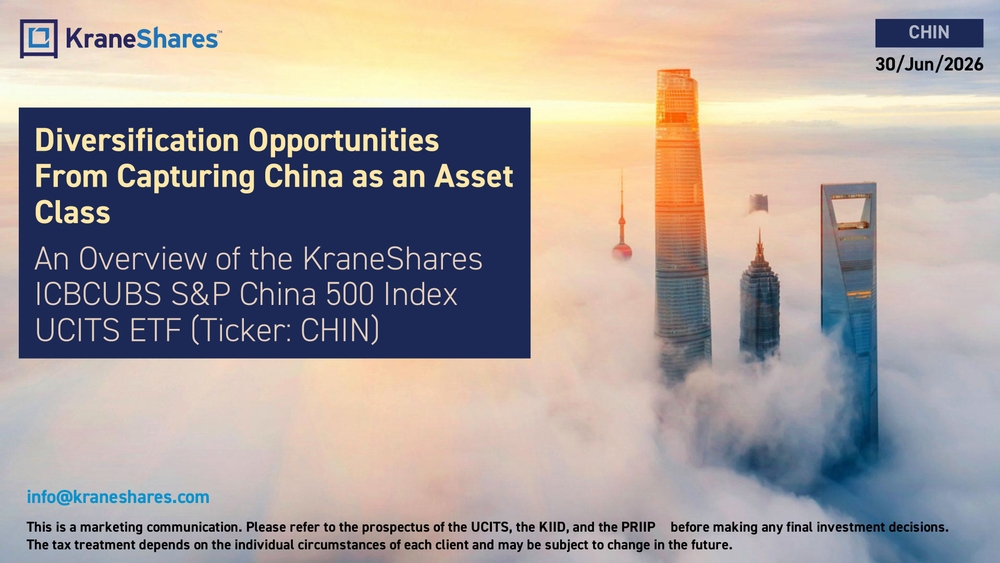
30/Jun/2026 info@kraneshares.com This is a marketing communication. Please refer to the prospectus of the UCITS, the KIID, and the PRIIP before making any fi nal investment decisions. The tax treatment depends on the individual circumstances of each client and may be subject to change in the future.Diversification Opportunities From Capturing China as an Asset Class An Overview of the KraneShares ICBCUBS S&P China 500 Index UCITS ETF (Ticker: CHIN)CHIN
2Investment Strategy: CHIN is a passively managed, index -tracking UCITS ETF that seeks to track the S&P China 500 Index. The S&P China 500 Index comprises 500 of the largest, most liquid Chinese companies listed on all Chinese stock exchanges, including Mainland China, Hong Kong, and the United States. Companies available for inclusion must be headquartered in China and meet the market capitalization and liquidit y minimums required by S&P’s index methodology. CHIN Features: •Strategic ownership of China as an asset class. •Exposure to companies benefitting from increasing domestic consumption by China's growing middle class. •Exposure to Chinese companies listed in the United States, Hong Kong, and Mainland China. China Broad Equity Market Highlights: •The increased availability of Chinese equities to foreign investors over the past decade has brought about the rise of China as an asset class. •China has the world’s second largest economy and equity market, with a capitalization of over $16 trillion.1 CHIN KraneShares ICBCUBS S&P China 500 Index UCITS ETF 1.Data from MSCI as of 12/31/2025. The Fund’s assets are expected to be concentrated in a sector, industry, market, or group of concentrations to the extent tha t the Underlying Index has such concentrations. The securities or futures in that concentration could react similarly to market developments. Thus, the Fund is subject to loss due to adverse occurrences that affect that concentration.
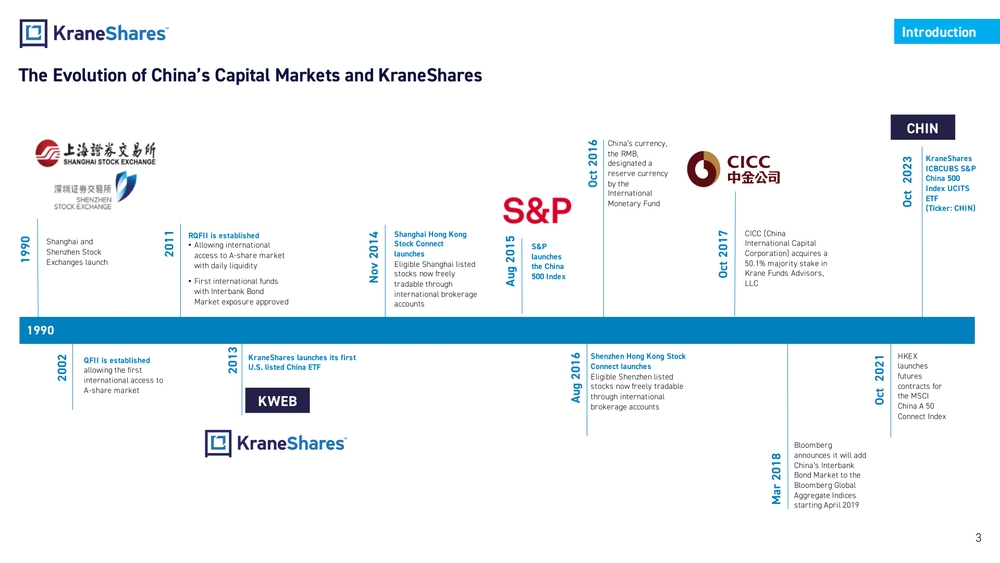
3The Evolution of China’s Capital Markets and KraneShares 1990Shanghai and Shenzhen Stock Exchanges launch Shenzhen Hong Kong Stock Connect launches Eligible Shenzhen listed stocks now freely tradable through international brokerage accountsAug 2016CICC (China International Capital Corporation) acquires a 50.1% majority stake in Krane Funds Advisors, LLCOct 2017 QFII is established allowing the first international access to A-share market2002RQFII is established •Allowing international access to A -share market with daily liquidity •First international funds with Interbank Bond Market exposure approved2011 1990Shanghai Hong Kong Stock Connect launches Eligible Shanghai listed stocks now freely tradable through international brokerage accountsNov 2014 KraneShares launches its first U.S. listed China ETF2013 Oct 2016China’s currency, the RMB, designated a reserve currency by the International Monetary Fund Mar 2018Bloomberg announces it will add China’s Interbank Bond Market to the Bloomberg Global Aggregate Indices starting April 2019HKEX launches futures contracts for the MSCI China A 50 Connect IndexOct 2021Introduction KraneShares ICBCUBS S&P China 500 Index UCITS ETF (Ticker: CHIN)Oct 2023CHIN KWEB S&P launches the China 500 IndexAug 2015
The Index Matters S&P is a world -leading resource for benchmarks and investable indices. Data from S&P Dow Jones as of 30/Jun/2026. For illustrative purposes only. Indexes are unmanaged and one cannot invest directly in an index. 4Index Overview Global Reach Clients in 71 Countries & 21 offices worldwide Index Services (Index Licensing, Custom Indices, and Data and Benchmarking)
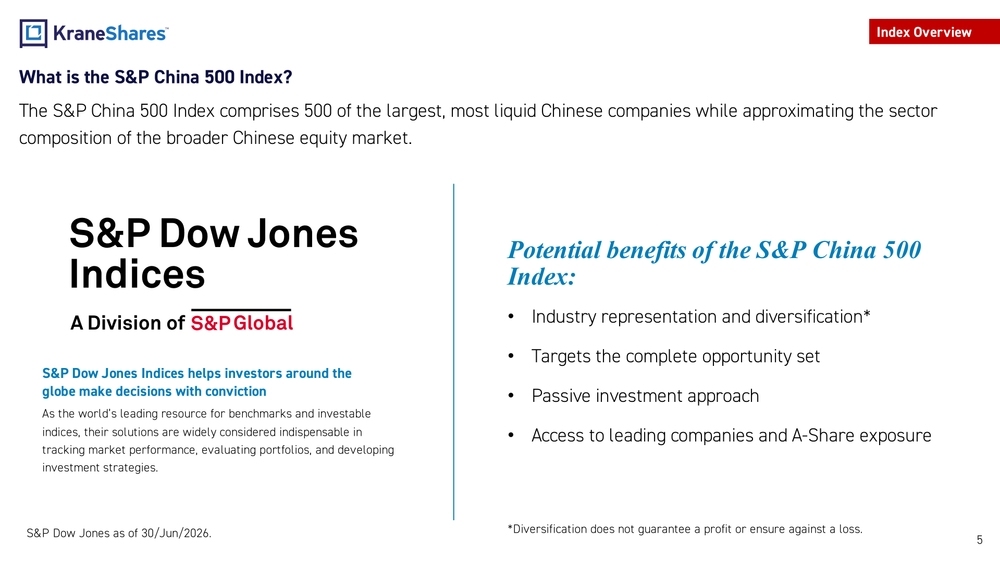
What is the S&P China 500 Index? The S&P China 500 Index comprises 500 of the largest, most liquid Chinese companies while approximating the sector composition of the broader Chinese equity market. Potential benefits of the S&P China 500 Index: •Industry representation and diversification* •Targets the complete opportunity set •Passive investment approach •Access to leading companies and A -Share exposure S&P Dow Jones Indices helps investors around the globe make decisions with conviction As the world’s leading resource for benchmarks and investable indices, their solutions are widely considered indispensable in tracking market performance, evaluating portfolios, and developing investment strategies. 5*Diversification does not guarantee a profit or ensure against a loss. S&P Dow Jones as of 30/Jun/2026.Index Overview
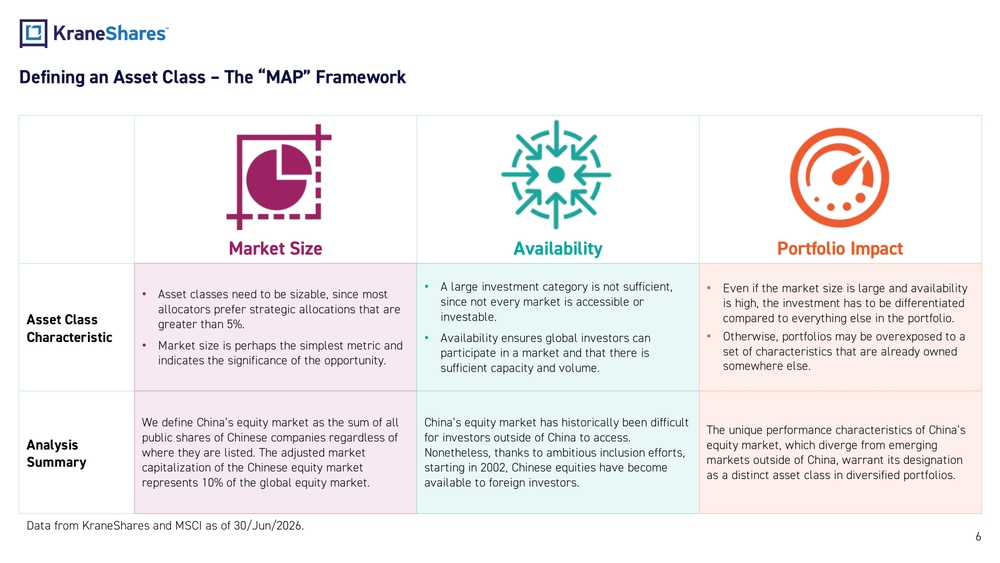
Defining an Asset Class – The “MAP” Framework Market Size Availability Portfolio Impact Asset Class Characteristic•Asset classes need to be sizable, since most allocators prefer strategic allocations that are greater than 5%. •Market size is perhaps the simplest metric and indicates the significance of the opportunity.•A large investment category is not sufficient, since not every market is accessible or investable. •Availability ensures global investors can participate in a market and that there is sufficient capacity and volume.•Even if the market size is large and availability is high, the investment has to be differentiated compared to everything else in the portfolio. •Otherwise, portfolios may be overexposed to a set of characteristics that are already owned somewhere else. Analysis SummaryWe define China’s equity market as the sum of all public shares of Chinese companies regardless of where they are listed. The adjusted market capitalization of the Chinese equity market represents 10% of the global equity market.China’s equity market has historically been difficult for investors outside of China to access. Nonetheless, thanks to ambitious inclusion efforts, starting in 2002, Chinese equities have become available to foreign investors.The unique performance characteristics of China’s equity market, which diverge from emerging markets outside of China, warrant its designation as a distinct asset class in diversified portfolios. 6Data from KraneShares and MSCI as of 30/Jun/2026.
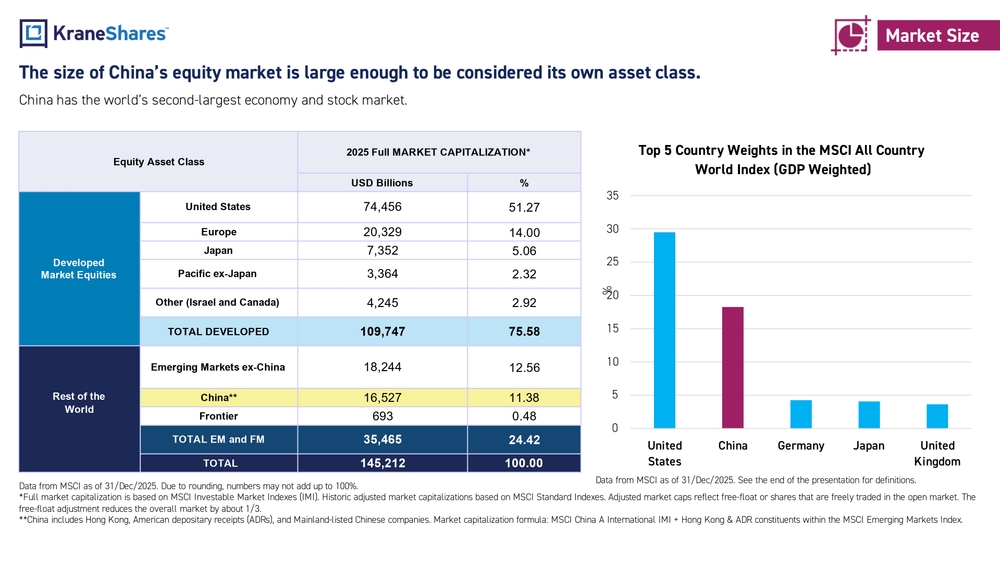
The size of China’s equity market is large enough to be considered its own asset class. China has the world’s second -largest economy and stock market. Data from MSCI as of 31 /Dec/2025 . See the end of the presentation for definitions.Data from MSCI as of 31/Dec/2025. Due to rounding, numbers may not add up to 100%. Full market capitalization is based on MSCI Investable Market Indexes (IMI). Historic adjusted market capitalizations based on MSCI Standard Indexes. Adjusted market caps reflect free -float or shares that are freely traded in the open market. The free-float adjustment reduces the overall market by about 1/3. China includes Hong Kong, American depositary receipts (ADRs), and Mainland -listed Chinese companies. Market capitalization fo rmula: MSCI China A International IMI + Hong Kong & ADR constituents within the MSCI Emerging Markets Index.Equity Asset Class2025 Full MARKET CAPITALIZATION USD Billions % Developed Market EquitiesUnited States 74,456 51.27 Europe 20,329 14.00 Japan 7,352 5.06 Pacific ex -Japan 3,364 2.32 Other (Israel and Canada) 4,245 2.92 TOTAL DEVELOPED 109,747 75.58 Rest of the WorldEmerging Markets ex -China 18,244 12.56 China 16,527 11.38 Frontier 693 0.48 TOTAL EM and FM 35,465 24.42 TOTAL 145,212 100.0005101520253035 United StatesChina Germany Japan United KingdomTop 5 Country Weights in the MSCI All Country World Index (GDP Weighted)% Market Size
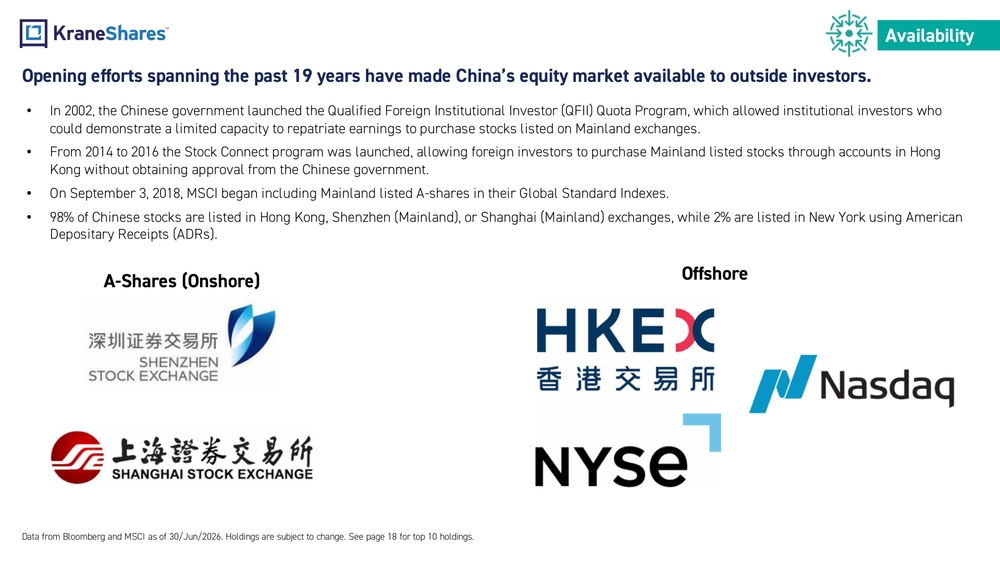
Opening efforts spanning the past 19 years have made China’s equity market available to outside investors. •In 2002, the Chinese government launched the Qualified Foreign Institutional Investor (QFII) Quota Program, which allowed ins titutional investors who could demonstrate a limited capacity to repatriate earnings to purchase stocks listed on Mainland exchanges. •From 2014 to 2016 the Stock Connect program was launched, allowing foreign investors to purchase Mainland listed stocks throu gh accounts in Hong Kong without obtaining approval from the Chinese government. •On September 3, 2018, MSCI began including Mainland listed A -shares in their Global Standard Indexes . •98% of Chinese stocks are listed in Hong Kong, Shenzhen (Mainland), or Shanghai (Mainland) exchanges, while 2% are listed in New York using American Depositary Receipts (ADRs). Data from Bloomberg and MSCI as of 30/Jun/2026. Holdings are subject to change. See page 18 for top 10 holdings. A-Shares (Onshore)OffshoreAvailability
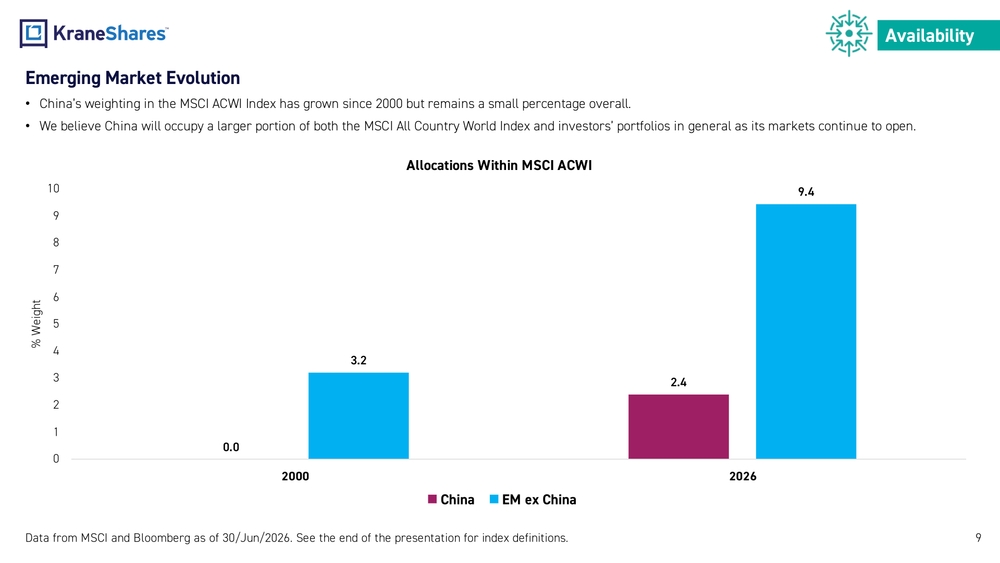
Emerging Market Evolution •China’s weighting in the MSCI ACWI Index has grown since 2000 but remains a small percentage overall. •We believe China will occupy a larger portion of both the MSCI All Country World Index and investors’ portfolios in general a s its markets continue to open. Data from MSCI and Bloomberg as of 30/Jun/2026. See the end of the presentation for index definitions.Availability 90.02.43.29.4 012345678910 2000 2026% WeightAllocations Within MSCI ACWI China EM ex China
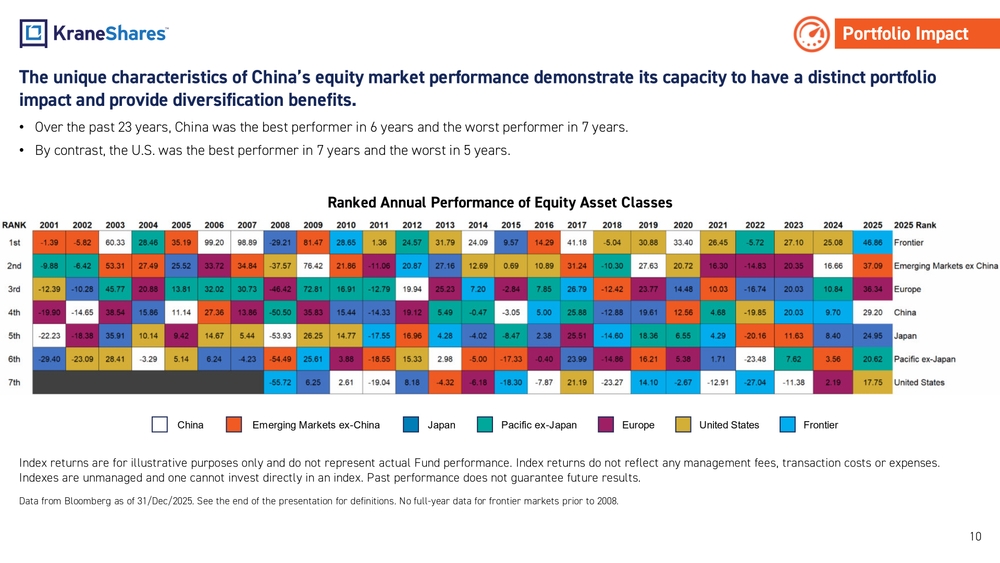
The unique characteristics of China’s equity market performance demonstrate its capacity to have a distinct portfolio impact and provide diversification benefits. •Over the past 23 years, China was the best performer in 6 years and the worst performer in 7 years. •By contrast, the U.S. was the best performer in 7 years and the worst in 5 years. Data from Bloomberg as of 31/Dec/2025. See the end of the presentation for definitions . No full -year data for frontier markets prior to 2008. 10Ranked Annual Performance of Equity Asset Classes Index returns are for illustrative purposes only and do not represent actual Fund performance. Index returns do not reflect a ny management fees, transaction costs or expenses. Indexes are unmanaged and one cannot invest directly in an index. Past performance does not guarantee future results. China Emerging Markets ex -China Japan Pacific ex -Japan Europe United States Frontier Portfolio Impact
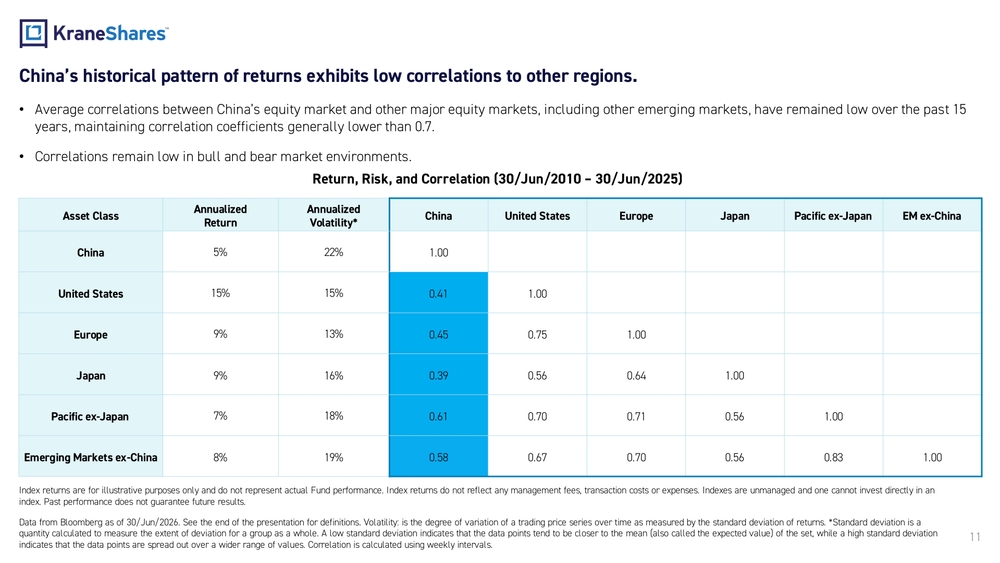
China’s historical pattern of returns exhibits low correlations to other regions. •Average correlations between China’s equity market and other major equity markets, including other emerging markets, have rem ained low over the past 15 years, maintaining correlation coefficients generally lower than 0.7. •Correlations remain low in bull and bear market environments. Data from Bloomberg as of 30/Jun/2026. Se e the end of the presentation for definitions . Volatility: is the degree of variation of a trading price series over time as measured by the standard deviation of returns. Standard deviation is a quantity calculated to measure the extent of deviation for a group as a whole. A low standard deviation indicates that the da ta points tend to be closer to the mean (also called the expected value) of the set, while a high standard deviation indicates that the data points are spread out over a wider range of values. Correlation is calculated using weekly intervals.11Index returns are for illustrative purposes only and do not represent actual Fund performance. Index returns do not reflect a ny management fees, transaction costs or expenses. Indexes are unmanaged and one cannot invest directly in an index. Past performance does not guarantee future results. Return, Risk, and Correlation (30/Jun/2010 – 30/Jun/2025) Asset ClassAnnualized ReturnAnnualized VolatilityChina United States Europe Japan Pacific ex -Japan EM ex -China China 5% 22% 1.00 United States 15% 15% 0.41 1.00 Europe 9% 13% 0.45 0.75 1.00 Japan 9% 16% 0.39 0.56 0.64 1.00 Pacific ex -Japan 7% 18% 0.61 0.70 0.71 0.56 1.00 Emerging Markets ex -China 8% 19% 0.58 0.67 0.70 0.56 0.83 1.00
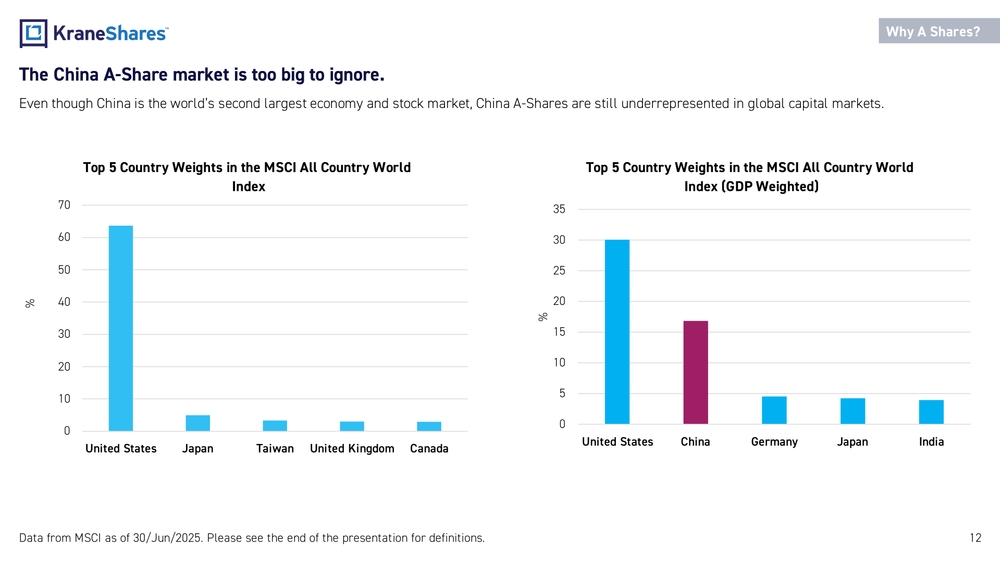
The China A -Share market is too big to ignore. Even though China is the world’s second largest economy and stock market, China A -Shares are still underrepresented in global ca pital markets. 12 Data from MSCI as of 30/Jun/2025. Please see the end of the presentation for definitions.Why A Shares? 010203040506070 United States Japan Taiwan United Kingdom CanadaTop 5 Country Weights in the MSCI All Country World Index% 05101520253035 United States China Germany Japan India%Top 5 Country Weights in the MSCI All Country World Index (GDP Weighted)
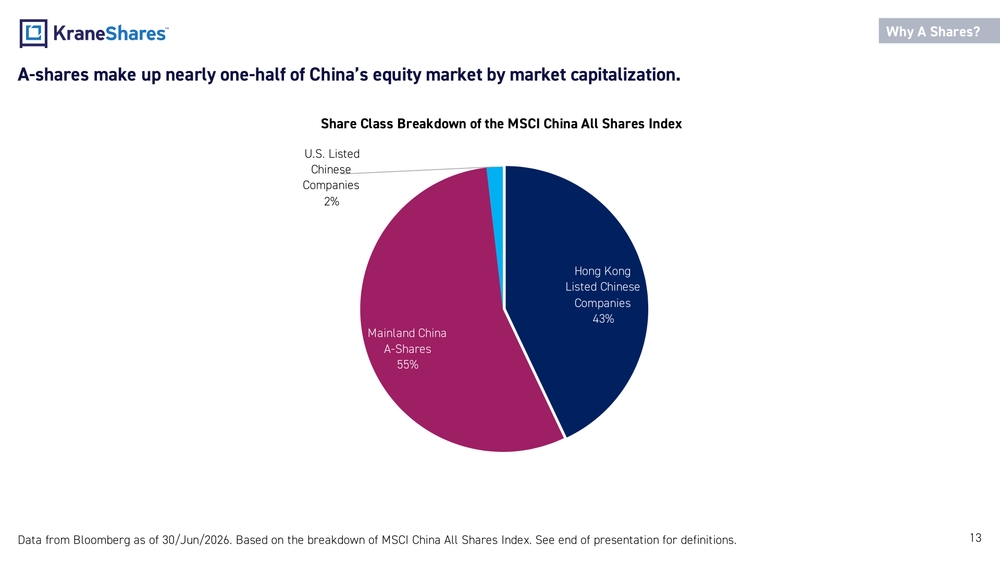
A-shares make up nearly one -half of China’s equity market by market capitalization. Data from Bloomberg as of 30/Jun/2026. Based on the breakdown of MSCI China All Shares Index. See end of presentation for definitions. 13Why A Shares? Hong Kong Listed Chinese Companies 43% Mainland China A-Shares 55%U.S. Listed Chinese Companies 2%Share Class Breakdown of the MSCI China All Shares Index
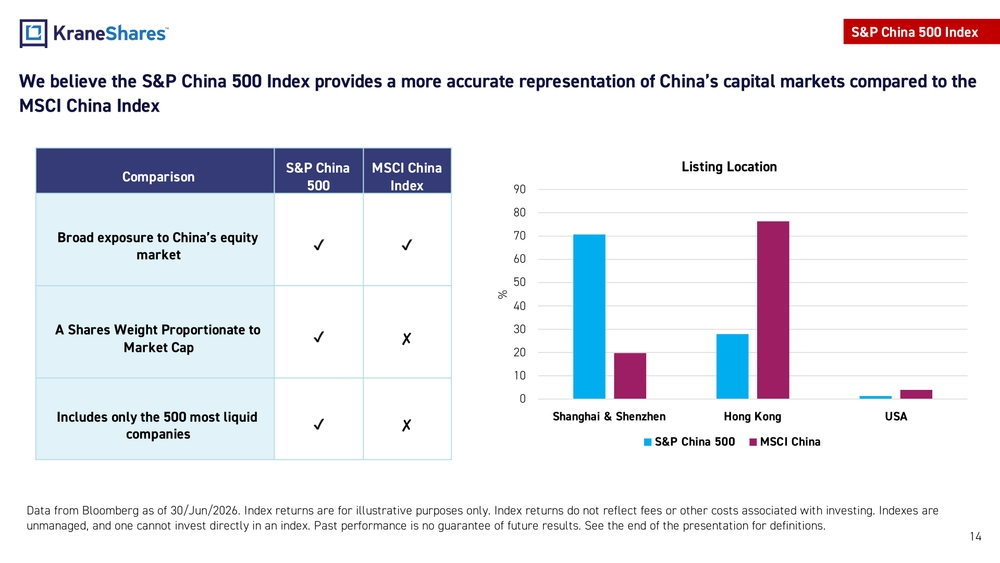
Data from Bloomberg as of 30/Jun/2026. Index returns are for illustrative purposes only. Index returns do not reflect fees or other costs associated with investing. Indexes are unmanaged, and one cannot invest directly in an index. Past performance is no guarantee of future results. See the end of the presentation for definitions. 14We believe the S&P China 500 Index provides a more accurate representation of China’s capital markets compared to the MSCI China Index ComparisonS&P China 500MSCI China Index Broad exposure to China’s equity market A Shares Weight Proportionate to Market Cap ✘ Includes only the 500 most liquid companies ✘S&P China 500 Index 0102030405060708090 Shanghai & Shenzhen Hong Kong USA%Listing Location S&P China 500 MSCI China
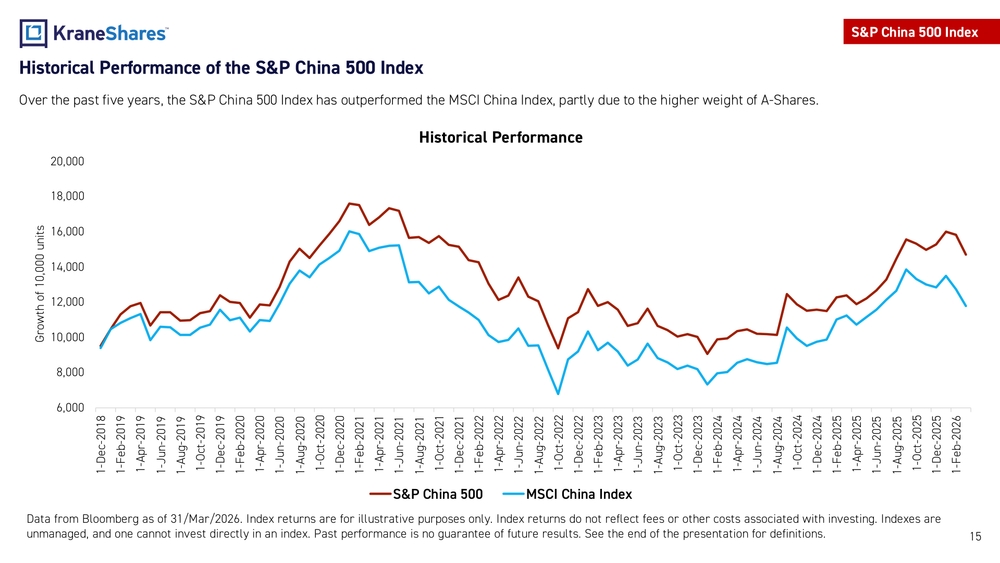
Data from Bloomberg as of 31/Mar/2026. Index returns are for illustrative purposes only. Index returns do not reflect fees or other costs associated with investing. Indexes are unmanaged, and one cannot invest directly in an index. Past performance is no guarantee of future results. See the end of the presentation for definitions. 15Historical Performance of the S&P China 500 Index Over the past five years, the S&P China 500 Index has outperformed the MSCI China Index, partly due to the higher weight of A -Shares. S&P China 500 Index 6,0008,00010,00012,00014,00016,00018,00020,000 1-Dec-2018 1-Feb-2019 1-Apr-2019 1-Jun-2019 1-Aug-2019 1-Oct-2019 1-Dec-2019 1-Feb-2020 1-Apr-2020 1-Jun-2020 1-Aug-2020 1-Oct-2020 1-Dec-2020 1-Feb-2021 1-Apr-2021 1-Jun-2021 1-Aug-2021 1-Oct-2021 1-Dec-2021 1-Feb-2022 1-Apr-2022 1-Jun-2022 1-Aug-2022 1-Oct-2022 1-Dec-2022 1-Feb-2023 1-Apr-2023 1-Jun-2023 1-Aug-2023 1-Oct-2023 1-Dec-2023 1-Feb-2024 1-Apr-2024 1-Jun-2024 1-Aug-2024 1-Oct-2024 1-Dec-2024 1-Feb-2025 1-Apr-2025 1-Jun-2025 1-Aug-2025 1-Oct-2025 1-Dec-2025 1-Feb-2026Growth of 10,000 unitsHistorical Performance S&P China 500 MSCI China Index
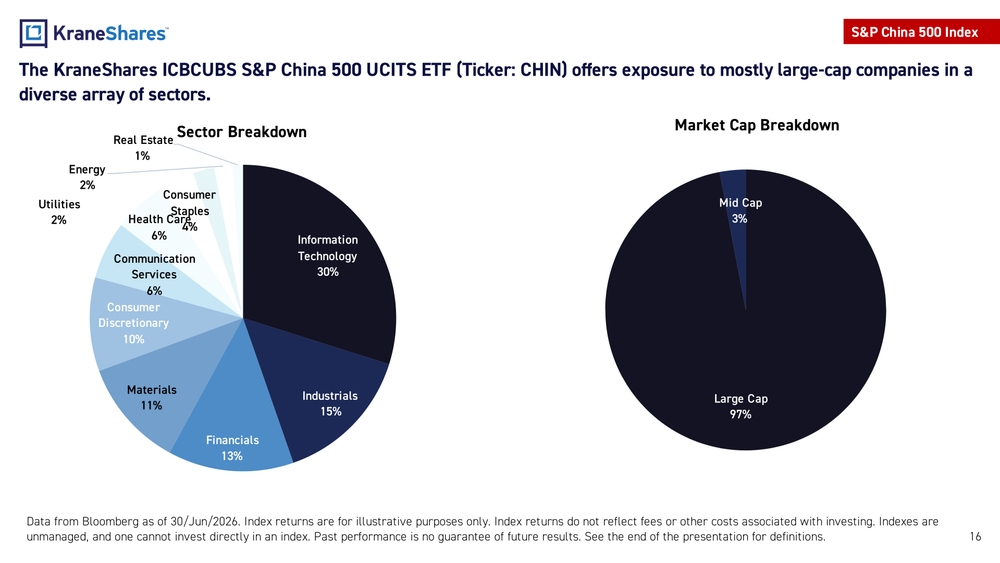
Data from Bloomberg as of 30/Jun/2026. Index returns are for illustrative purposes only. Index returns do not reflect fees or other costs associated with investing. Indexes are unmanaged, and one cannot invest directly in an index. Past performance is no guarantee of future results. See the end of the presentation for definitions. 16The KraneShares ICBCUBS S&P China 500 UCITS ETF (Ticker: CHIN) offers exposure to mostly large -cap companies in a diverse array of sectors.S&P China 500 Index Large Cap 97%Mid Cap 3%Market Cap Breakdown Information Technology 30% Industrials 15% Financials 13%Materials 11%Consumer Discretionary 10%Communication Services 6%Health Care 6%Consumer Staples 4%Utilities 2%Energy 2%Real Estate 1%Sector Breakdown
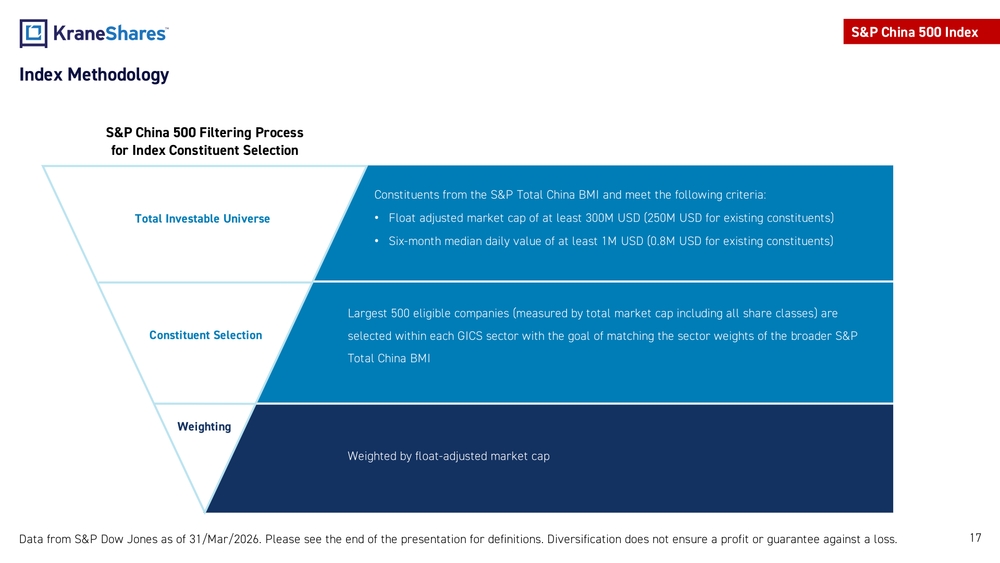
17Index MethodologyATotal Investable Universe Constituent Selection WeightingConstituents from the S&P Total China BMI and meet the following criteria: •Float adjusted market cap of at least 300M USD (250M USD for existing constituents) •Six-month median daily value of at least 1M USD (0.8M USD for existing constituents) Largest 500 eligible companies (measured by total market cap including all share classes) are selected within each GICS sector with the goal of matching the sector weights of the broader S&P Total China BMI Weighted by float -adjusted market capS&P China 500 Filtering Process for Index Constituent Selection Data from S&P Dow Jones as of 31/Mar/2026. Please see the end of the presentation for definitions. Diversification does not e nsure a profit or guarantee against a loss. S&P China 500 Index
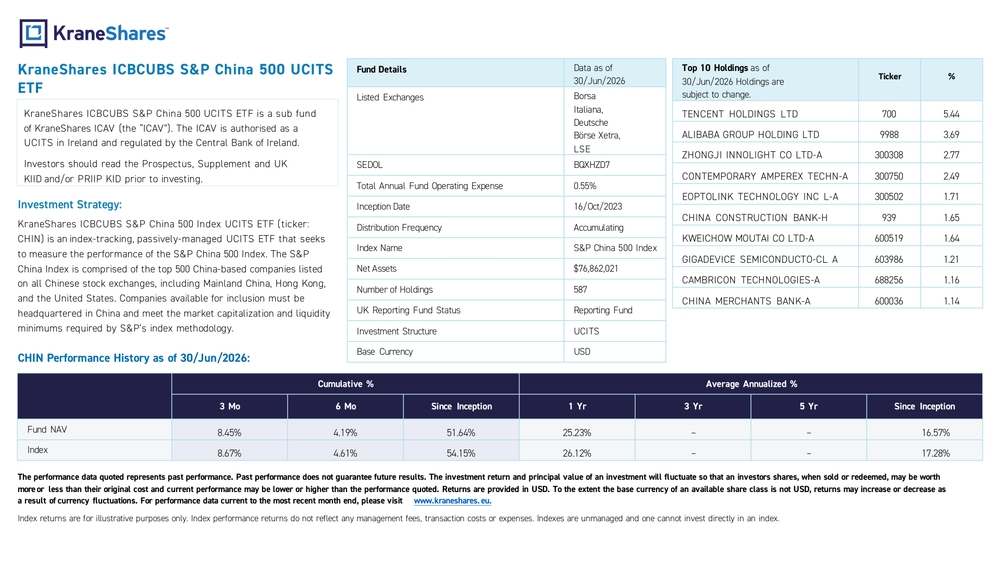
KraneShares ICBCUBS S&P China 500 UCITS ETF KraneShares ICBCUBS S&P China 500UCITS ETF isasubfund of KraneShares ICAV (the “ICAV”). TheICAV isauthorised asa UCITS in Ireland andregulated bytheCentral Bank ofIreland. Investors should read theProspectus, Supplement andUK KIID and/or PRIIP KIDprior toinvesting. Investment Strategy: KraneShares ICBCUBS S&P China 500Index UCITS ETF (ticker: CHIN) is anindex -tracking ,passively -managed UCITS ETF that seeks tomeasure theperformance oftheS&P China 500Index. TheS&P China Index is comprised ofthetop500China -based companies listed onallChinese stock exchanges, including Mainland China, Hong Kong, andtheUnited States. Companies available forinclusion must be headquartered in China andmeet themarket capitalization andliquidity minimums required byS&P’s index methodology. CHIN Performance History asof30/Jun /202 6:Fund Details Data as of 30/Jun/2026 Listed Exchanges Borsa Italiana, Deutsche Börse Xetra, LSE SEDOL BQXHZD7 Total Annual Fund Operating Expense 0.55% Inception Date 16/Oct/2023 Distribution Frequency Accumulating Index Name S&P China 500Index NetAssets $76,862,021 Number ofHoldings 587 UK Reporting Fund Status Reporting Fund Investment Structure UCITS Base Currency USDTop10Holdings asof 30/Jun/202 6Holdings are subject tochange.Ticker % TENCENT HOLDINGS LTD 700 5.44 ALIBABA GROUP HOLDING LTD 9988 3.69 ZHONGJI INNOLIGHT COLTD-A 300308 2.77 CONTEMPORARY AMPEREX TECHN -A 300750 2.49 EOPTOLINK TECHNOLOGY INC L-A 300502 1.71 CHINA CONSTRUCTION BANK -H 939 1.65 KWEICHOW MOUTAI COLTD-A 600519 1.64 GIGADEVICE SEMICONDUCTO -CLA 603986 1.21 CAMBRICON TECHNOLOGIES -A 688256 1.16 CHINA MERCHANTS BANK -A 600036 1.14 Cumulative % Average Annualized % 3Mo 6Mo Since Inception 1Yr 3Yr 5Yr Since Inception Fund NAV 8.45% 4.19% 51.64% 25.23% – – 16.57% Index 8.67% 4.61% 54.15% 26.12% – – 17.28% Theperformance data quoted represents past performance. Past performance does notguarantee future results. Theinvestment return andprincipal value ofaninvestment will fluctuate sothat aninvestors shares, when sold orredeemed, may beworth more orless than their original cost andcurrent performance may belower orhigher than theperformance quoted. Returns areprovided inUSD. Totheextent thebase currency ofanavailable share class isnotUSD, returns may increase ordecrease as aresult of currency fluctuations. Forperformance data current tothemost recent month end, please visit www.kraneshares. eu. Index returns areforillustrative purposes only. Index performance returns donotreflect anymanagement fees, transaction costs orexpenses. Indexes areunmanaged and onecannot invest directly inanindex.
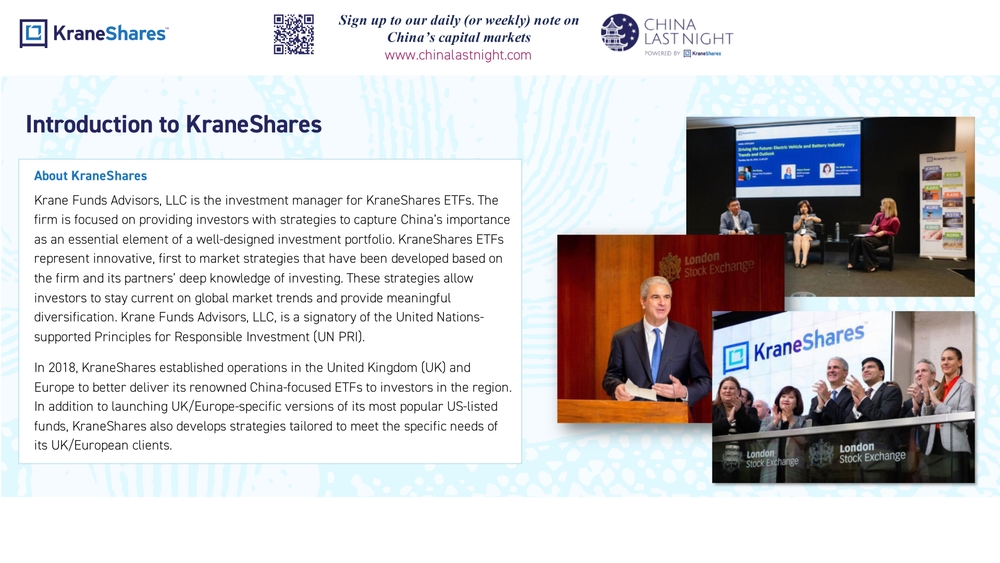
Introduction to KraneShares About KraneShares Krane Funds Advisors, LLC is the investment manager for KraneShares ETFs. The firm is focused on providing investors with strategies to capture China’s importance as an essential element of a well -designed investment portfolio. KraneShares ETFs represent innovative, first to market strategies that have been developed based on the firm and its partners’ deep knowledge of investing. These strategies allow investors to stay current on global market trends and provide meaningful diversification. Krane Funds Advisors, LLC, is a signatory of the United Nations - supported Principles for Responsible Investment (UN PRI). In 2018, KraneShares established operations in the United Kingdom (UK) and Europe to better deliver its renowned China -focused ETFs to investors in the region. In addition to launching UK/Europe -specific versions of its most popular US -listed funds, KraneShares also develops strategies tailored to meet the specific needs of its UK/European clients. Sign up to our daily (or weekly) note on China’s capital markets www.chinalastnight.com
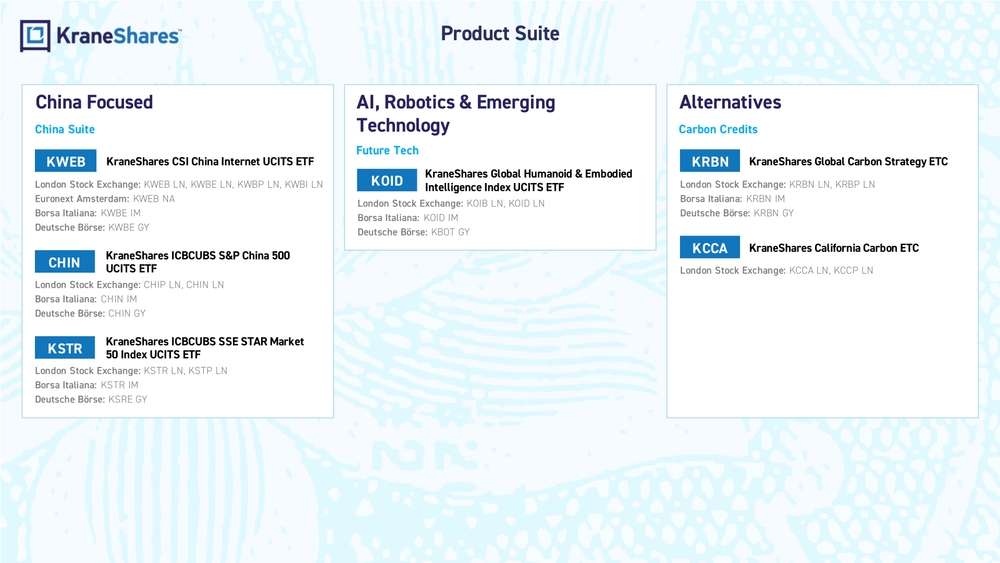
China Focused Alternatives AI, Robotics & Emerging Technology China Suite Future TechCarbon CreditsProduct Suite KWEB KraneShares CSI China Internet UCITS ETF London Stock Exchange: KWEB LN, KWBE LN, KWBP LN, KWBI LN Euronext Amsterdam: KWEB NA Borsa Italiana: KWBE IM Deutsche Börse: KWBE GY London Stock Exchange: CHIP LN, CHIN LN Borsa Italiana: CHIN IM Deutsche Börse: CHIN GYKraneShares ICBCUBS S&P China 500 UCITS ETFCHIN KSTRKraneShares ICBCUBS SSE STAR Market 50 Index UCITS ETF London Stock Exchange: KSTR LN, KSTP LN Borsa Italiana: KSTR IM Deutsche Börse: KSRE GYKOIDKraneShares Global Humanoid & Embodied Intelligence Index UCITS ETF London Stock Exchange: KOIB LN, KOID LN Borsa Italiana: KOID IM Deutsche Börse: KBOT GYKraneShares Global Carbon Strategy ETC KRBN London Stock Exchange: KRBN LN, KRBP LN Borsa Italiana: KRBN IM Deutsche Börse: KRBN GY KCCA KraneShares California Carbon ETC London Stock Exchange: KCCA LN, KCCP LN
21Index definitions:
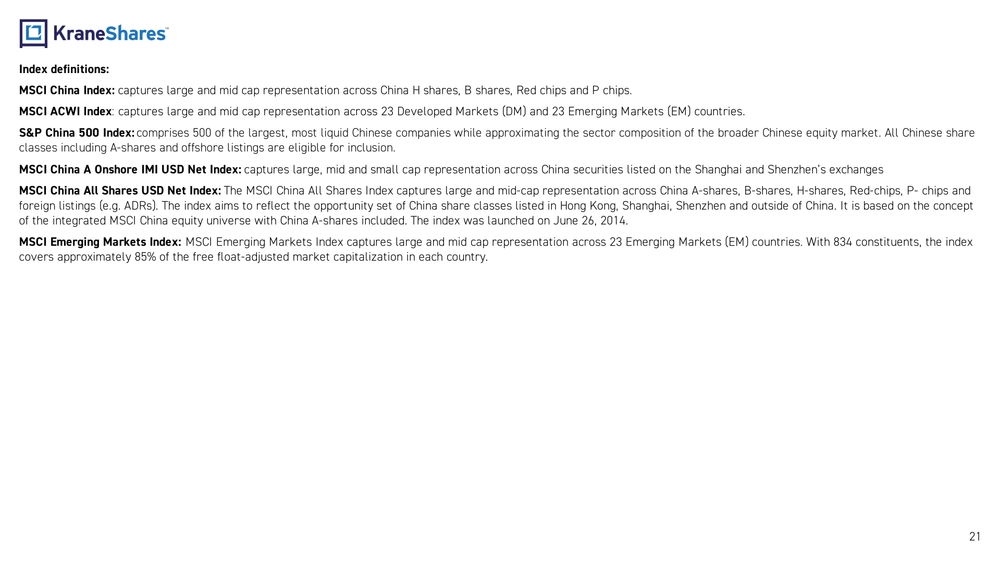
MSCI China Index: captures large and mid cap representation across China H shares, B shares, Red chips and P chips.
MSCI ACWI Index : captures large and mid cap representation across 23 Developed Markets (DM) and 23 Emerging Markets (EM) countries.
S&P China 500 Index: comprises 500 of the largest, most liquid Chinese companies while approximating the sector composition of the broader Chinese equity market. All Chinese share
classes including A -shares and offshore listings are eligible for inclusion.
MSCI China A Onshore IMI USD Net Index : captures large, mid and small cap representation across China securities listed on the Shanghai and Shenzhen’s exchanges
MSCI China All Shares USD Net Index: The MSCI China All Shares Index captures large and mid -cap representation across China A‐shares, B‐shares, H‐shares, Red‐chips, P‐ chips and
foreign listings (e.g. ADRs). The index aims to reflect the opportunity set of China share classes listed in Hong Kong, Shang hai, Shenzhen and outside of China. It is based on the concept
of the integrated MSCI China equity universe with China A -shares included. The index was launched on June 26, 2014.
MSCI Emerging Markets Index: MSCI Emerging Markets Index captures large and mid cap representation across 23 Emerging Markets (EM) countries. With 834 con stituents, the index
covers approximately 85% of the free float -adjusted market capitalization in each country.
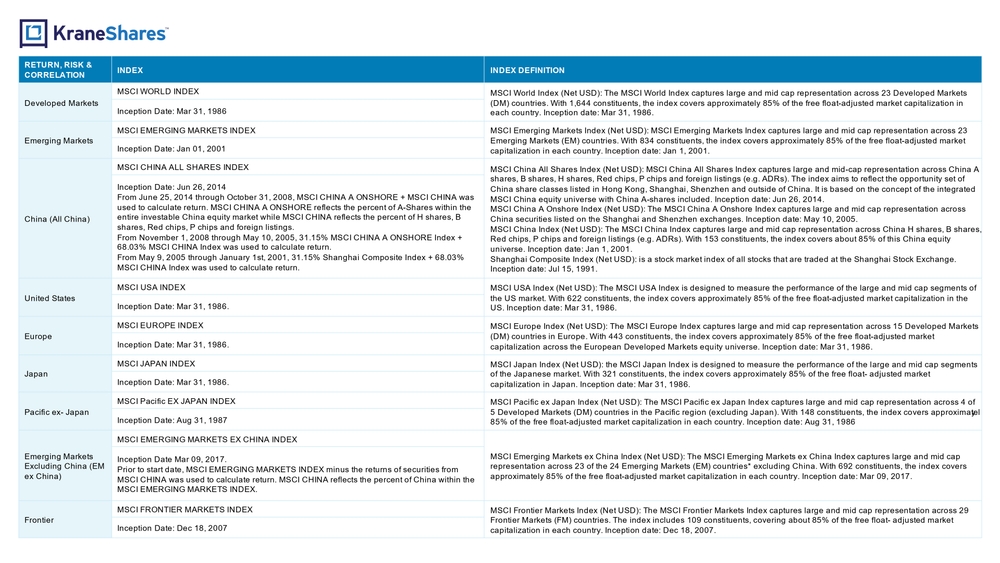
RETURN, RISK &
CORRELATION INDEX INDEX DEFINITION
Developed Markets MSCI WORLD INDEX MSCI World Index (Net USD): The MSCI World Index captures large and mid cap representation across 23 Developed Markets
(DM) countries. With 1,644 constituents, the index covers approximately 85% of the free float -adjusted market capitalization in
each country. Inception date: Mar 31, 1986. Inception Date: Mar 31, 1986
Emerging Markets MSCI EMERGING MARKETS INDEX MSCI Emerging Markets Index (Net USD): MSCI Emerging Markets Index captures large and mid cap representation across 23
Emerging Markets (EM) countries. With 834 constituents, the index covers approximately 85% of the free float -adjusted market
capitalization in each country. Inception date: Jan 1, 2001. Inception Date: Jan 01, 2001
China (All China)MSCI CHINA ALL SHARES INDEX MSCI China All Shares Index (Net USD): MSCI China All Shares Index captures large and mid -cap representation across China A
shares, B shares, H shares, Red chips, P chips and foreign listings (e.g. ADRs). The index aims to reflect the opportunity set of
China share classes listed in Hong Kong, Shanghai, Shenzhen and outside of China. It is based on the concept of the integrate d
MSCI China equity universe with China A -shares included. Inception date: Jun 26, 2014.
MSCI China A Onshore Index (Net USD): The MSCI China A Onshore Index captures large and mid cap representation across
China securities listed on the Shanghai and Shenzhen exchanges. Inception date: May 10, 2005.
MSCI China Index (Net USD): The MSCI China Index captures large and mid cap representation across China H shares, B shares,
Red chips, P chips and foreign listings (e.g. ADRs). With 153 constituents, the index covers about 85% of this China equity
universe. Inception date: Jan 1, 2001.
Shanghai Composite Index (Net USD) : is a stock market index of all stocks that are traded at the Shanghai Stock Exchange.
Inception date: Jul 15, 1991. Inception Date: Jun 26, 2014
From June 25, 2014 through October 31, 2008, MSCI CHINA A ONSHORE + MSCI CHINA was
used to calculate return. MSCI CHINA A ONSHORE reflects the percent of A -Shares within the
entire investable China equity market while MSCI CHINA reflects the percent of H shares, B
shares, Red chips, P chips and foreign listings.
From November 1, 2008 through May 10, 2005, 31.15% MSCI CHINA A ONSHORE Index +
68.03% MSCI CHINA Index was used to calculate return.
From May 9, 2005 through January 1st, 2001, 31.15% Shanghai Composite Index + 68.03%
MSCI CHINA Index was used to calculate return.
United States MSCI USA INDEX MSCI USA Index (Net USD): The MSCI USA Index is designed to measure the performance of the large and mid cap segments of
the US market. With 622 constituents, the index covers approximately 85% of the free float -adjusted market capitalization in the
US. Inception date: Mar 31, 1986. Inception Date: Mar 31, 1986.
Europe MSCI EUROPE INDEX MSCI Europe Index (Net USD): The MSCI Europe Index captures large and mid cap representation across 15 Developed Markets
(DM) countries in Europe. With 443 constituents, the index covers approximately 85% of the free float -adjusted market
capitalization across the European Developed Markets equity universe. Inception date: Mar 31, 1986. Inception Date: Mar 31, 1986.
Japan MSCI JAPAN INDEX MSCI Japan Index (Net USD): the MSCI Japan Index is designed to measure the performance of the large and mid cap segments
of the Japanese market. With 321 constituents, the index covers approximately 85% of the free float - adjusted market
capitalization in Japan. Inception date: Mar 31, 1986. Inception Date: Mar 31, 1986.
Pacific ex - Japan MSCI Pacific EX JAPAN INDEX MSCI Pacific ex Japan Index (Net USD): The MSCI Pacific ex Japan Index captures large and mid cap representation across 4 of
5 Developed Markets (DM) countries in the Pacific region (excluding Japan). With 148 constituents, the index covers approxima tely
85% of the free float -adjusted market capitalization in each country. Inception date: Aug 31, 1986 Inception Date: Aug 31, 1987
Emerging Markets
Excluding China (EM
ex China)MSCI EMERGING MARKETS EX CHINA INDEX
MSCI Emerging Markets ex China Index (Net USD): The MSCI Emerging Markets ex China Index captures large and mid cap
representation across 23 of the 24 Emerging Markets (EM) countries* excluding China. With 692 constituents, the index covers
approximately 85% of the free float -adjusted market capitalization in each country. Inception date: Mar 09, 2017.Inception Date Mar 09, 2017.
Prior to start date, MSCI EMERGING MARKETS INDEX minus the returns of securities from
MSCI CHINA was used to calculate return. MSCI CHINA reflects the percent of China within the
MSCI EMERGING MARKETS INDEX.
Frontier MSCI FRONTIER MARKETS INDEX MSCI Frontier Markets Index (Net USD): The MSCI Frontier Markets Index captures large and mid cap representation across 29
Frontier Markets (FM) countries. The index includes 109 constituents, covering about 85% of the free float - adjusted market
capitalization in each country. Inception date: Dec 18, 2007. Inception Date: Dec 18, 2007
23Term definitions:
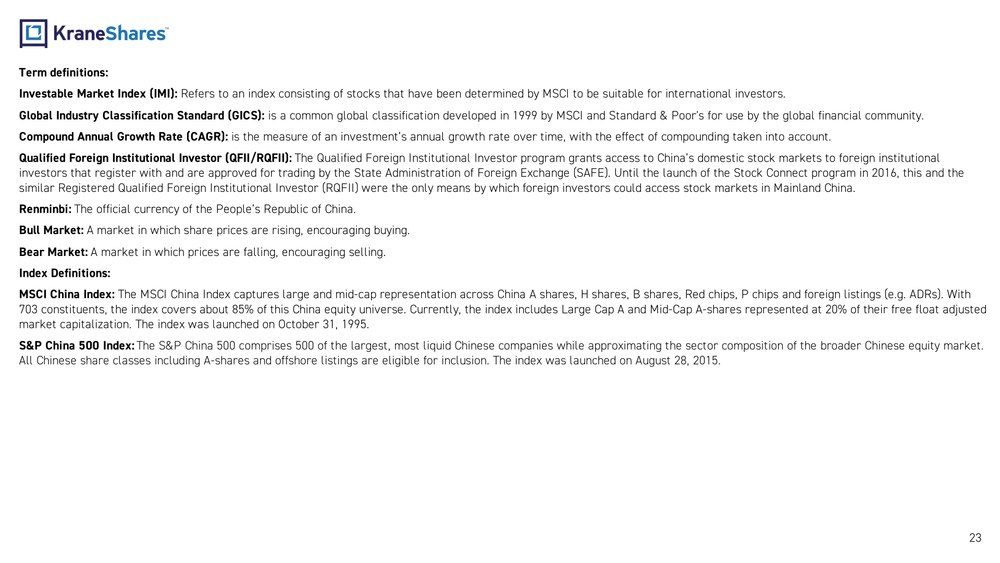
Investable Market Index (IMI): Refers to an index consisting of stocks that have been determined by MSCI to be suitable for international investors.
Global Industry Classification Standard (GICS): is a common global classification developed in 1999 by MSCI and Standard & Poor's for use by the global financial community.
Compound Annual Growth Rate (CAGR): is the measure of an investment’s annual growth rate over time, with the effect of compounding taken into account.
Qualified Foreign Institutional Investor (QFII/RQFII): The Qualified Foreign Institutional Investor program grants access to China’s domestic stock markets to foreign institutional
investors that register with and are approved for trading by the State Administration of Foreign Exchange (SAFE). Until the l aunch of the Stock Connect program in 2016, this and the
similar Registered Qualified Foreign Institutional Investor (RQFII) were the only means by which foreign investors could acce ss stock markets in Mainland China.
Renminbi: The official currency of the People’s Republic of China.
Bull Market: A market in which share prices are rising, encouraging buying.
Bear Market: A market in which prices are falling, encouraging selling.
Index Definitions:
MSCI China Index: The MSCI China Index captures large and mid -cap representation across China A shares, H shares, B shares, Red chips, P chips and foreign listings (e.g. ADRs). With
703 constituents, the index covers about 85% of this China equity universe. Currently, the index includes Large Cap A and Mid -Cap A-shares represented at 20% of their free float adjusted
market capitalization. The index was launched on October 31, 1995.
S&P China 500 Index: The S&P China 500 comprises 500 of the largest, most liquid Chinese companies while approximating the sector composition of t he broader Chinese equity market.
All Chinese share classes including A -shares and offshore listings are eligible for inclusion. The index was launched on August 28, 2015.
24Important Notes
Carefully consider the Funds’ investment objectives, risk factors, charges and expenses before investing. This and additional information can be found in the Funds‘ full and summary prospectus,
which may be obtained by visiting www.kraneshares.eu. Read the prospectus carefully before investing.
Risk Disclosures
The views and opinions expressed in this material are those of authors of the Krane Fund Advisors. These opinions have been g iven in faith, but are subject to change without notice. It is the responsibility
of the investor to evaluate the accuracy, completeness and usefulness of any opinions, advice or other information provided. Instead, investors must buy and sell UCITS shares in the secondary market
with the assistance of a stockbroker.
UCITS ETF’s units/shares purchased on the secondary market cannot usually be sold directly back t the UCITS ETF. Investors mu st buy and sell units/shares on a seconfary market with the assistance if
an intermediary (e.g. a stockbroker) and may incur fees for doing so. In addition, investors may pay more than the current ne t asset value when buying units/shares and may receive less than the current
net asset value when selling them.
UCITS shares are not individually redeemable with the issuing fund other than in large Creation Unit aggregations. In doing s o, the investor may incur brokerage commissions and may pay more than net
asset value (NAV) when buying and receive less than net asset value (NAV) when selling. The Net Asset Value per share is calc ulated in accordance with the “Determination of Net Asset Value” section of
the prospectus, using the official closing price published by the relevant exchange. Shares are bought and sold at market pri ce which may or may not be consistent with NAV.
Investing involves risk, including possible loss of principal. There can be no assurance that a Fund will achieve its stated objectives. The Funds are subject to political, social or economic instability within
China which may cause decline in value. Fluctuations in currency of foreign countries may have an adverse effect to domestic currency values. Emerging markets involve heightened risk related to the
same factors as well as increase volatility and lower trading volume.
The ability of the Fund to achieve its respective investment objectives is dependent, in part, on the continuous availability of A Shares and the ability to obtain, if necessary, additional A Shares quota. If the Fund
is unable to obtain sufficient exposure to limited availability of A Share quota, the Fund could seek exposure to the component securities of the Underlying Index by investment in other types of securities. The
Fund is subject to political, social or economic instability within China which may cause decline in value. Emerging markets involve heightened risk related to the same factors as well as increase volatility
and lower trading volume. Fluctuations in currency of foreign countries may have an adverse effect to domestic currency values. The Fund may invest in Initial Public Offerings (IPOs). Securities issued in
IPOs have no trading history, and information about the companies may be available for very limited periods. In addition, the prices of securities sold in IPOs may be highly volatile. In addition, as the Fund
increases in size, the impact of IPOs on the Fund’s performance will generally decrease.
Narrowly focused investments typically exhibit higher volatility. The Fund’s assets are expected to be concentrated in a sector, industry, market, or group of concentrations to the extent that the Underlying
Index has such concentrations. The securities or futures in that concentration could react similarly to market developments. Thus, the Fund is subject to loss due to adverse occurrences that affect that
concentration. In addition to the normal risks associated with investing, investments in smaller companies typically exhibit higher volatility.
This material is for information only and does not constitute an offer or recommendation to buy or sell any investment, or su bscribe to any investment management or advisory service. It is not, under any
circumstances, intended for distribution to the general public. You are accessing information which constitutes a financial p romotion under section 21 of the Financial Services and Markets Act 2000
("FSMA"). In relation to the United Kingdom, this information is only directed at, and may only be distributed to, persons wh o are “Investment Professionals” (being persons having professional experience
in matters relating to investments) within the meaning of article 19(5) of the FSMA (Financial Promotion) Order 2005 (the “Fi nancial Promotion Order ”), persons to whom any of paragraphs (2)(a) to (d) of
article 49 (high net worth companies, unincorporated associations etc.) of the financial promotion order apply, or persons to whom distribution may otherwise lawfully be made.
25Risk Disclosures Continued: Any investment, and investment activity or controlled activity, to which this information relates is available only to such p ersons and will be engaged in only with such persons. Persons that do not have professional experience should not rely or act upon this information unless they are persons to whom any of paragraphs (2)(a) to (d) of article 49 apply to whom distribution of this information may otherwise lawfully be made. In Switzerland, the Fund has appointed as Swiss Representative Waystone Fund Services (Switzerland) SA, Av. Villamont 17, 1005 Lausanne, Switzerland, Tel: +41 21 311 17 77, email: switzerland@waystone.com. The Fund’s paying agent is Helvetische Bank AG. In respect of the Shares distributed in or from Switzerland, the place of performance and jurisdiction is Lausanne (Switzerland). Although the information provided in this document has been obtained from sources which Krane Funds Advisors, LLC believes to be reliable, it does not guarantee accuracy of such information and such information may be incomplete or condensed. Krane Fund Advisors, LLC is appointed to act as investment manager in accordance with the requirements of the Central Bank. The Management Company may decide to terminate the agreements made for the marketing of the Fund in accordance with Article 93a of Directive 2009/65 /EC. KIID and PRIIP documents are available in the language of any Member State where such fund is distributed and the prospectus is only available in English. For additional fund documentation, please visit www.Waystone.com or www.kraneshares.eu . To view our Summary of Investor Rights, available only in English, please visit www.kraneshares.eu or click here . The Fund’s indivative net asset value (iNAV) can be obtained during trading hours at https://www.londonstockexchange.com/stock/CHIN/kraneshares -icav/company -page . R_EU_KS