KOID ETF: First U.S. Humanoid Robotics ETF | KraneShares
by Kraneshares
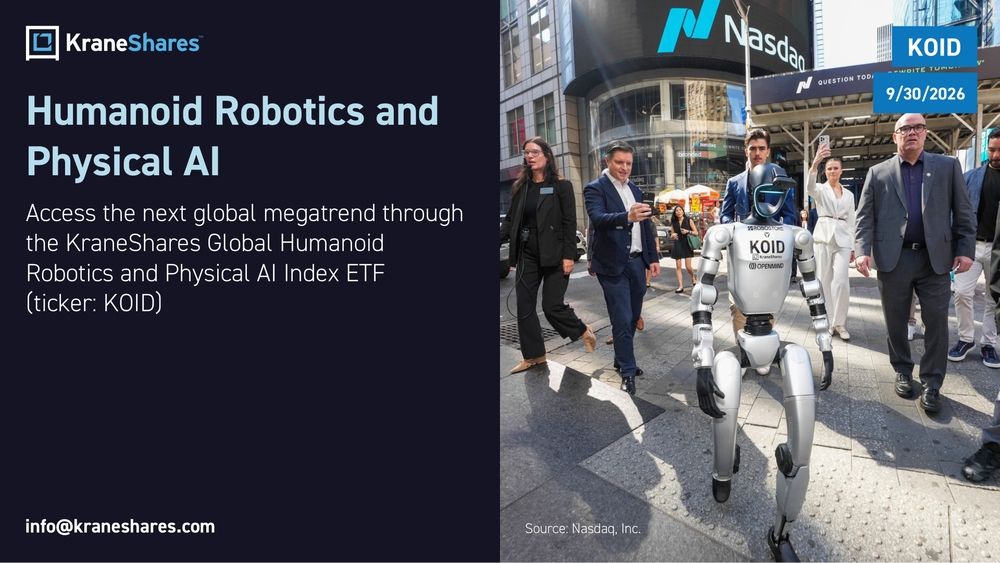
1 info@kraneshares.comHumanoid Robotics and Physical AI Access the next global megatrend through the KraneShares Global Humanoid Robotics and Physical AI Index ETF (ticker: KOID)KOID Source: Nasdaq, Inc.9/30/2026
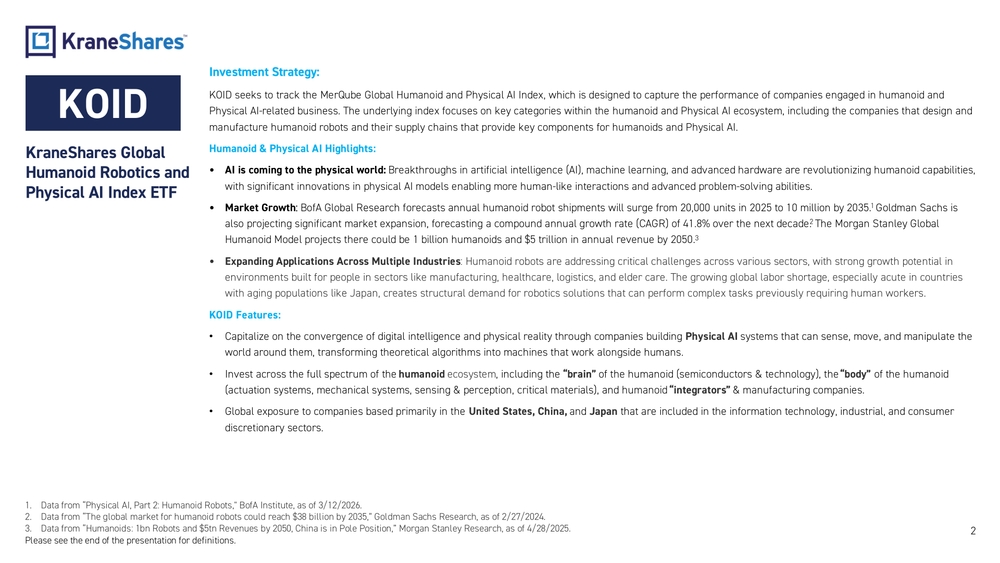
2 1.Data from “Physical AI, Part 2: Humanoid Robots," BofA Institute, as of 3/12/2026. 2.Data from “The global market for humanoid robots could reach $38 billion by 2035,” Goldman Sachs Research, as of 2/27/2024. 3.Data from “Humanoids: 1bn Robots and $5tn Revenues by 2050, China is in Pole Position,” Morgan Stanley Research, as of 4/28/2 025. Please see the end of the presentation for definitions. Investment Strategy: KOID seeks to track the MerQube Global Humanoid and Physical AI Index, which is designed to capture the performance of compan ies engaged in humanoid and Physical AI -related business. The underlying index focuses on key categories within the humanoid and Physical AI ecosystem, incl uding the companies that design and manufacture humanoid robots and their supply chains that provide key components for humanoids and Physical AI. Humanoid & Physical AI Highlights: •AI is coming to the physical world: Breakthroughs in artificial intelligence (AI), machine learning, and advanced hardware are revolutionizing humanoid capabilit ies, with significant innovations in physical AI models enabling more human -like interactions and advanced problem -solving abilities. •Market Growth : BofA Global Research forecasts annual humanoid robot shipments will surge from 20,000 units in 2025 to 10 million by 2035.1 Goldman Sachs is also projecting significant market expansion, forecasting a compound annual growth rate (CAGR) of 41.8% over the next decade.2 The Morgan Stanley Global Humanoid Model projects there could be 1 billion humanoids and $5 trillion in annual revenue by 2050.3 •Expanding Applications Across Multiple Industries : Humanoid robots are addressing critical challenges across various sectors, with strong growth potential in environments built for people in sectors like manufacturing, healthcare, logistics, and elder care. The growing global labor shortage, especially acute in countries with aging populations like Japan, creates structural demand for robotics solutions that can perform complex tasks previously requiring human workers. KOID Features: •Capitalize on the convergence of digital intelligence and physical reality through companies building Physical AI systems that can sense, move, and manipulate the world around them, transforming theoretical algorithms into machines that work alongside humans. •Invest across the full spectrum of the humanoid ecosystem , including the “brain” of the humanoid (semiconductors & technology), the “body” of the humanoid (actuation systems, mechanical systems, sensing & perception, critical materials), and humanoid “integrators” & manufacturing companies. •Global exposure to companies based primarily in the United States, China, and Japan that are included in the information technology, industrial, and consumer discretionary sectors.KraneShares Global Humanoid Robotics and Physical AI Index ETFKOID
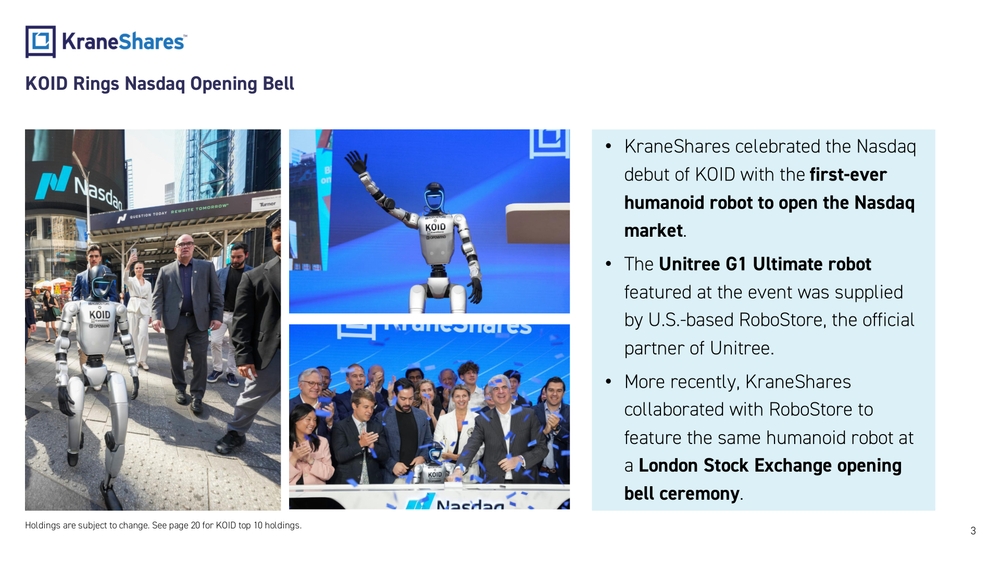
3 KOID Rings Nasdaq Opening Bell •KraneShares celebrated the Nasdaq debut of KOID with the first-ever humanoid robot to open the Nasdaq market . •The Unitree G1 Ultimate robot featured at the event was supplied by U.S. -based RoboStore, the official partner of Unitree . •More recently, KraneShares collaborated with RoboStore to feature the same humanoid robot at a London Stock Exchange opening bell ceremony . Holdings are subject to change. See page 20 for KOID top 10 holdings.
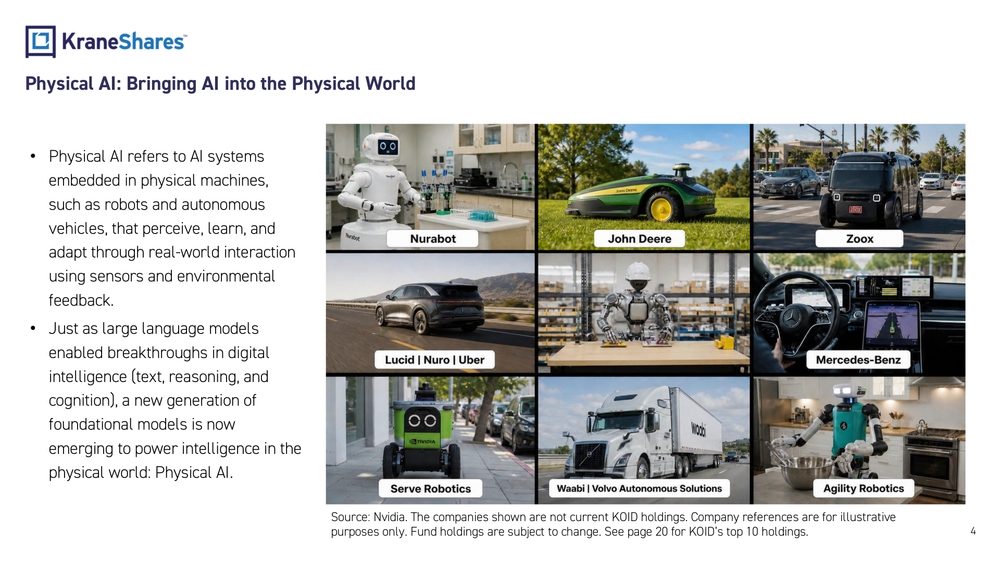
4 Physical AI: Bringing AI into the Physical World •Physical AI refers to AI systems embedded in physical machines, such as robots and autonomous vehicles, that perceive, learn, and adapt through real -world interaction using sensors and environmental feedback. •Just as large language models enabled breakthroughs in digital intelligence (text, reasoning, and cognition), a new generation of foundation al models is now emerging to power intelligence in the physical world: Physical AI. Source: Nvidia . The companies shown are not current KOID holdings. Company references are for illustrative purposes only. Fund holdings are subject to change. See page 20 for KOID’s top 10 holdings.
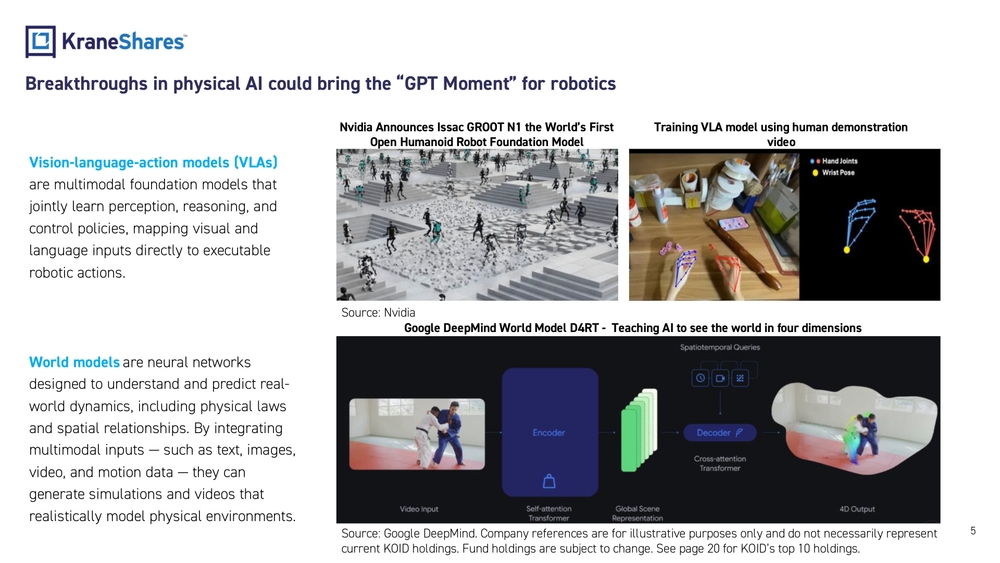
5 Breakthrough s in physical AI could bring the “GPT Moment” for robotics Vision -language -action models (VLAs) are multimodal foundation models that jointly learn perception, reasoning, and control policies, mapping visual and language inputs directly to executable robotic actions. World models are neural networks designed to understand and predict real - world dynamics, including physical laws and spatial relationships. By integrating multimodal inputs — such as text, images, video, and motion data — they can generate simulations and videos that realistically model physical environments. Source: Google DeepMind . Company references are for illustrative purposes only and do not necessarily represent current KOID holdings. Fund holdings are subject to change. See page 20 for KOID’s top 10 holdings.Nvidia Announces Issac GROOT N1 the World’s First Open Humanoid Robot Foundation ModelTraining VLA model using human demonstration video Google DeepMind World Model D4RT - Teaching AI to see the world in four dimensionsSource: Nvidia
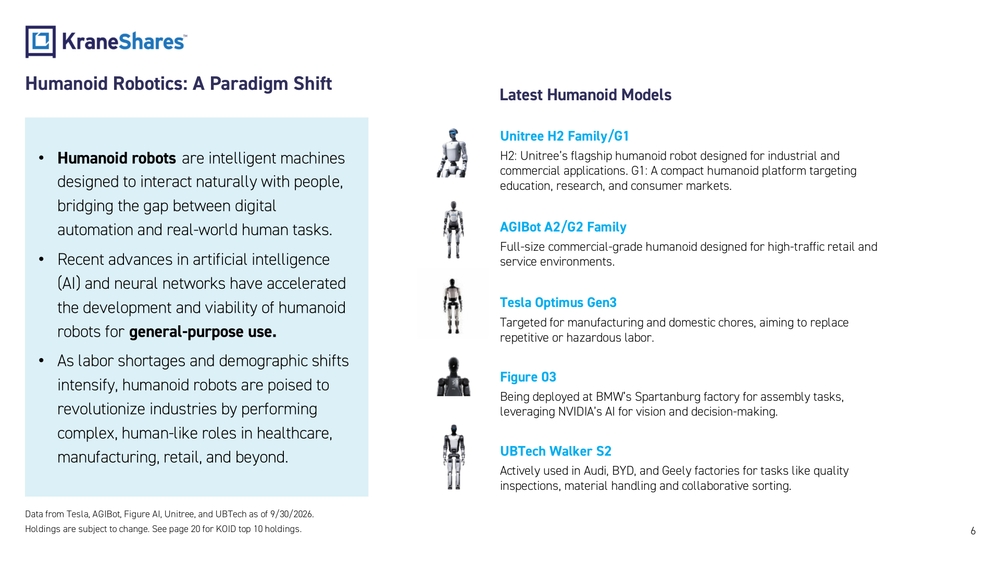
6 Humanoid Robotics: A Paradigm Shift •Humanoid robots are intelligent machines designed to interact naturally with people, bridging the gap between digital automation and real -world human tasks. •Recent advances in artificial intelligence (AI) and neural networks have accelerated the development and viability of humanoid robots for general -purpose use. •As labor shortages and demographic shifts intensify, humanoid robots are poised to revolutionize industries by performing complex, human -like roles in healthcare, manufacturing, retail, and beyond. Data from Tesla, AGIBot , Figure AI, Unitree, and UBTech as of 9/30/2026 .Latest Humanoid Models Holdings are subject to change. See page 20 for KOID top 10 holdings.Unitree H2 Family /G1 H2: Unitree’s flagship humanoid robot designed for industrial and commercial applications. G1: A compact humanoid platform targeting education, research, and consumer markets. AGIBot A2/G2 Family Full-size commercial -grade humanoid designed for high -traffic retail and service environments. Tesla Optimus Gen3 Targeted for manufacturing and domestic chores, aiming to replace repetitive or hazardous labor. Figure 03 Being deployed at BMW’s Spartanburg factory for assembly tasks, leveraging NVIDIA’s AI for vision and decision -making. UBTech Walker S2 Actively used in Audi, BYD, and Geely factories for tasks like quality inspections, material handling and collaborative sorting.
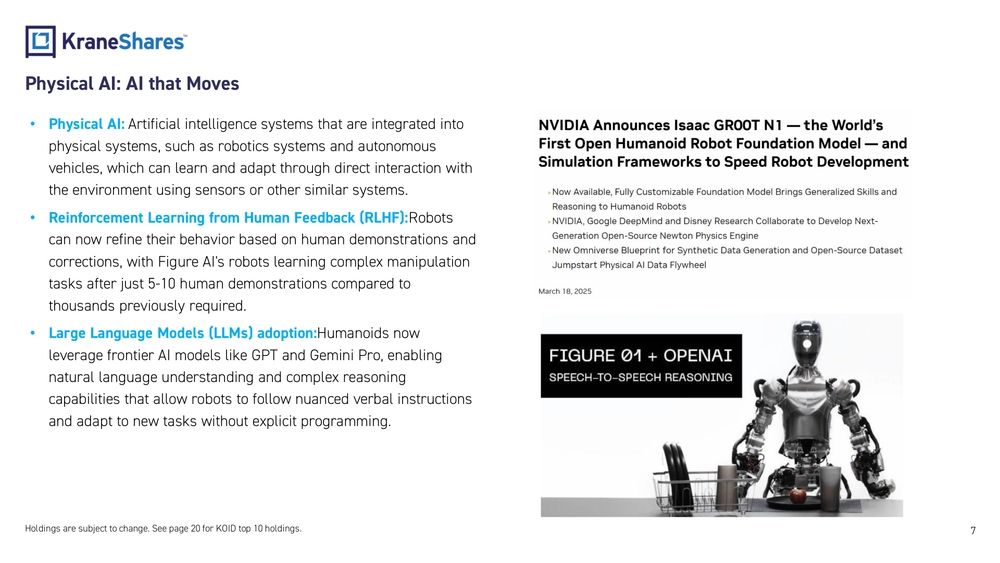
7 Physical AI: AI that Moves •Physical AI: Artificial intelligence systems that are integrated into physical systems, such as robotics systems and autonomous vehicles, which can learn and adapt through direct interaction with the environment using sensors or other similar systems. •Reinforcement Learning from Human Feedback (RLHF): Robots can now refine their behavior based on human demonstrations and corrections, with Figure AI's robots learning complex manipulation tasks after just 5 -10 human demonstrations compared to thousands previously required. •Large Language Models (LLMs) adoption: Humanoids now leverage frontier AI models like GPT and Gemini Pro, enabling natural language understanding and complex reasoning capabilities that allow robots to follow nuanced verbal instructions and adapt to new tasks without explicit programming. Holdings are subject to change. See page 20 for KOID top 10 holdings.
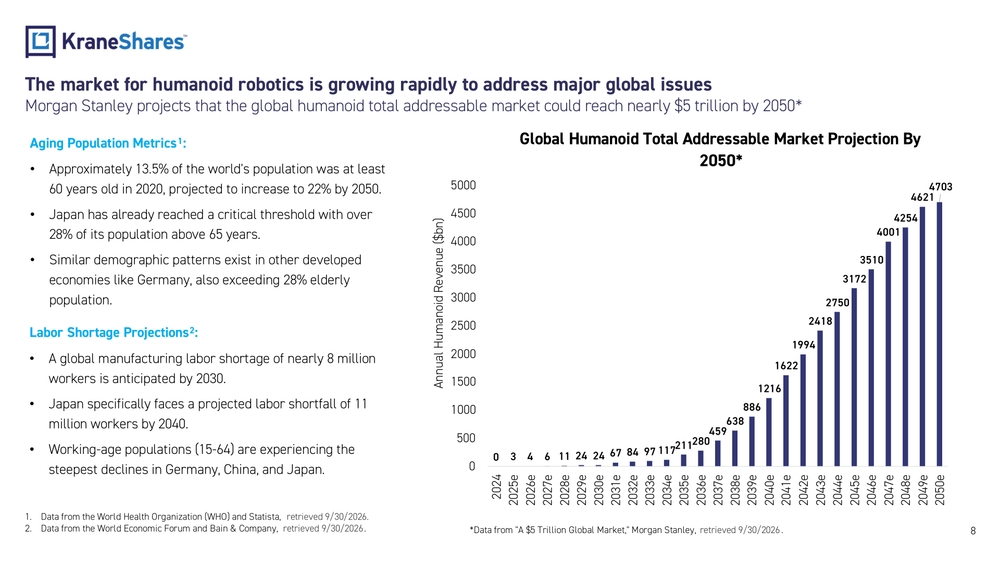
8 The market for humanoid robotics is growing rapidly to address major global issues Morgan Stanley projects that the global humanoid total addressable market could reach nearly $5 trillion by 2050* Aging Population Metrics1: •Approximately 13.5% of the world's population was at least 60 years old in 2020, projected to increase to 22% by 2050. •Japan has already reached a critical threshold with over 28% of its population above 65 years. •Similar demographic patterns exist in other developed economies like Germany, also exceeding 28% elderly population. Labor Shortage Projections2: •A global manufacturing labor shortage of nearly 8 million workers is anticipated by 2030. •Japan specifically faces a projected labor shortfall of 11 million workers by 2040. •Working -age populations (15 -64) are experiencing the steepest declines in Germany, China, and Japan. Data from "A $5 Trillion Global Market," Morgan Stanley , retrieved 9/30/2026 .1.Data from the World Health Organization (WHO) and Statista, retrieved 9/30/2026 . 2.Data from the World Economic Forum and Bain & Company, retrieved 9/30/2026 .034611242467849711721128045963888612161622199424182750317235104001425446214703 0500100015002000250030003500400045005000 2024 2025e 2026e 2027e 2028e 2029e 2030e 2031e 2032e 2033e 2034e 2035e 2036e 2037e 2038e 2039e 2040e 2041e 2042e 2043e 2044e 2045e 2046e 2047e 2048e 2049e 2050eAnnual Humanoid Revenue ($bn)Global Humanoid Total Addressable Market Projection By 2050
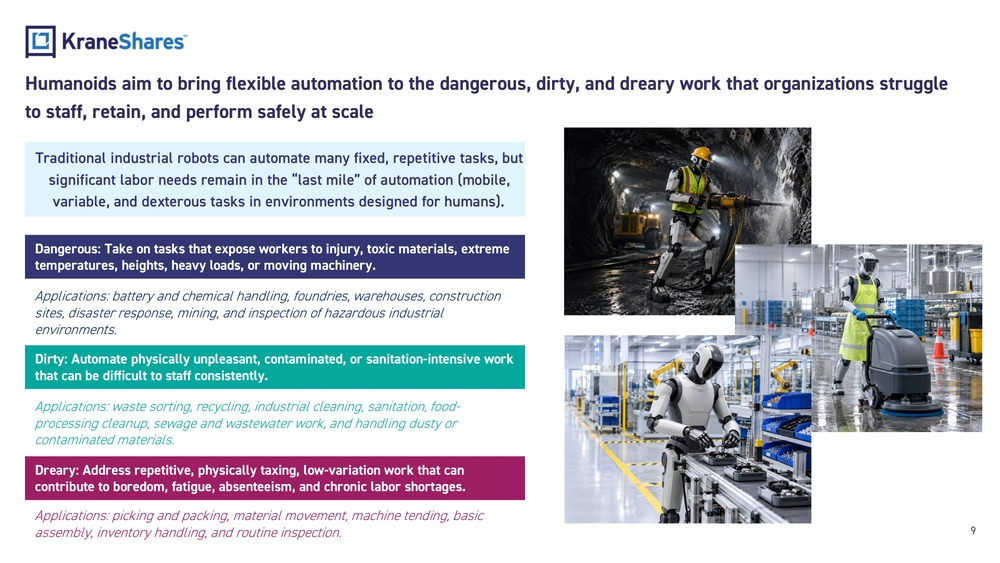
9 Humanoids aim to bring flexible automation to the dangerous, dirty, and dreary work that organizations struggle to staff, retain, and perform safely at scale Dangerous : Take on tasks that expose workers to injury, toxic materials, extreme temperatures, heights, heavy loads, or moving machinery . Dirty : Automate physically unpleasant, contaminated, or sanitation -intensive work that can be difficult to staff consistently . Dreary : Address repetitive, physically taxing, low -variation work that can contribute to boredom, fatigue, absenteeism, and chronic labor shortages .Applications : battery and chemical handling, foundries, warehouses, construction sites, disaster response, mining, and inspection of hazardous industrial environments. Applications: waste sorting, recycling, industrial cleaning, sanitation, food - processing cleanup, sewage and wastewater work, and handling dusty or contaminated materials. Applications: picking and packing, material movement, machine tending, basic assembly, inventory handling, and routine inspection.Traditional industrial robots can automate many fixed, repetitive tasks, but significant labor needs remain in the “last mile” of automation (mobile , variable, and dexterous tasks in environments designed for humans ).
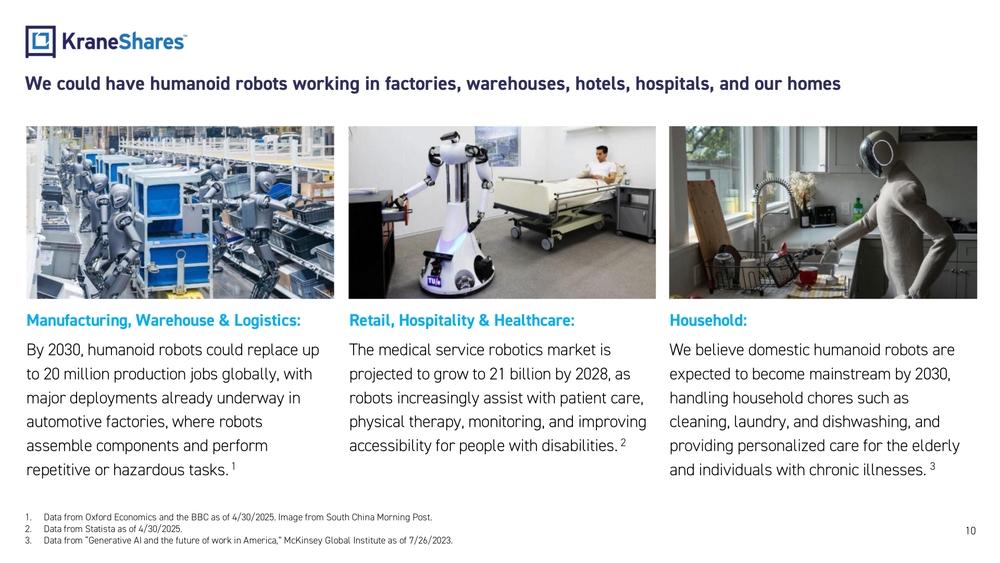
10 We could have humanoid robots working in factories, warehouses, hotels, hospitals, and our homes Manufacturing, Warehouse & Logistics: By 2030, humanoid robots could replace up to 20 million production jobs globally, with major deployments already underway in automotive factories, where robots assemble components and perform repetitive or hazardous tasks.1Retail, Hospitality & Healthcare : The medical service robotics market is projected to grow to 21 billion by 2028, as robots increasingly assist with patient care, physical therapy, monitoring, and improving accessibility for people with disabilities.2Household: We believe domestic humanoid robots are expected to become mainstream by 2030, handling household chores such as cleaning, laundry, and dishwashing, and providing personalized care for the elderly and individuals with chronic illnesses.3
- Data from Oxford Economics and the BBC as of 4/30/2025. Imag e from South China Morning Post.
- Data from Statista as of 4/30/2025.
- Data from “Generative AI and the future of work in America,” McKinsey Global Institute as of 7/26/2023.
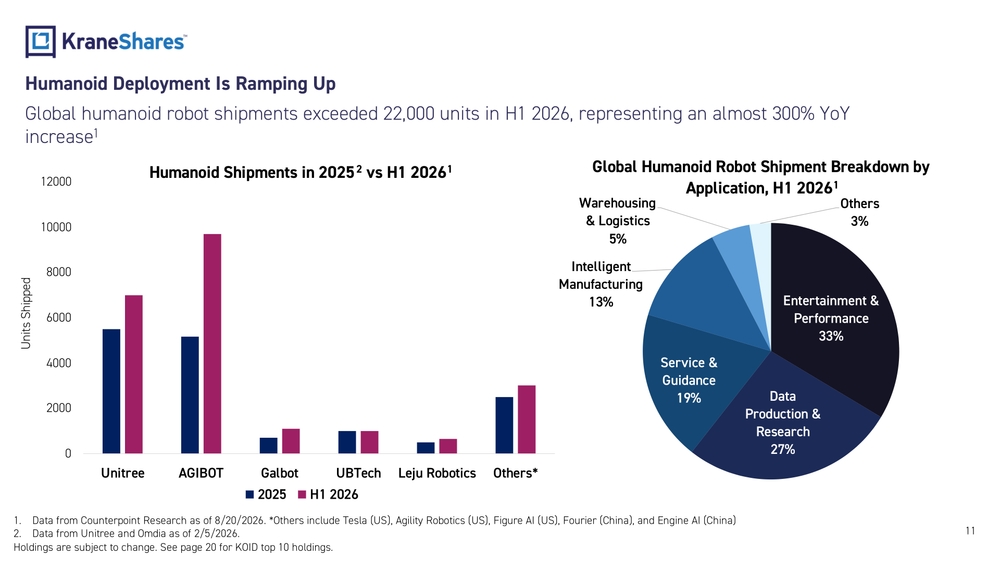
11 Humanoid Deployment Is Ramping Up Global humanoid robot shipments exceeded 22,000 units in H1 2026, representing an almost 300% YoY increase1 1.Data from Counterpoint Research as of 8/20/2026. Others include Tesla (US), Agility Robotics (US), Figure AI (US), Fourier (China), and Engine AI (China ) 2.Data from Unitree and Omdia as of 2/5/2026 . Holdings are subject to change. See page 20 for KOID top 10 holdings.020004000600080001000012000 Unitree AGIBOT Galbot UBTech Leju Robotics OthersUnits ShippedHumanoid Shipments in 20252 vs H1 20261 2025 H1 2026Entertainment & Performance 33% Data Production & Research 27%Service & Guidance 19%Intelligent Manufacturing 13%Warehousing & Logistics 5%Others 3%Global Humanoid Robot Shipment Breakdown by Application, H1 20261
12 3000+ Companies Initial company universe 800+ Companies Industry Filter 50 Companies Humanoid exposure assessment WeightingInitial company will be s elected based on company’s free -float market cap, trading volume, etc. Retain companies that have a minimum market cap of $1 billion and daily traded value of $1 million Each company will be filtered by industry. Trimmed down to Humanoid and Physical AI related i ndustries Companies receive evaluation scores derived from corporate filings, media coverage, and publicly available data regarding their direct participation in Humanoid and Physical AI technologies or their strategic supply chain partnerships with established humanoid robotics firms. Top ranking companies are selected for inclusion in the index. Equal Weighted Rebalanced quarterlyGlobal Humanoid and Physical AI Index MethodologyKOID ETF
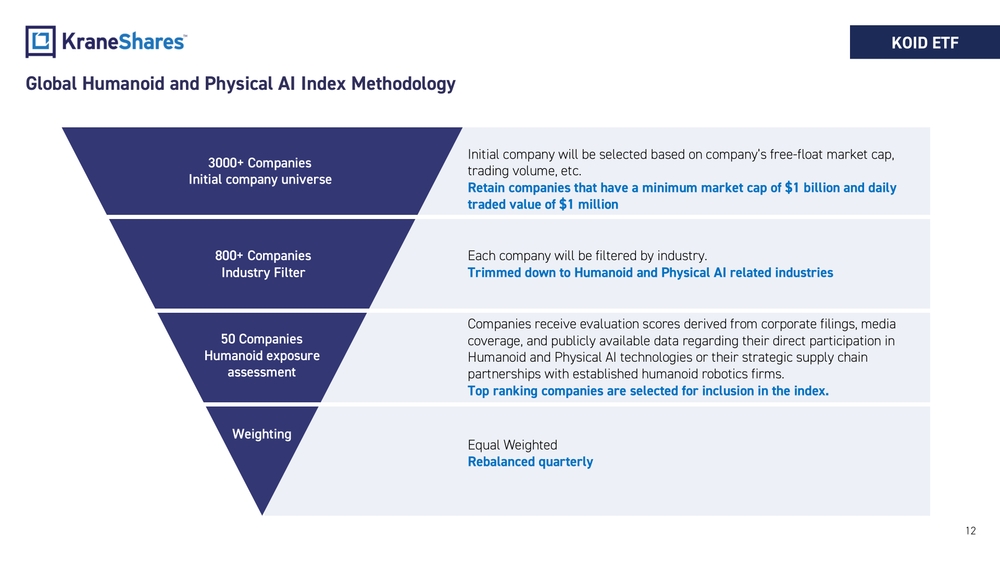
13 •BofA estimated that current building costs for humanoid robots is $35,000 per unit as of 2025, depending on configuration and use case.1 •Rotary actuators, linear actuators, dexterous hand, reducers, bearings, and encoders are key components to build a humanoid. •Looking ahead to 2030 -2035, BofA projects that economies of scale could bring humanoid robot building costs down to $13,000 –$17,000 per unit.1The “body” takes a significant portion of the humanoid value chain
- Data from “Humanoid Robotics 101,” BofA, as of 4/29/2025 .
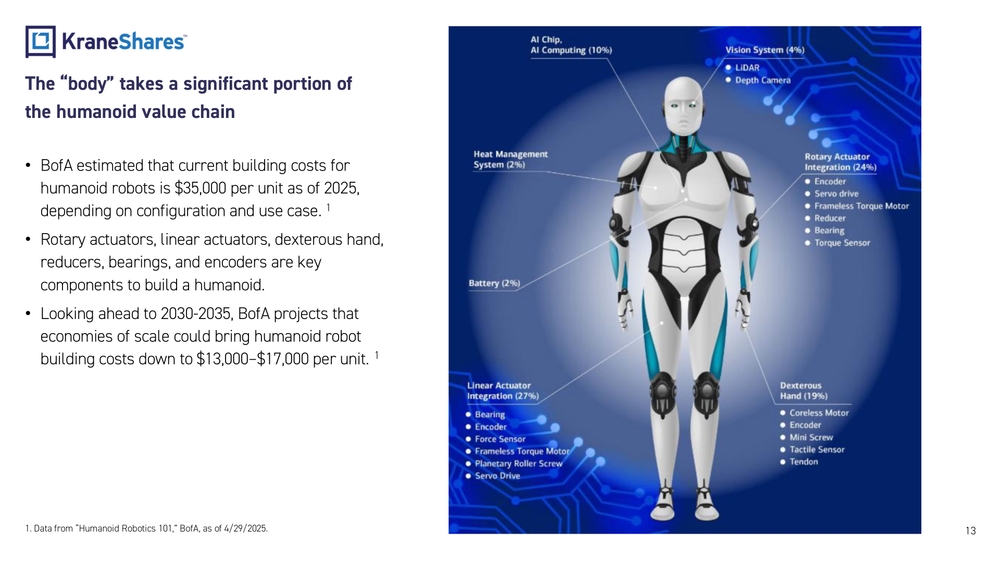
14 The full spectrum of the humanoid value chain Actuation Systems Actuation systems provide the "muscles" of humanoid robots, enabling precise movement and force control. This category includes components critical for joint articulation, energy efficiency, and compact design. Precision here determines agility and energy efficiency. Data from Trendforce , retrieved 9/30/2026 .Actuation and Mechanical Systems account for ~55% of total cost of a humanoid Sensing & Perception Systems account for ~15% of total cost of a humanoidIntelligence Systems account for ~23% of total cost of a humanoid“Brain” “Body” “Integrator”Mechanical Systems Mechanical components form the structural foundation of humanoids, ensuring durability, weight optimization, and smooth motion transmission. Mechanical reliability ensures humanoids operate safely in dynamic environments. Sensing & Perception Sensors and perception systems allow humanoids to interpret their environment, enabling tasks like navigation, object manipulation, and human interaction. Sensor fusion (combining LiDAR, tactile, and vision data) is critical for Physical AI decision -making.Critical Materials Companies supply critical materials for high - performance motors and humanoid manufacturing.Humanoid Integration and Manufacturing Companies in this category focus on designing, assembling, and commercializing complete humanoid robots. Semiconductors & Tech This category provides the computational backbone for humanoid and Physical AI, motor control, and sensor processing.
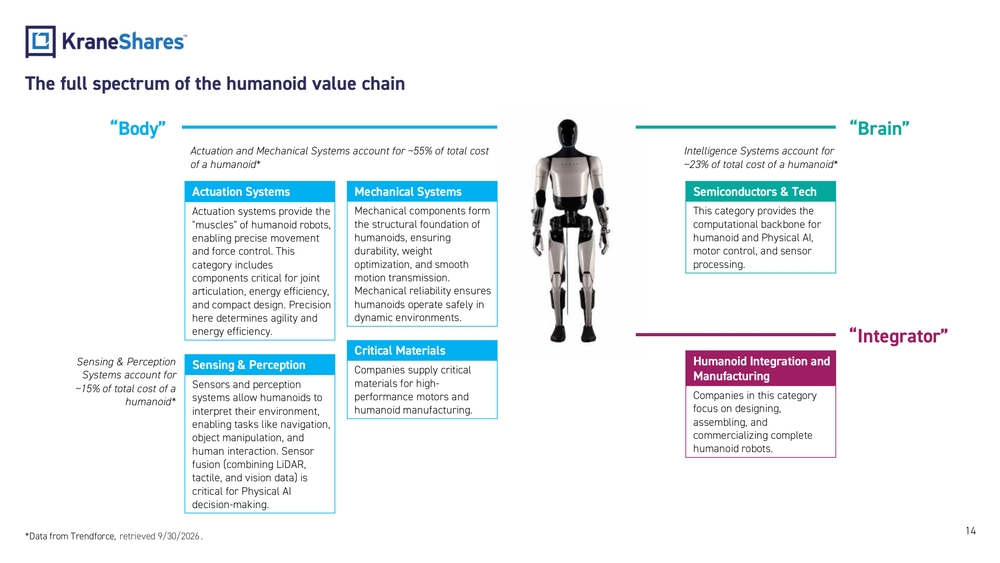
15 The rise of humanoid manufacturing creates investment opportunities for their supply chains and enablers Figure AI Optimus Unitree Holdings are subject to change. See page 20 for KOID top 10 holdings.Apptronik Sanctuary AI
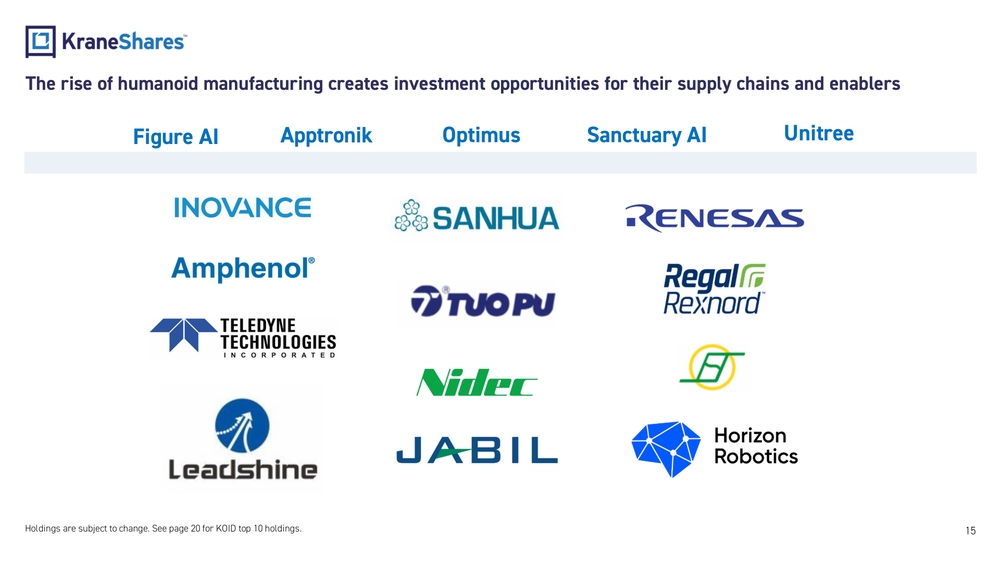
16 Example companies in the humanoid & physical AI ecosystem Sensing & Perception Melexis Sensata Cognex Hexagon Keli Sensing Teledyne KeyenceActuation Systems Tuopu Sanhua Shenzhen Inovance Novanta Leadshine Estun Zhaowei Moons Electric Moog Regal Rexnord Nidec Robotis AllientCritical Materials MP Materials Lynas Rare Earths Northern Rare EarthsMechanical Systems Shuanglin Schaeffler Leader Drive Shuanghuan Doosan THK Hiwin Technologies Jabil Inc Harmonic Drive Systems Jiangsu Hengli Hydraulic Aptiv TE Connectivity Amphenol RBC Bearings NabtescoSemiconductors & Tech Texas Instruments Horizon Robotics Nvidia Teradyne STMicroelectronics Renesas Infineon NXP Semiconductor Analog Devices Monolithic Power Systems Humanoid Integration and Manufacturing Tesla Symbotic UBTech Rainbow Robotics Unitree“Brain” “Body” “Integrator” Holdings are subject to change. See page 20 for KOID top 10 holdings.KOID ETF
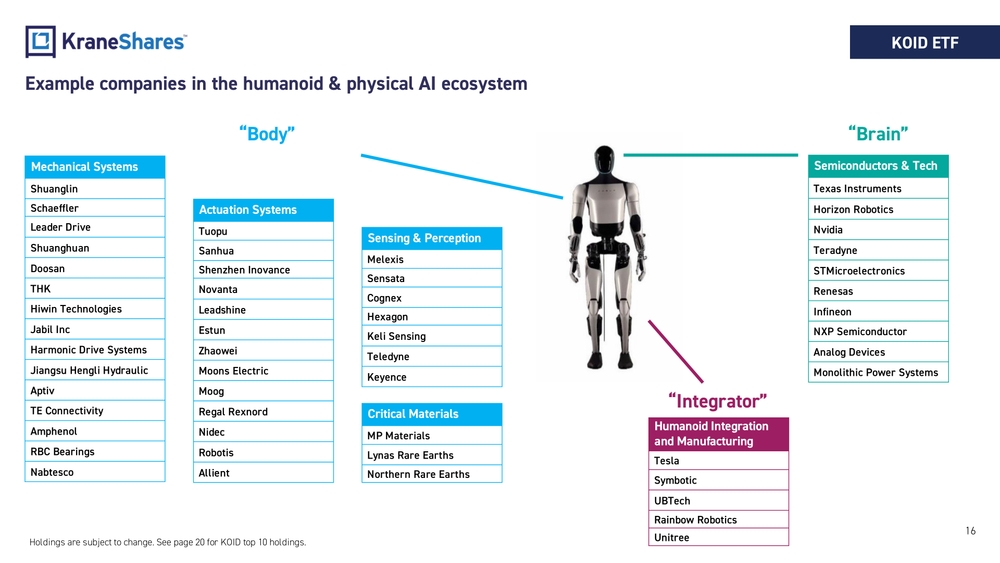
17 Humanoid & Physical AI Ecosystem Category Company Description Actuation SystemsTuopu Core supplier of Tesla’s Optimus, specializing in integrated motor, reducer, and controller systems SanhuaSanhua specializes in bionic robot electromechanical actuators, with particular emphasis on hollow cup motors and harmonic drives used in rotary actuators. Core supplier of Tesla’s Optimus. Novanta Supplies optical/magnetic encoders for real -time position feedback in humanoid joints, enabling precise motion calibration. Mechanical SystemsLeader DriveMajor global manufacturer of humanoid robot precision reducers, essential for converting motor motion and enabling precise, coordinated movement in robotic joints. Shuanghuan Supplies planetary gear systems for humanoid wrist actuators, enhancing grip strength. Amphenol Designs high -speed data connectors for real -time sensor fusion in humanoid perception systems. Sensing & PerceptionKeli Sensing Produces 6 -axis force/torque sensors for humanoid feet/hands, enabling adaptive grip and balance. Sensata Develops MEMS -based tactile sensors for humanoid fingertips, critical for object manipulation. Teledyne Supplies thermal imaging cameras for humanoids operating in low -light conditions. Critical MaterialMP Materials Supplies neodymium magnets for high -performance motors, essential for miniaturized actuators in humanoids. Lynas Rare Earths Major global supplier of rare -earth elements for permanent magnets in humanoid robotics motors. Semiconductors & TechnologyNvidiaProvides Isaac GR00T N1 foundation model for robot reasoning + Newton physics engine (with Google/Disney) for movement simulation. Powers 1X's household robots and Disney's BDX droids. Horizon Robotics Designs energy -efficient AI chips (e.g., Journey 5) for humanoid edge computing, targeting consumer -facing robots. Humanoid Integration & ManufacturingTesla Developing Optimus Gen 3 humanoid robot with 22 -degree -of-freedom hands UnitreeH2: Unitree’s flagship humanoid robot designed for industrial and commercial applications. G1: A compact humanoid platform targeting education, research, and consumer markets.KOID ETF Holdings are subject to change. See page 20 for KOID top 10 holdings.
18 Unitree IPO In 2026KOID ETF
- Data from Wind as of 9/30/2026.
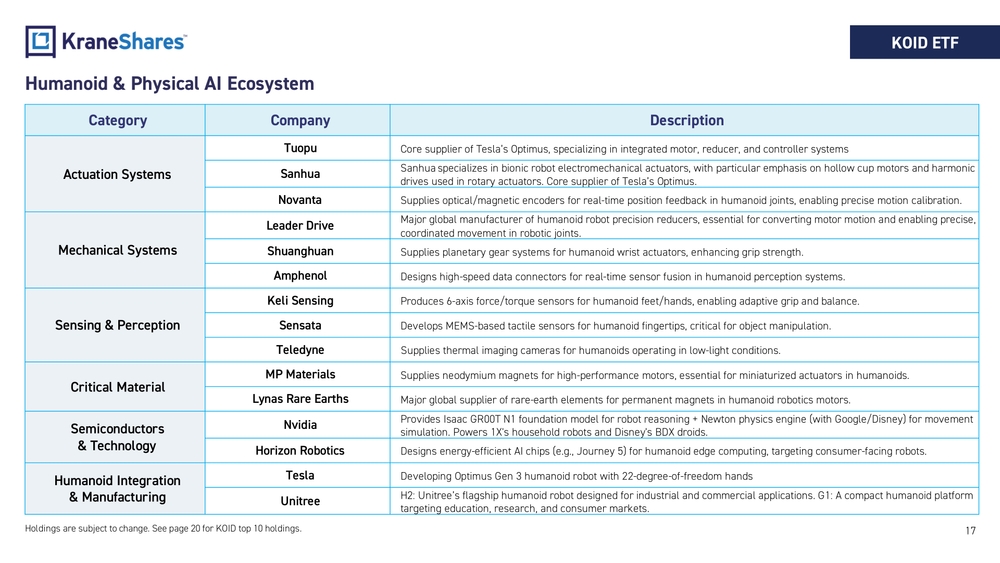
- Data from Bloomberg as of 9/30/2026. Fund holdings are subject to change. See page 20 for KOID’s top 10 holdings.On August 19th, 2026, Unitree had it’s IPO on Shanghai’s STAR Market.1 Unitree’s IPO could be important to KOID’s opportunity set in several ways: • It expands the investable universe of “integrator” companies, particularly within China’s onshore market, complementing existing exposures to global humanoid and Physical AI leaders. • It provides an additional public market benchmark for valuing high -growth humanoid robotics firms, which can influence sentiment and pricing across the ecosystem KOID targets. • Unitree’s heavy domestic sourcing and vertical integration spotlight the importance of core component suppliers, motors, reducers, sensors, and controllers, that already represent a meaningful weight in the KOID portfolio (~ 51%2).51%37%12%KOID Bucket Breakdown2 "Body" "Brain" "Integrator"
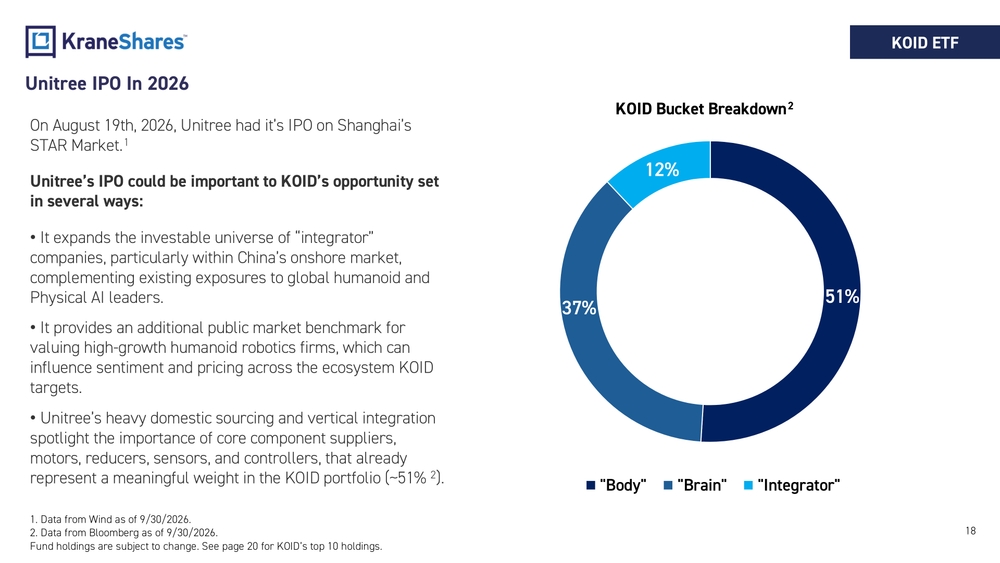
19 Where are KOID Index companies based and what sector do they belong to? KOID ETF Data from KraneShares and Bloomberg as of 9/30/2026. United States 39% China 23%Japan 12%Germany 4%Other 22%Country Breakdown 43% 38%13%5%Sector Breakdown Industrials Information Technology Consumer Discretionary Materials
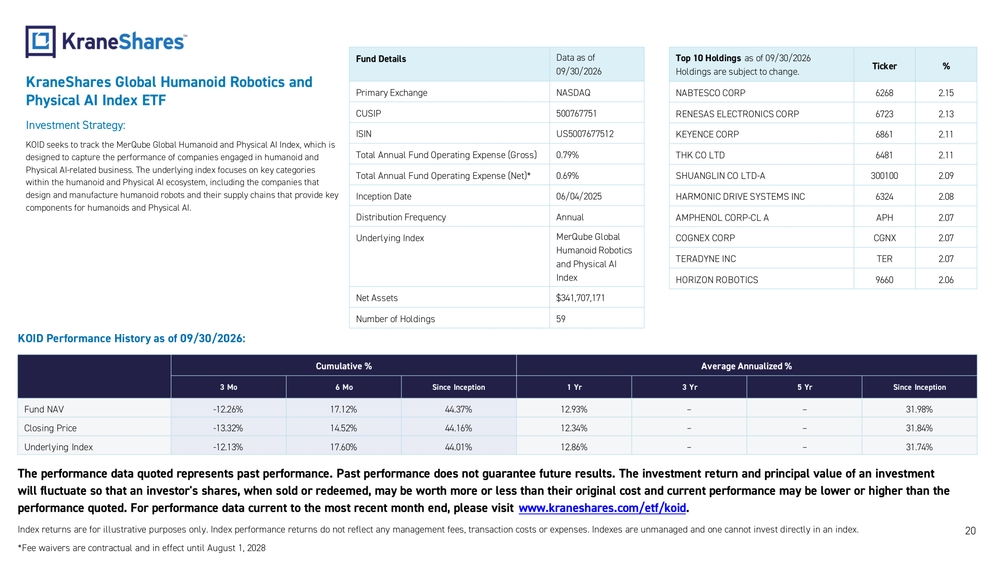
20 Fund Details Data asof 09/30/2026 Primary Exchange NASDAQ CUSIP 500767751 ISIN US5007677512 Total Annual Fund Operating Expense (Gross) 0.79% Total Annual Fund Operating Expense (Net)* 0.69% Inception Date 06/04/2025 Distribution Frequency Annual Underlying Index MerQube Global Humanoid Robotics andPhysical AI Index Net Assets $341,707,171 Number ofHoldings 59Top10Holdings asof09/30/2026 Holdings aresubject tochange.Ticker % NABTESCO CORP 6268 2.15 RENESAS ELECTRONICS CORP 6723 2.13 KEYENCE CORP 6861 2.11 THK COLTD 6481 2.11 SHUANGLIN CO LTD-A 300100 2.09 HARMONIC DRIVE SYSTEMS INC 6324 2.08 AMPHENOL CORP -CL A APH 2.07 COGNEX CORP CGNX 2.07 TERADYNE INC TER 2.07 HORIZON ROBOTICS 9660 2.06 KOID Performance History asof09/30/2026: Cumulative % Average Annualized % 3Mo 6Mo Since Inception 1Yr 3Yr 5Yr Since Inception Fund NAV -12.26% 17.12% 44.37% 12.93% – – 31.98% Closing Price -13.32% 14.52% 44.16% 12.34% – – 31.84% Underlying Index -12.13% 17.60% 44.01% 12.86% – – 31.74% Theperformance data quoted represents past performance. Past performance does notguarantee future results. Theinvestment return andprincipal value ofaninvestment willfluctuate sothat aninvestor 'sshares, when sold orredeemed, may beworth more orless than their original cost andcurrent performance may belower orhigher than the performance quoted. Forperformance data current tothemost recent month end, please visit www.kraneshares.com/etf/koid . Index returns areforillustrative purposes only. Index performance returns donotreflect anymanagement fees, transaction costs orexpenses. Indexes areunmanaged andonecannot invest directly inanindex. *Fee waivers arecontractual andineffect until August 1,2028KraneShares Global Humanoid Robotics and Physical AI Index ETF Investment Strategy: KOID seeks to track the MerQube Global Humanoid and Physical AI Index, which is designed to capture the performance of companies engaged in humanoid and Physical AI -related business. The underlying index focuses on key categories within the humanoid and Physical AI ecosystem, including the companies that design and manufacture humanoid robots and their supply chains that provide key components for humanoids and Physical AI.
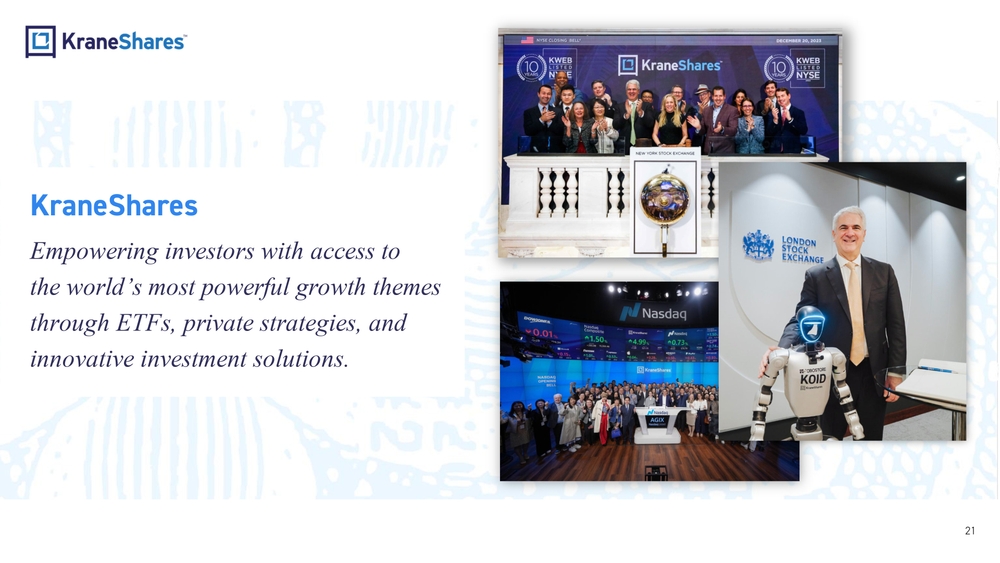
21 KraneShares Empowering investors with access to the world’ s most powerful growth themes through ETFs, private strategies, and innovative investment solutions.
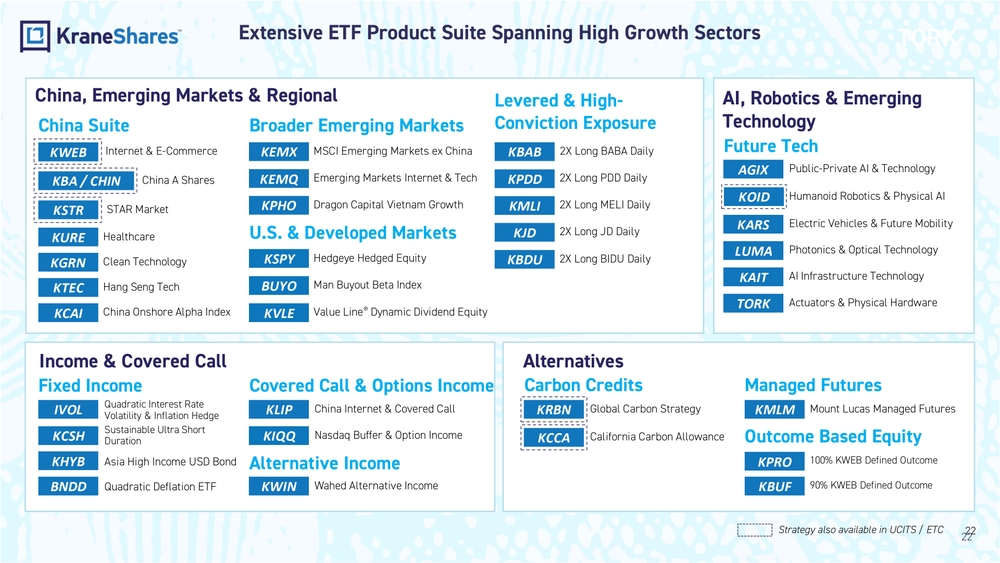
22 TORK China, Emerging Markets & Regional Alternatives Income & Covered Call AI, Robotics & Emerging Technology KURE Healthcare KGRN Clean Technology KTEC Hang Seng Tech KCAI China Onshore Alpha IndexAGIX Public -Private AI & TechnologyChina Suite Future TechBroader Emerging Markets KEMQ Emerging Markets Internet & Tech KPHO Dragon Capital Vietnam GrowthKEMX MSCI Emerging Markets ex China U.S. & Developed Markets KVLE Value Line® Dynamic Dividend EquityHedgeye Hedged Equity KSPY Man Buyout Beta Index BUYO Fixed Income BNDD Quadratic Deflation ETFIVOLQuadratic Interest Rate Volatility & Inflation Hedge KHYB Asia High Income USD BondSustainable Ultra Short Duration KCSHCarbon CreditsKPDD 2X Long PDD Daily KJD 2X Long JD DailyKBAB 2X Long BABA Daily KMLI 2X Long MELI Daily Covered Call & Options Income Managed Futures KMLM Mount Lucas Managed Futures KWIN Wahed Alternative IncomeKLIP China Internet & Covered Call Outcome Based Equity KIQQ Nasdaq Buffer & Option IncomeLevered & High - Conviction Exposure KBUF 90% KWEB Defined Outcome100% KWEB Defined Outcome KPRO Alternative Income Extensive ETF Product Suite Spanning High Growth Sectors KWEB Internet & E -Commerce KOID Humanoid Robotics & Physical AI Strategy also available in UCITS / ETCKBDU 2X Long BIDU DailyChina A Shares KBA / CHIN KSTR STAR Market Global Carbon Strategy KRBN KCCA California Carbon AllowanceElectric Vehicles & Future Mobility KARS LUMA Photonics & Optical Technology KAIT AI Infrastructure Technology TORK Actuators & Physical Hardware 22
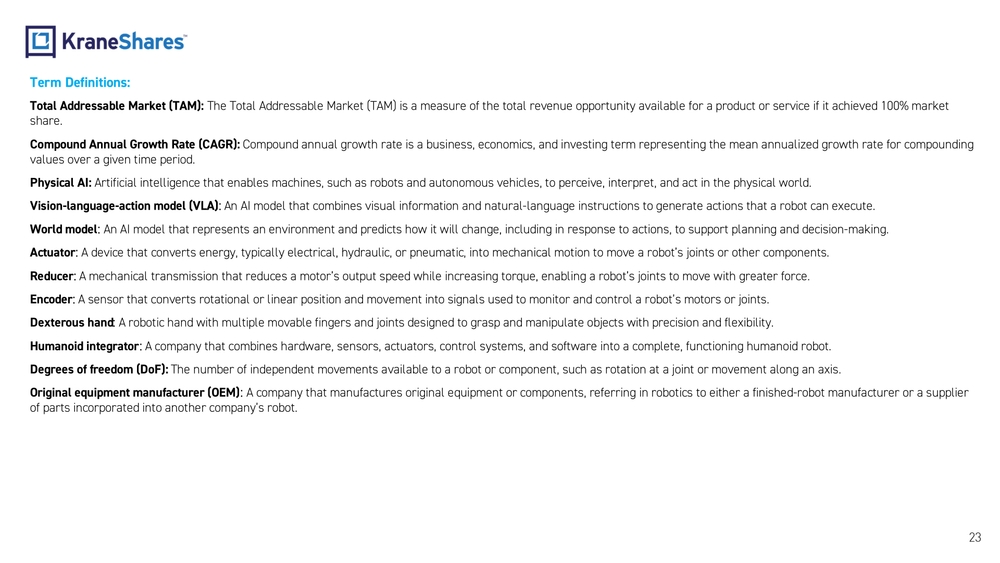
23Term Definitions: Total Addressable Market (TAM) : The Total Addressable Market (TAM) is a measure of the total revenue opportunity available for a product or service if it ach ieved 100% market share. Compound Annual Growth Rate (CAGR): Compound annual growth rate is a business, economics, and investing term representing the mean annualized growth rate for com pounding values over a given time period . Physical AI: Artificial intelligence that enables machines, such as robots and autonomous vehicles, to perceive, interpret, and act in the physical world. Vision -language -action model (VLA) : An AI model that combines visual information and natural -language instructions to generate actions that a robot can execute. World model : An AI model that represents an environment and predicts how it will change, including in response to actions, to support plan ning and decision -making. Actuator : A device that converts energy, typically electrical, hydraulic, or pneumatic, into mechanical motion to move a robot’s joints or other components. Reducer : A mechanical transmission that reduces a motor’s output speed while increasing torque, enabling a robot’s joints to move with greater force. Encoder : A sensor that converts rotational or linear position and movement into signals used to monitor and control a robot’s motors o r joints. Dexterous hand : A robotic hand with multiple movable fingers and joints designed to grasp and manipulate objects with precision and flexibili ty. Humanoid integrator : A company that combines hardware, sensors, actuators, control systems, and software into a complete, functioning humanoid rob ot. Degrees of freedom ( DoF): The number of independent movements available to a robot or component, such as rotation at a joint or movement along an axis. Original equipment manufacturer (OEM) : A company that manufactures original equipment or components, referring in robotics to either a finished -robot manufacturer or a supplier of parts incorporated into another company’s robot .
24 Important Notes: Carefully consider the Funds’ investment objectives, risk factors, charges and expenses before investing. This and additional information can be found in the Funds' full and summary prospectus, which may be obtained by visiting https://www.kraneshares.com/etf/koid/ . Read the prospectus carefully before investing. Risk Disclosures: Investing involves risk, including possible loss of principal. There can be no assurance that a Fund will achieve its stated objectives. Indices are unmanaged and do not include the effect of fees. One cannot invest directly in an index. This information should not be relied upon as research, investment advice, or a recommendation regarding any products, strate gies, or any security in particular . This material is strictly for illustrative, educational, or informational purposes and is subject to change. Certain content represents an assessment of the market envir onment at a specific time and is not intended to be a forecast of future events or a guarantee of future results; material is as of the dates noted and is subject to change without notice. Humanoid and embedded intelligence technology companies often face high research and capital costs, resulting in variable pro fitability in a competitive market where products can quickly become obsolete. Their reliance on intellectual property makes them vulnerable to losses, while legal and regulatory changes can impact profit ability. Defining these companies can be complex, and some may risk commercial failure. They are also affected by global scientific developments, leading to rapid obsolescence, and may be subject to gover nment regulations. Many companies in which the Fund invests may not currently be profitable, with no guarantee of future success. A-Shares are issued by companies in mainland China and traded on local exchanges. They are available to domestic and certain fo reign investors, including QFIs and those participating in Stock Connect Programs like Shanghai -Hong Kong and Shenzhen -Hong Kong. Foreign investments in A -Shares face various regulations and restrictio ns, including limits on asset repatriation. A -Shares may experience frequent trading halts and illiquidity, which can lead to volatility in the Fund’s share price and increased trading halt ris ks. The Chinese economy is an emerging market, vulnerable to domestic and regional economic and political changes, often showing more volatility than developed markets. Companies face risks from potential gov ernment interventions, and the export -driven economy is sensitive to downturns in key trading partners, impacting the Fund. U.S. -China tensions raise concerns over tariffs and trade restrictions, which could harm China’s exports and the Fund. China’s regulatory standards are less stringent than in the U.S., resulting in limited information about issuers. Tax laws are unclear and subject to change, poten tially impacting the Fund and leading to unexpected liabilities for foreign investors. Fluctuations in currency of foreign countries may have an adverse effect to domestic currency values. The Japanese economy depends heavily on international trade and is vulnerable to economic, political, and social instability, which could affect the Fund. The yen is volatile, influenced by fluctuations in Asia, and has historically shown unpredictable movements against the U.S. dollar. Natural disasters, such as earthquakes and tidal waves, also pose risks. Furthermore, government intervention and an unstable financial services sector can negatively impact the economy, which relies significantly on trade with developing nations in E ast and Southeast Asia. The Fund invests in non -U.S. securities, which can be less liquid and subject to weaker regulatory oversight compared to U.S. se curities. Risks include currency fluctuations, political or economic instability, incomplete financial disclosure, and potential taxes or nationalization of holdings. Foreign trading hours and settlement pro cesses may also limit the Fund’s ability to trade, and different accounting standards can add complexity. Suspensions of foreign securities may adversely impact the Fund, and delays in settlement or holidays may hinder asset liquidation, increasing the risk of loss.
25 Risk disclosures continued: The Fund may invest in derivatives, which are often more volatile than other investments and may magnify the Fund’s gains or losses. A derivative (i.e., futures/forward contracts, swaps, and options) is a contract that derives its value from the performance of an underlying asset. The primary risk of derivatives is that changes in the asset’s market value and the derivative may not be proportionate, and some derivatives can have the potential for unlimited losses. Derivatives are also subject to liquidity and counterparty risk. The Fund is subject to liquidity risk, meaning that certain investments may become difficult to purchase or sell at a reasonable time and price. If a transaction for these securities is large, it may not be p ossible to initiate, which may cause the Fund to suffer losses. Counterparty risk is the risk of loss in the event that the counterparty to an agreement fails to make required payments or otherwise comply with the terms of the derivative. Large capitalization companies may struggle to adapt fast, impacting their growth compared to smaller firms, especially in ex pansive times. This could result in lower stock returns than investing in smaller and mid -sized companies. In addition to the normal risks associated with investing, investments in smaller companies typically e xhibit higher volatility. A large number of shares of the Fund is held by a single shareholder or a small group of shareholders. Redemptions from these shareholder can harm Fund performance, especially in declining markets, leading to forced sales at disadvantageous prices, increased costs, and adverse tax effects for remaining shareholders. The Fund is new and does not yet have a significant number of shares outstanding. If the Fund does not grow in size, it will be at greater risk than larger funds of wider bid -ask spreads for its shares, trading at a greater premium or discount to NAV, liquidation and/or a trading halt. Narrowly focused investments typically exhibit hi gher volatility. The Fund’s assets are expected to be concentrated in a sector, industry, market, or group of concentrations to the extent that the Underlying Index has such concentrations. The securities or futures in that concentration could react similarly to market developments. Thus, the Fund is subject to loss due to adverse occurrences that affect that concentration. KOID is non -diversified. Neither MerQube, Inc. nor any of its affiliates (collectively, “MerQube”) is the issuer or producer of KOID and MerQube has n o duties, responsibilities, or obligations to investors in KOID. The index underlying the KOID is a product of MerQube and has been licensed for use by Krane Funds Advisors, LLC and its affiliates. Such index is calculated using, among other things, market data or other information (“Input Data”) from one or more sources (each such source, a “Data Provider”). MerQube® is a registered trademark of MerQube, Inc. Th ese trademarks have been licensed for certain purposes by Krane Funds Advisors, LLC and its affiliates in its capacity as the issuer of the KOID. KOID is not sponsored, endorsed, sold or promoted by MerQube, any Data Provider, or any other third party, and none of such parties make any representation regarding the advisability of investing in securities generally or in KOID particularly, nor do they have any liability for any errors, omissions, or interruptions of the Input Data, MerQube Global Humanoid and Physical AI Index, or any associated data. Neither MerQube nor the Data Providers make any repres entation or warranty, express or implied, to the owners of the shares of KOID or to any member of the public, of any kind, including regarding the ability of the MerQube Global Humanoid and Physical AI Index to track market performance or any asset class. The MerQube Global Humanoid and Physical AI Index is determined, composed and calculated by MerQube without regard to Krane F unds Advisors, LLC and its affiliates or the KOID. MerQube and Data Providers have no obligation to take the needs of Krane Funds Advisors, LLC and its affiliates or the owners of KOID into con sideration in determining, composing or calculating the MerQube Global Humanoid and Physical AI Index. Neither MerQube nor any Data Provider is responsible for and have not participated in the determinatio n of the prices or amount of KOID or the timing of the issuance or sale of KOID or in the determination or calculation of the equation by which KOID is to be converted into cash, surrendered or redeemed, as t he case may be. MerQube and Data Providers have no obligation or liability in connection with the administration, marketing or trading of KOID. There is no assurance that investment products based on the MerQube Global Humanoid and Physical AI Index will accurately track index performance or provide positive investment returns. MerQube is not an investment advisor. Inclusion of a security within an i ndex is not a recommendation by MerQube to buy, sell, or hold such security, nor is it considered to be investment advice.
26 Risk disclosures continued: NEITHER MERQUBE NOR ANY OTHER DATA PROVIDER GUARANTEES THE ADEQUACY, ACCURACY, TIMELINESS AND/OR THE COMPLETENESS OF THE MERQ UBE GLOBAL HUMANOID AND Physical AI INDEX OR ANY DATA RELATED THERETO (INCLUDING DATA INPUTS) OR ANY COMMUNICATION WITH RESPECT THERETO. NEITHER MERQUBE NOR ANY OTHER DATA PROVIDERS SHALL BE SUBJECT TO ANY DAMAGES OR LIABILITY FOR ANY ERRORS, OMISSIONS, OR DELAYS THEREIN. MERQUBE AND ITS DATA PROVIDERS MAKE NO EXPRESS OR IMPLIED WAR RANTIES, AND THEY EXPRESSLY DISCLAIM ALL WARRANTIES, OF MERCHANTABILITY OR FITNESS FOR A PARTICULAR PURPOSE OR USE OR AS TO RESULTS TO BE OBTAINED BY KRANE FUNDS ADVI SORS, LLC AND ITS AFFILIATES, OWNERS OF THE KOID, OR ANY OTHER PERSON OR ENTITY FROM THE USE OF THE MERQUBE GLOBAL HUMANOID AND Physical AI INDEX OR WITH RESPECT TO ANY DATA RELATED THERETO. WITHOUT LIMITING ANY OF THE FOREGOING, IN NO EVENT WHATSOEVER SHALL MERQUBE OR DATA PROVIDERS BE LIABLE FOR ANY INDIRECT, SPECIAL, INCIDENTAL, PUNITI VE, OR CONSEQUENTIAL DAMAGES INCLUDING BUT NOT LIMITED TO, LOSS OF PROFITS, TRADING LOSSES, LOST TIME OR GOODWILL, EVEN IF THEY HAVE BEEN ADVISED OF THE POSSIBILITY OF SUCH DAMAGES, WHETHER IN CONTRACT, TORT, STRICT LIABILITY, OR OTHERWISE. THE FOREGOING REFERENCES TO “MERQUBE” AND/OR “DATA PROVIDER” SHALL BE CONSTRUED TO INCLUDE ANY AND A LL SERVICE PROVIDERS, CONTRACTORS, EMPLOYEES, AGENTS, AND AUTHORIZED REPRESENTATIVES OF THE REFERENCED PARTY. ETF shares are bought and sold on an exchange at market price (not NAV) and are not individually redeemed from the Fund. Howe ver, shares may be redeemed at NAV directly by certain authorized broker - dealers (Authorized Participants) in very large creation/redemption units. The returns shown do not represent the returns you would receive if you traded shares at other times. Shares may trade at a premium or discount to their NAV in the secondary market. Brokerage commissions will reduce returns. Beginning 12/23/2020, ma rket price returns are based on the official closing price of an ETF share or, if the official closing price isn't available, the midpoint between the national best bid and national best offer ("NBBO") as of the time the ETF calculates the current NAV per share. Prior to that date, market price returns were based on the midpoint between the Bid and Ask price. NAVs are calculated using prices as of 4:00 PM Easter n Time. The KraneShares ETFs and KFA Funds ETFs are distributed by SEI Investments Distribution Company (SIDCO), 1 Freedom Valley Dri ve, Oaks, PA 19456, which is not affiliated with Krane Funds Advisors, LLC, the Investment Adviser for the Funds, or any sub -advisers for the Funds.