Carbon Credit ETF Overview | KRBN & KCCA | KraneShares
by Kraneshares
KraneShares Carbon Suite: Investing in the Global Carbon Allowance Markets info@kraneshares.com KRBN KCCA 9/30/2026
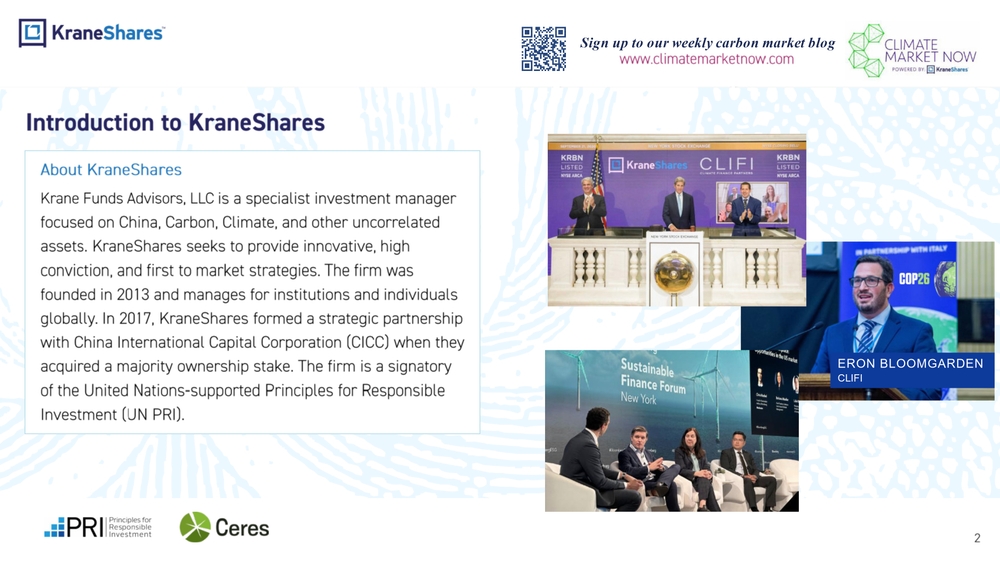
2 Introduction to KraneShares About KraneShares Krane Funds Advisors, LLC is a specialist investment manager focused on China, Carbon, Climate, and other uncorrelated assets. KraneShares seeks to provide innovative, high conviction, and first to market strategies. The firm was founded in 2013 and manages for institutions and individuals globally. In 2017, KraneShares formed a strategic partnership with China International Capital Corporation (CICC) when they acquired a majority ownership stake. The firm is a signatory of the United Nations
supported Principles for Responsible Investment (UN PRI). ERON BLOOMGARDEN CLIFI Sign up to our weekly carbon market blog www.climatemarketnow.com
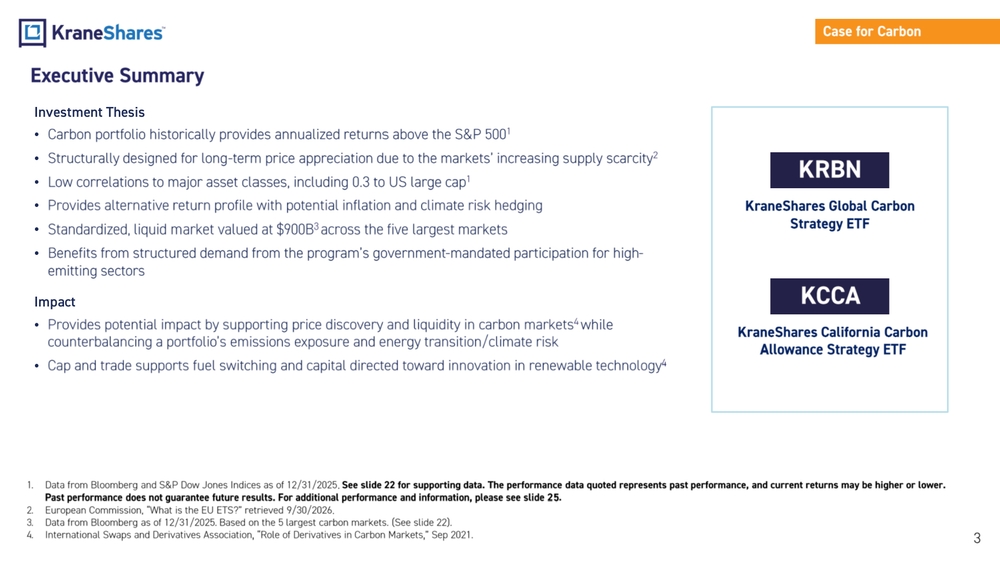
3 KRBN KraneShares Global Carbon Strategy ETF KraneShares California Carbon Allowance Strategy ETF KCCA Investment Thesis • Carbon portfolio historically provides annualized returns above the S&P 500 1 • Structurally designed for long
term price appreciation due to the markets’ increasing supply scarcity 2 • Low correlations to major asset classes, including 0.3 to US large cap 1 • Provides alternative return profile with potential inflation and climate risk hedging • Standardized, liquid market valued at $900B 3 across the five largest markets • Benefits from structured demand from the program’s government
mandated participation for high
emitting sectors Impact • Provides potential impact by supporting price discovery and liquidity in carbon markets 4 while counterbalancing a portfolio’s emissions exposure and energy transition/climate risk • Cap and trade supports fuel switching and capital directed toward innovation in renewable technology 4 Executive Summary 1. Data from Bloomberg and S&P Dow Jones Indices as of 12 /31/2025 . See slide 2 2 for supporting data. The performance data quoted represents past performance, and current returns may be higher or lower. Past performance does not guarantee future results. For additional performance and information, please see slide 2 5 . 2. European Commission, “What is the EU ETS?” retrieved 9/30/2026 . 3. Data from Bloomberg as of 12/31/2025. Based on the 5 largest carbon markets. (See slide 22). 4. International Swaps and Derivatives Association, “Role of Derivatives in Carbon Markets,” Sep 2021. Case for Carbon
Growing Institutional Interest & Research Coverage 4 CFA Institute Research & Policy Center Cambridge Associates Mark Lewis Climate Finance Partners (CLIFI) Over two decades of experience across energy, finance, and climate policy, previously serving as Head of Research and Portfolio Manager at Andurand Capital Management. RECENT BLOG POSTS

Cap
and
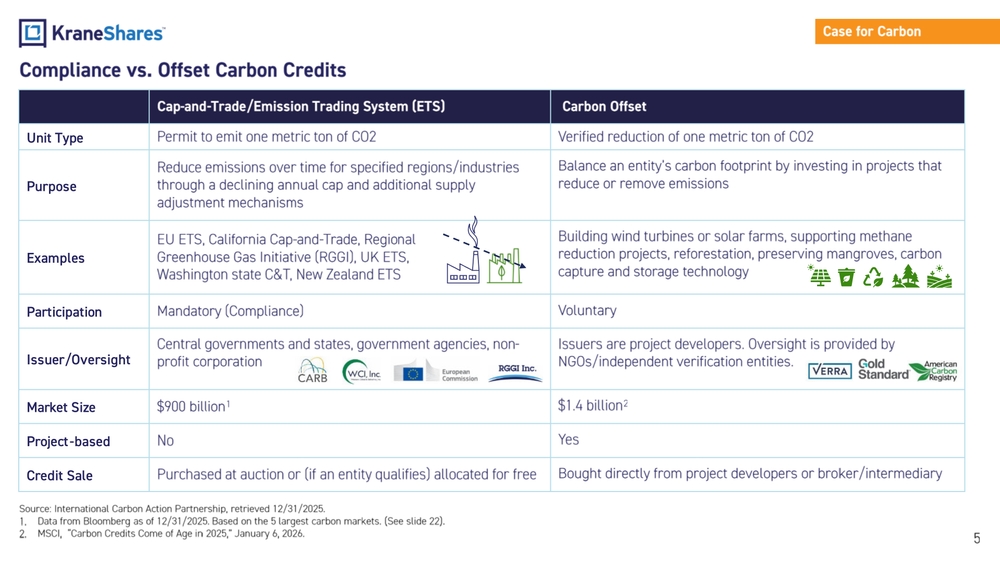
Trade/Emission Trading System (ETS) Carbon Offset Unit Type Permit to emit one metric ton of CO2 Verified reduction of one metric ton of CO2 Purpose Reduce emissions over time for specified regions/industries through a declining annual cap and additional supply adjustment mechanisms Balance an entity’s carbon footprint by investing in projects that reduce or remove emissions Examples EU ETS, California Cap
and
Trade, Regional Greenhouse Gas Initiative (RGGI), UK ETS, Washington state C&T, New Zealand ETS Building wind turbines or solar farms, supporting methane reduction projects, reforestation, preserving mangroves, carbon capture and storage technology Participation Mandatory (Compliance) Voluntary Issuer/Oversight Central governments and states, government agencies, non
profit corporation Issuers are project developers. Oversight is provided by NGOs/independent verification entities. Market Size $900 billion 1 $1.4 billion 2 Project-based No Yes Credit Sale Purchased at auction or (if an entity qualifies) allocated for free Bought directly from project developers or broker/intermediary Compliance vs. Offset Carbon Credits 5 Source: International Carbon Action Partnershi p, retrieved 12/31/2025. 1. Data from Bloomberg as of 12/31/2025. Based on the 5 largest carbon markets. (See slide 22) . 2. MSCI, “Carbon Credits Come of Age in 2025,” January 6, 2026. Case for Carbon
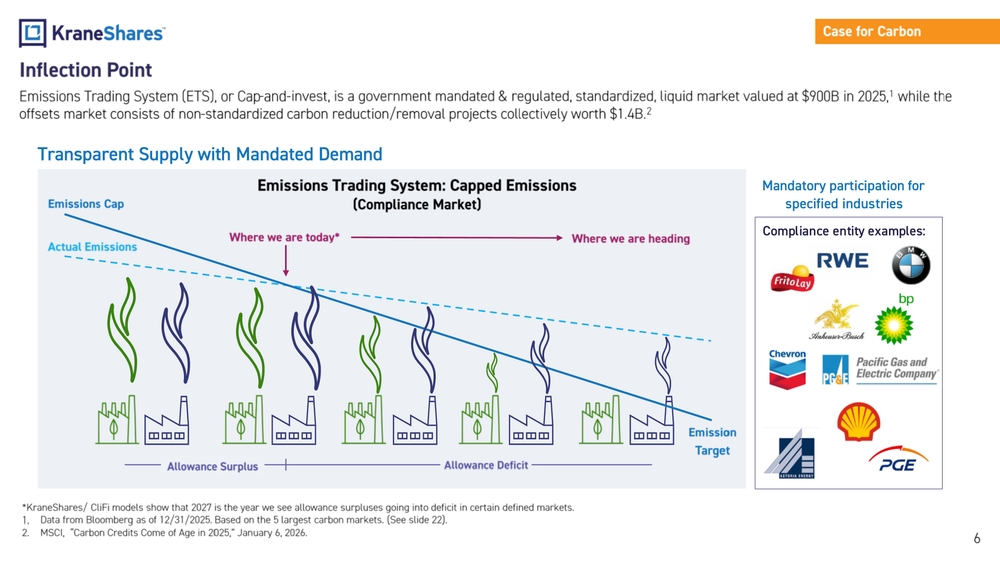
Inflection Point 6 Emissions Trading System (ETS), or Cap
and
invest, is a government mandated & regulated, standardized, liquid market valued at $ 900B in 2025, 1 while the offsets market consists of non
standardized carbon reduction/removal projects collectively worth $1.4B. 2 Emissions Trading System: Capped Emissions (Compliance Market) Emissions Cap Where we are today* Actual Emissions Emission Target Allowance Deficit Allowance Surplus Where we are heading Compliance entity examples: Case for Carbon T ransparent Supply with Mandated Demand Mandatory participation for specified industries *KraneShares/ CliFi models show that 2027 is the year we see allowance surpluses going into deficit in certain defined markets. 1. Data from Bloomberg as of 12/31/2025. Based on the 5 largest carbon markets. (See slide 22). 2. MSCI, “Carbon Credits Come of Age in 2025,” January 6, 2026.
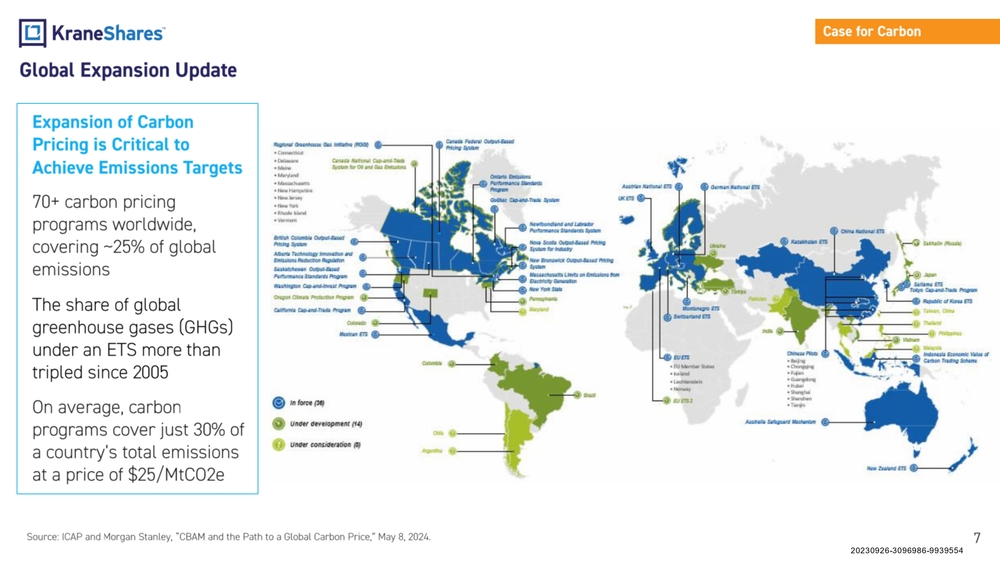
Global Expansion Updat e 7 Expansion of Carbon Pricing is Critical to Achieve Emissions Targets 70+ carbon pricing programs worldwide, covering ~25% of global emissions The share of global greenhouse gases (GHGs) under an ETS more than tripled since 2005 On ave rage, c arbon pro grams cover just 30% of a country’s total emissions at a price of $25/MtCO2e Case for Carbon Source: ICAP and Morgan Stanley, “ CBAM and the Path to a Global Carbon Price,” May 8, 2024. 20230926-3096986-9939554
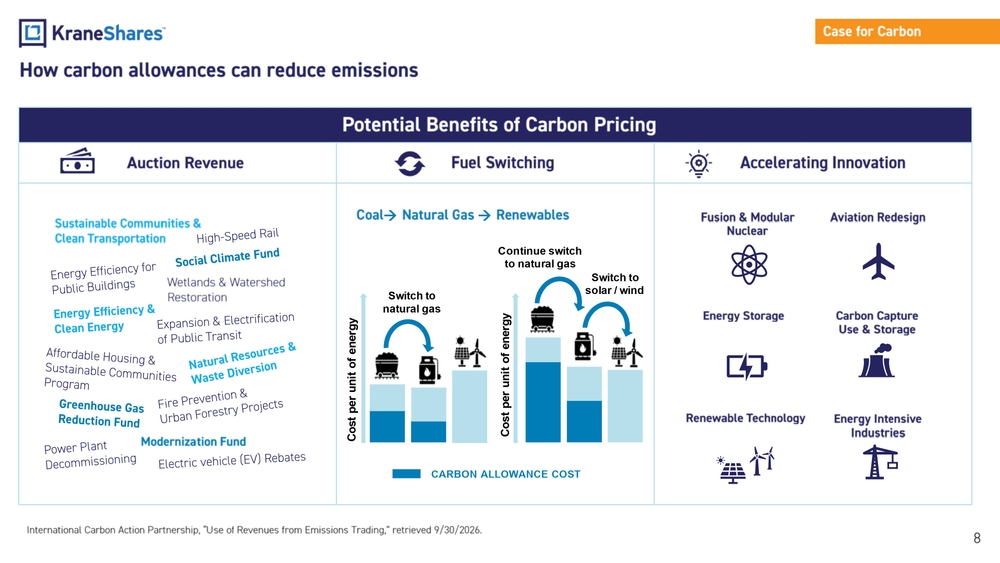
Potential Benefits of Carbon Pricing Auction Revenue Fuel Switching Accelerating Innovation How carbon allowances can reduce emissions 8 CARBON ALLOWANCE COST Cost per unit of energy Cost per unit of energy Switch to natural gas Switch to solar / wind Continue switch to natural gas C oal→ N atural Gas → Re newables Energy Intensive Industries Renewable Technology Energy Storage Carbon Capture Use & Storage Fusion & Modular Nuclear Aviation Redesign Sustainable Communities & Clean Transportation Wetlands & Watershed Restoration Case for Carbon Modernization Fund International Carbon Action Partnership, “ U se of Revenues from Emissions Trading,” retrieved 9/30/2026.
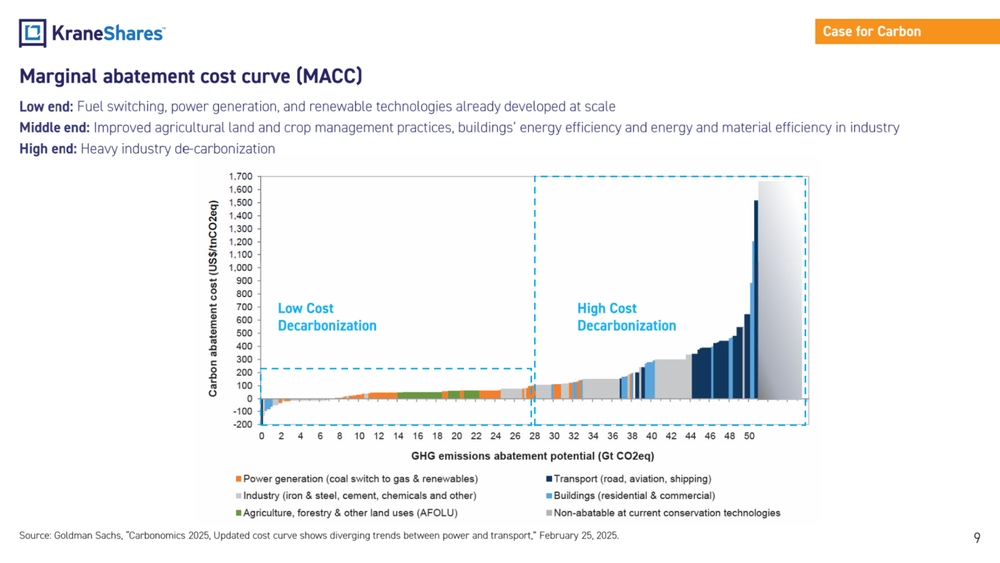
9 Source: Goldman Sachs, “ Carbonomics 2025, Updated cost curve shows diverging trends between power and transport,” February 25, 2025. Marginal abatement cost curve (MACC) Low end: Fuel switching, power generation, and renewable technologies already developed at scale Middle end: Improved agricultural land and crop management practices, buildings’ energy efficiency and energy and material efficiency in industry High end: Heavy industry de
carbonization Case for Carbon High Cost Decarbonization Low Cost Decarbonization
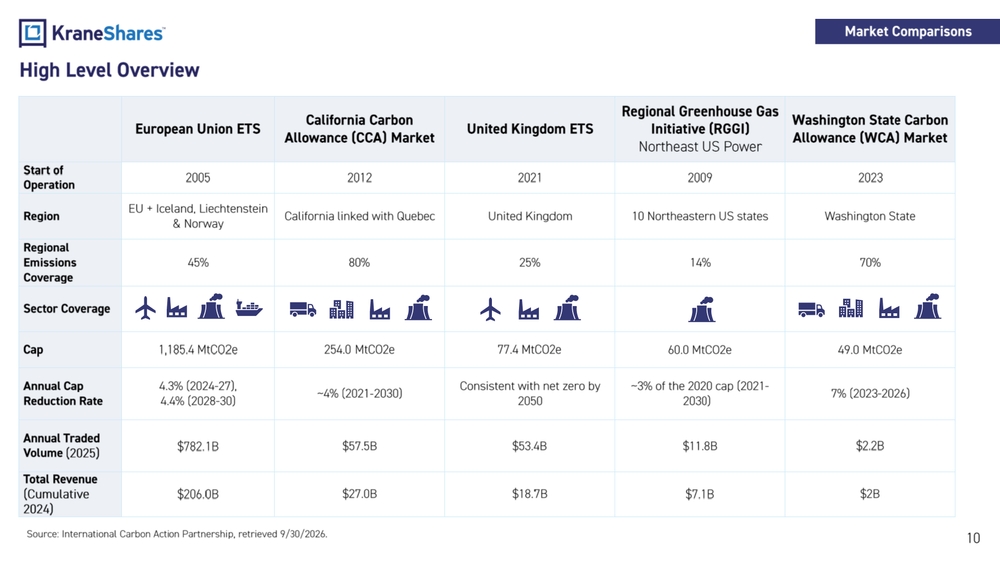
High Level Overview 10 European Union ETS California Carbon Allowance (CCA) Market United Kingdom ETS Regional Greenhouse Gas Initiative (RGGI) Northeast US Power Washington State Carbon Allowance (WCA) Market Start of Operation 2005 2012 2021 2009 2023 Region EU + Iceland, Liechtenstein & Norway California linked with Quebec United Kingdom 10 Northeastern US states Washington State Regional Emissions Coverage 45% 80% 25% 14% 70% Sector Coverage Cap 1,185.4 MtCO2e 254.0 MtCO2e 77.4 MtCO2e 60.0 MtCO2e 49.0 MtCO2e Annual Cap Reduction Rate 4.3% (2024
27), 4.4% (2028
~4% (2021
Consistent with net zero by 2050 ~3% of the 2020 cap (2021
7% (2023
Annual Traded Volume (2025) $782.1B $57.5B $53.4B $11.8B $2.2B Total Revenue (Cumulative 2024) $206.0B $27.0B $18.7B $7.1B $2B Market Comparisons Source: International Carbon Action Partnershi p, retrieved 9/30/2026.
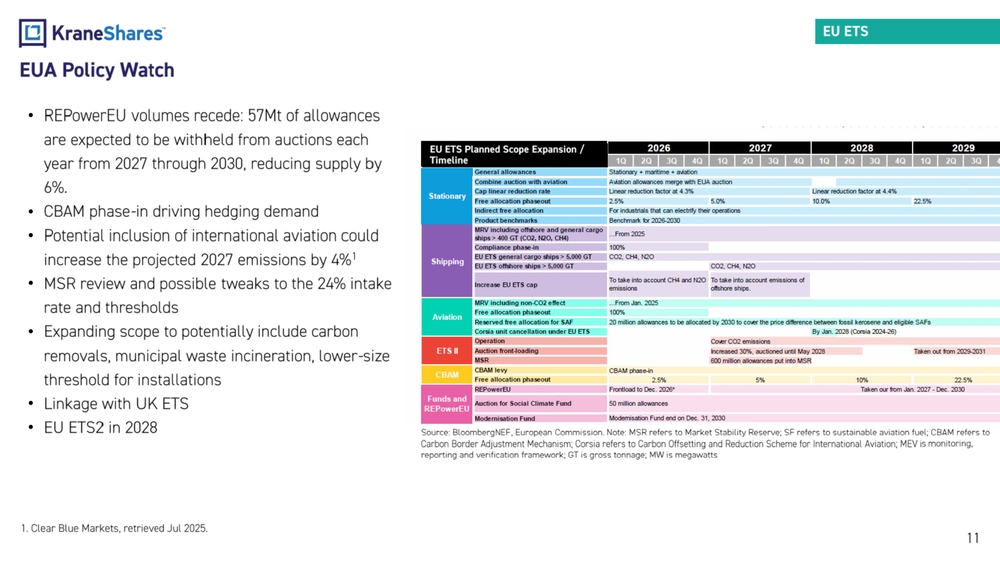
EUA Policy Watch 11 EU ETS Source: BloombergNEF , European Commission. Note: MSR refers to Market Stability Reserve; SF refers to sustainable aviation fuel; CBAM refers to Carbon Border Adjustment Mechanism; Corsia refers to Carbon Offsetting and Reduction Scheme for International Aviation; MEV i s m onitoring, reporting and verification framework; GT is gross tonnage; MW is megawatts • REPowerEU volumes recede: 57Mt of allowances are expected to be withheld from auctions each year from 2027 through 2030, reducing supply by 6%. • CBAM phase
in driving hedging demand • Potential inclusion of international aviation could increase the projected 2027 emissions by 4% 1 • MSR review and possible tweaks to the 24% intake rate and thresholds • Expanding scope to potentially include carbon removals, municipal waste incineration, lower
size threshold for installations • Linkage with UK ETS • EU ETS2 in 2028
- Clear Blue Markets, retrieved Jul 2025. EU ETS Planned Scope Expansion / Timeline
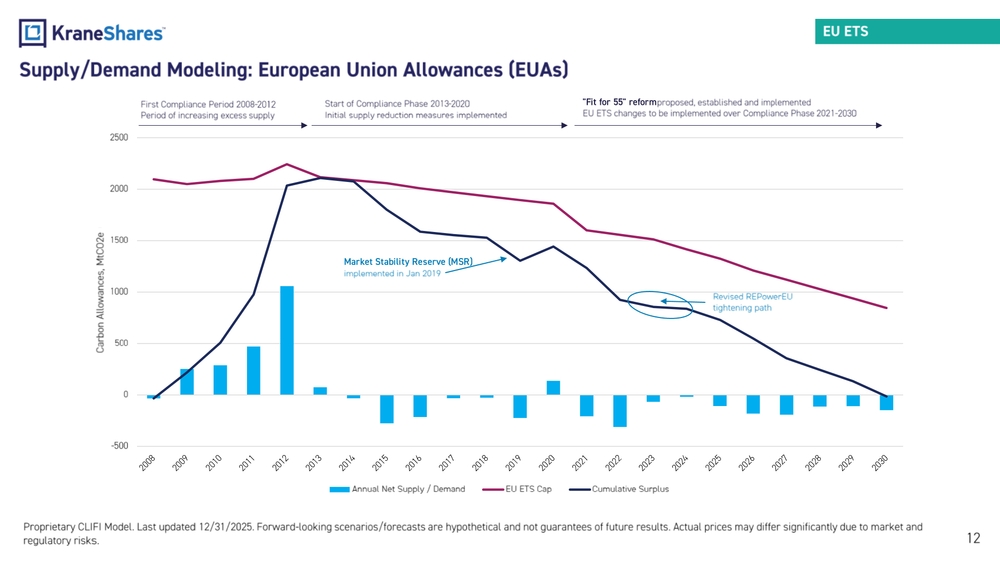
-500 0 500 1000 1500 2000 2500 Carbon Allowances, MtCO2e Annual Net Supply / Demand EU ETS Cap Cumulative Surplus Revised REPowerEU tightening path Proprietary CLIFI Model. Last updated 12/31/2025. Forward
looking scenarios/forecasts are hypothetical and not guarantees of future results. Actual prices may differ significantl y due to market and regulatory risks. Supply/Demand Modeling: European Union Allowances (EUAs) EU ETS 12 First Compliance Period 2008
2012 Period of increasing excess supply Start of Compliance Phase 2013
2020 Initial supply reduction measures implemented "Fit for 55" reform proposed, established and implemented EU ETS changes to be implemented over Compliance Phase 2021
2030 Market Stability Reserve (MSR) implemented in Jan 2019
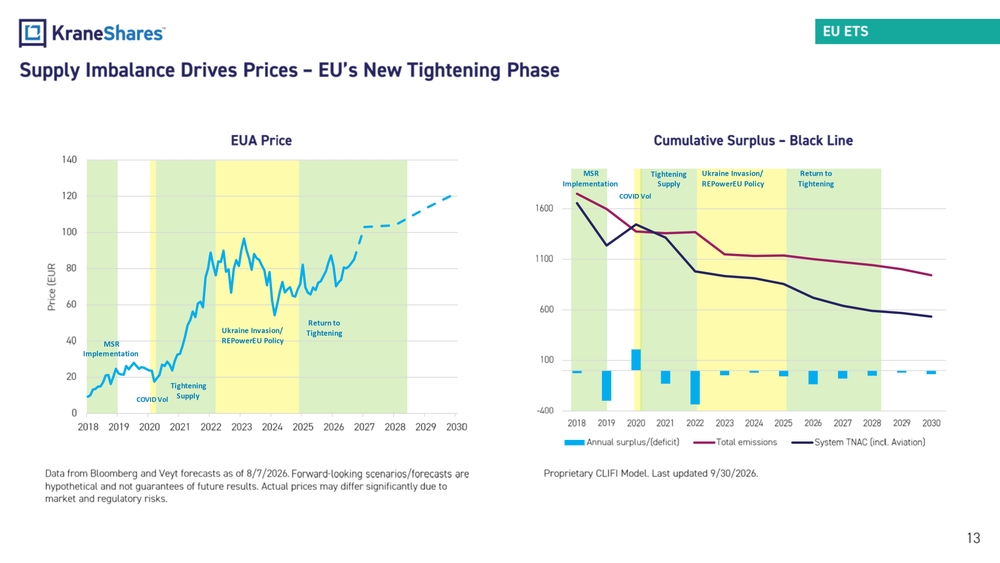
Proprietary CLIFI Model. Last updated 9/30/2026. Cumulative Surplus – Black Line EU ETS 13 EUA Price Data from Bloomberg and Veyt forecasts as of 8/7/2026. Forward
looking scenarios/forecasts are hypothetical and not guarantees of future results. Actual prices may differ significantly due to market and regulatory risks. Return to TighteningUkraine Invasion/ REPowerEU Policy Tightening SupplyCOVID Vol Return to Tightening Ukraine Invasion/ REPowerEU Policy Tightening Supply COVID Vol MSR Implementation MSR Implementation Supply Imbalance Drives Prices – EU’s New Tightening Phase -400 100 600 1100 1600 2018 2019 2020 2021 2022 2023 2024 2025 2026 2027 2028 2029 2030 Annual surplus/(deficit) Total emissions System TNAC (incl. Aviation) 0 20 40 60 80 100 120 140 2018 2019 2020 2021 2022 2023 2024 2025 2026 2027 2028 2029 2030 Price (EUR
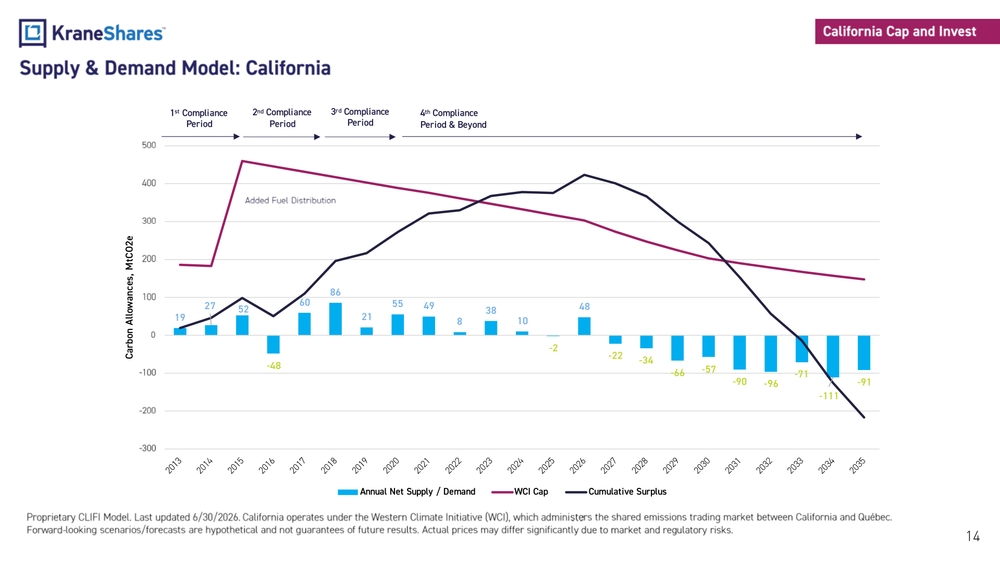
19 27 52 -48 60 86 21 55 49 8 38 10 -2 48 -22 -34 -66 -57 -90 -96 -71 -111 -91 -300 -200 -100 0 100 200 300 400 500 Carbon Allowances, MtCO2e Annual Net Supply / Demand WCI Cap Cumulative Surplus Supply & Demand Model: California 14 California Cap and Invest 1st Compliance Period 2nd Compliance Period 3rd Compliance Period 4th Compliance Period & Beyond Added Fuel Distribution Proprietary CLIFI Model. Last updated 6/30/2026. California operates under the Western Climate Initiative (WCI), which admini ste rs the shared emissions trading market between California and Québec. Forward
looking scenarios/forecasts are hypothetical and not guarantees of future results. Actual prices may differ significantl y due to market and regulatory risks.
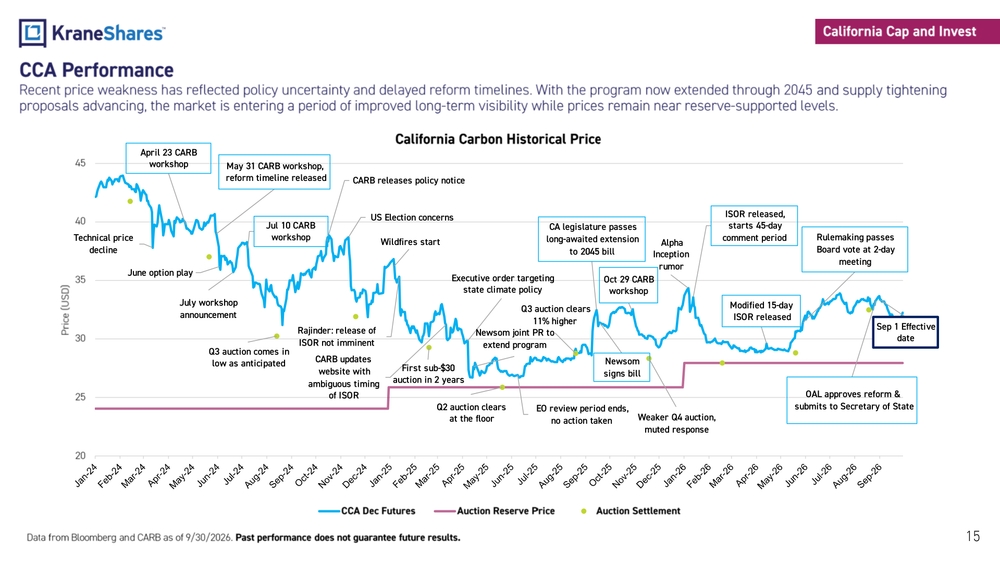
Data from Bloomberg and CARB as of 9 /30/2026 . Past performance does not guarantee future results. CCA Performance Recent price weakness has reflected policy uncertainty and delayed reform timelines. With the program now extended through 20 45 and supply tightening proposals advancing, the market is entering a period of improved long
term visibility while prices remain near reserve
supported levels. 15 California Cap and Invest Technical price decline April 23 CARB workshop May 31 CARB workshop, reform timeline released June option play July workshop announcement Jul 10 CARB workshop CARB releases policy notice US Election concerns Wildfires start Rajinder: release of ISOR not imminent CARB updates website with ambiguous timing of ISOR Executive order targeting state climate policy Newsom joint PR to extend program EO review period ends, no action taken CA legislature passes long-awaited extension to 2045 bill Newsom signs bill Oct 29 CARB workshop Alpha Inception rumor ISOR released, starts 45-day comment period Modified 15-day ISOR released Rulemaking passes Board vote at 2-day meeting OAL approves reform & submits to Secretary of State Sep 1 Effective date Q3 auction comes in low as anticipated First sub-$30 auction in 2 years Q2 auction clears at the floor Q3 auction clears 11% higher Weaker Q4 auction, muted response 20 25 30 35 40 45 Price (USD) California Carbon Historical Price CCA Dec Futures Auction Reserve Price Auction Settlement
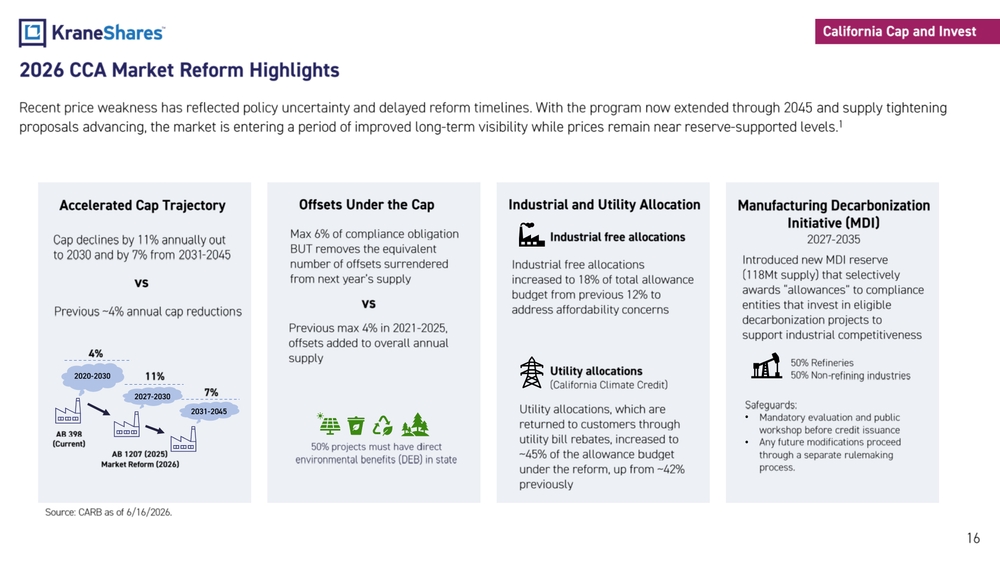
2026 CCA Market Reform Highlights 16 Accelerated Cap Trajectory Cap declines by 11% annually out to 2030 and by 7% from 2031
2045 Offsets Under the Cap Industrial and Utility Allocation Manufacturing Decarbonization Initiative (MDI) 2027
2035 Max 6% of compliance obligation BUT removes the equivalent number of offsets surrendered from next year’s supply Introduced new MDI reserve (118Mt supply) that selectively awards “allowances” to compliance entities that invest in eligible decarbonization projects to support industrial competitiveness Industrial free allocations increased to 18% of total allowance budget from previous 12% to address affordability concerns Previous ~4% annual cap reductions vs Previous max 4% in 2021
2025, offsets added to overall annual supply vs 4% 11%2020-2030 2027-2030 7% 2031-2045 AB 398 (Current) AB 1207 (2025) Market Reform (2026) Recent price weakness has reflected policy uncertainty and delayed reform timelines. With the program now extended through 20 45 and supply tightening proposals advancing, the market is entering a period of improved long
term visibility while prices remain near reserve
supported levels. 1 50% projects must have direct environmental benefits (DEB) in state Safeguards: • Mandatory evaluation and public workshop before credit issuance • Any future modifications proceed through a separate rulemaking process. Utility allocations, which are returned to customers through utility bill rebates, increased to ~45% of the allowance budget under the reform, up from ~42% previously 50% Refineries 50% Non
refining industries Industrial free allocations Utility allocations (California Climate Credit) Source: CARB as of 6/16/2026. California Cap and Invest
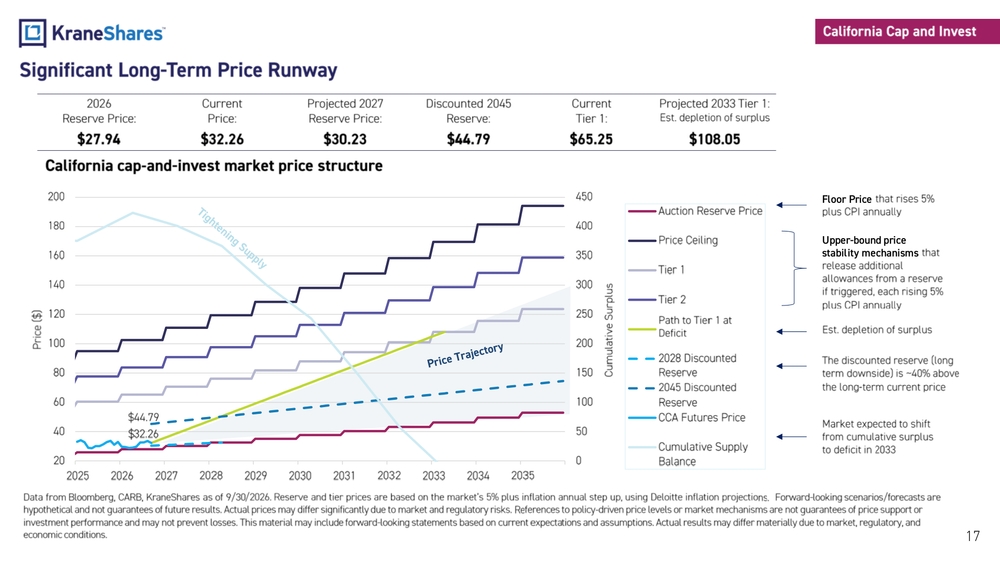
Significant Long
Term Price Runway $ 32.26 $44.79 0 50 100 150 200 250 300 350 400 450 20 40 60 80 100 120 140 160 180 200 2025 2026 2027 2028 2029 2030 2031 2032 2033 2034 2035 Cumulative Surplus Price ($) Auction Reserve Price Price Ceiling Tier 1 Tier 2 2033 Deficit 2028 Discounted Reserve 2045 Discounted Reserve CCA Futures Price Cumulative Supply Balance California cap
and
invest market price structure Data from Bloomberg, CARB, KraneShares as of 9/30 /2026. Reserve and tier prices are based on the market’s 5% plus inflation annual step up, using Deloitte inflation projectio ns.
Forward
looking scenarios/forecasts are hypothetical and not guarantees of future results. Actual prices may differ significantly due to market and regulatory risks. Re ferences to policy
driven price levels or market mechanisms are not guarantees of price support or investment performance and may not prevent losses. This material may include forward
looking statements based on current expecta tions and assumptions. Actual results may differ materially due to market, regulatory, and economic conditions. 2026 Reserve Price : Current Price: Projected 2027 Reserve Price: Discounted 2045 Reserve: Current Tier 1: Projected 2033 Tier 1: Est. depletion of surplus $27.94 $32.26 $30.23 $44.79 $65.25 $108.05 Floor Price that rises 5% plus CPI annually Upper-bound price stability mechanisms that release additional allowances from a reserve if triggered, each rising 5% plus CPI annually Est. depletion of surplus Market expected to shift from cumulative surplus to deficit in 2033 The discounted reserve (long term downside) is ~40% above the long
term current price California Cap and Invest 17 Path to Tier 1 at Deficit
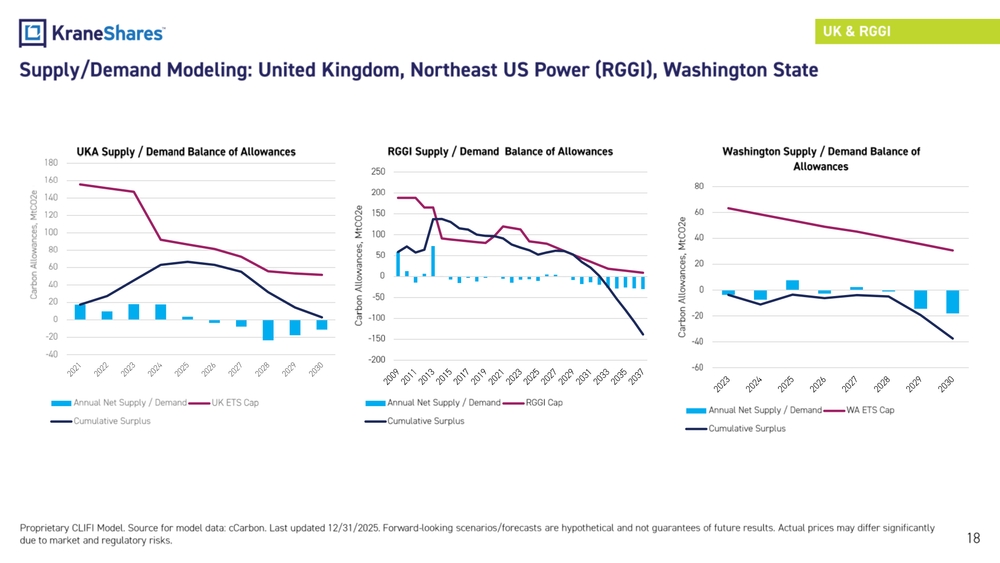
Supply/Demand Modeling: United Kingdom, Northeast US Power (RGGI), Washington State Proprietary CLIFI Model. Source for model data: cCarbon. Last updated 12 / 31 /2025. Forward
looking scenarios/forecasts are hypothetical and not guarantees of future results. Actual prices may differ significantl y due to market and regulatory risks. UK & RGGI 18 -40 -20 0 20 40 60 80 100 120 140 160 180 Carbon Allowances, MtCO2e UKA Supply / Demand Balance of Allowances Annual Net Supply / Demand UK ETS Cap Cumulative Surplus -200 -150 -100 -50 0 50 100 150 200 250 Carbon Allowances, MtCO2e RGGI Supply / Demand Balance of Allowances Annual Net Supply / Demand RGGI Cap Cumulative Surplus -60 -40 -20 0 20 40 60 80 Carbon Allowances, MtCO2e Washington Supply / Demand Balance of Allowances Annual Net Supply / Demand WA ETS Cap Cumulative Surplus
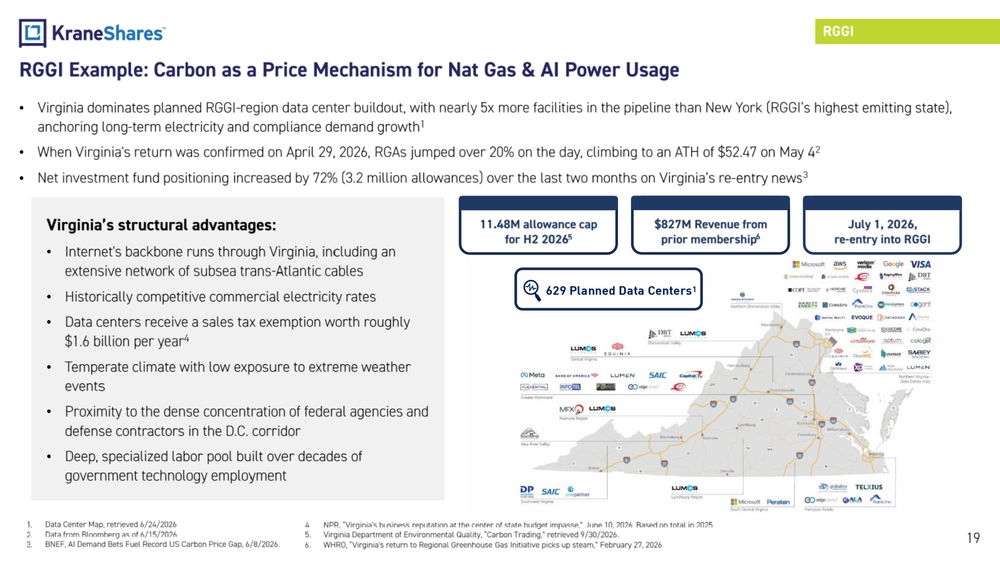
Virginia’s structural advantages: • Internet's backbone runs through Virginia, including an extensive network of subsea trans
Atlantic cables • Historically competitive commercial electricity rates • Data centers receive a sales tax exemption worth roughly $1.6 billion per year 4 • Temperate climate with low exposure to extreme weather events • Proximity to the dense concentration of federal agencies and defense contractors in the D.C. corridor • Deep, specialized labor pool built over decades of government technology employment RGGI Example: Carbon as a Price Mechanism for Nat Gas & AI Power Usage 19 • Virginia dominates planned RGGI
region data center buildout, with nearly 5x more facilities in the pipeline than New York (RGGI’ s highest emitting state), anchoring long
term electricity and compliance demand growth 1 • When Virginia's return was confirmed on April 29, 2026, RGAs jumped over 20% on the day, climbing to an ATH of $52.47 on May 4 2 • Net investment fund positioning increased by 72% (3.2 million allowances) over the last two months on Virginia’s re
entry news 3 July 1, 2026, re
entry into RGGI 11.48M allowance cap for H2 2026 5 $827M Revenue from prior membership 6 629 Planned Data Centers1
RGGI 1. Data Center Map, retrieved 6/24/2026 2. Data from Bloomberg as of 6/15/2026. 3. BNEF, AI Demand Bets Fuel Record US Carbon Price Gap, 6/8/2026. 4. NPR, “Virginia's business reputation at the center of state budget impasse,” June 10, 2026. Based on total in 2025. 5. Virginia Department of Environmental Quality, “Carbon Trading,” retrieved 9/30/2026. 6. WHRO, “Virginia's return to Regional Greenhouse Gas Initiative picks up steam,” February 27, 2026
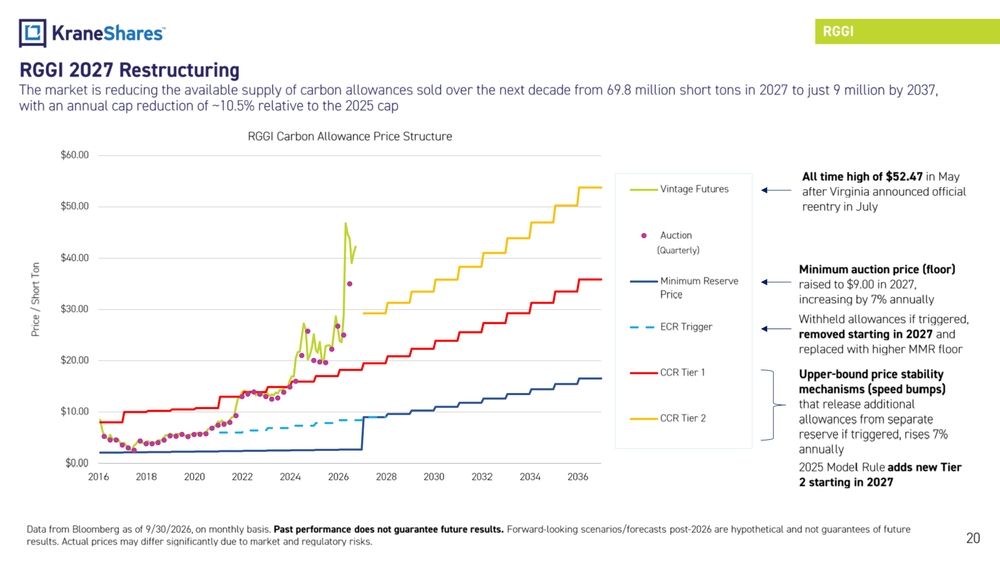
$0.00 $10.00 $20.00 $30.00 $40.00 $50.00 $60.00 2016 2018 2020 2022 2024 2026 2028 2030 2032 2034 2036 Price / Short Ton RGGI Carbon Allowance Price Structure Vintage Futures Auction Minimum Reserve Price ECR Trigger CCR Tier 1 CCR Tier 2 RGGI 2027 Restructuring The market is reducing the available supply of carbon allowances sold over the next decade from 69.8 million short tons in 20 27 to just 9 million by 2037, with an annual cap reduction of ~10.5% relative to the 2025 cap 20 Withheld allowances if triggered, removed starting in 2027 and replaced with higher MMR floor Minimum auction price (floor) raised to $9.00 in 2027, increasing by 7% annually Upper
bound price stability mechanisms (speed bumps) that release additional allowances from separate reserve if triggered, rises 7% annually 2025 Model Rule adds new Tier 2 starting in 2027 All time high of $52.47 in May after Virginia announced official reentry in July Data from Bloomberg as of 9/30/2026, on monthly basis. Past performance does not guarantee future results. Forward
looking scenarios/forecasts post
2026 are hypothetical and not guarantees of future results. Actual prices may differ significantly due to market and regulatory risks. (Quarterly) RGGI
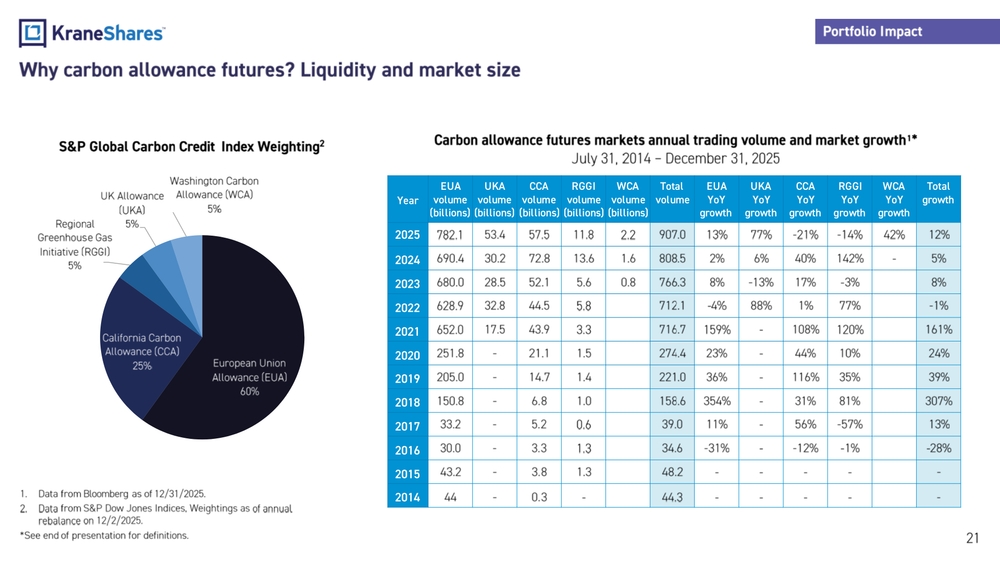
Why carbon allowance futures? Liquidity and market size 21 Carbon allowance futures markets annual trading volume and market growth 1 * July 31, 2014 – December 31, 2025 1. Data from Bloomberg as of 12/31/2025. 2. Data from S&P Dow Jones Indices . Weightings as of annual rebalance on 12/2/2025. *See end of presentation for definitions. Portfolio Impact Year EUA volume (billions) UKA volume (billions) CCA volume (billions) RGGI volume (billions) WCA volume (billions) Total volume EUA YoY growth UKA YoY growth CCA YoY growth RGGI YoY growth WCA YoY growth Total growth 2025 782.1 53.4 57.5 11.8 2.2 907.0 13% 77%
21%
14% 42% 12% 2024 690.4 30.2 72.8 13.6 1.6 808.5 2% 6% 40% 142%
5% 2023 680.0 28.5 52.1 5.6 0.8 766.3 8%
13% 17%
3% 8% 2022 628.9 32.8 44.5 5.8 712.1
4% 88% 1% 77%
1% 2021 652.0 17.5 43.9 3.3 716.7 159%
108% 120% 161% 2020 251.8
21.1 1.5 274.4 23%
44% 10% 24% 2019 205.0
14.7 1.4 221.0 36%
116% 35% 39% 2018 150.8
6.8 1.0 158.6 354%
31% 81% 307% 2017 33.2
5.2 0.6 39.0 11%
56%
57% 13% 2016 30.0
3.3 1.3 34.6
31%
12%
1%
28% 2015 43.2
3.8 1.3 48.2
2014 44
0.3
44.3
European Union Allowance (EUA) 60% California Carbon Allowance (CCA) 25% Regional Greenhouse Gas Initiative (RGGI) 5% UK Allowance (UKA) 5% Washington Carbon Allowance (WCA) 5% S&P Global Carbon Credit Index Weighting 2
- Data from Bloomberg and S&P Indices as of 8/31/2014
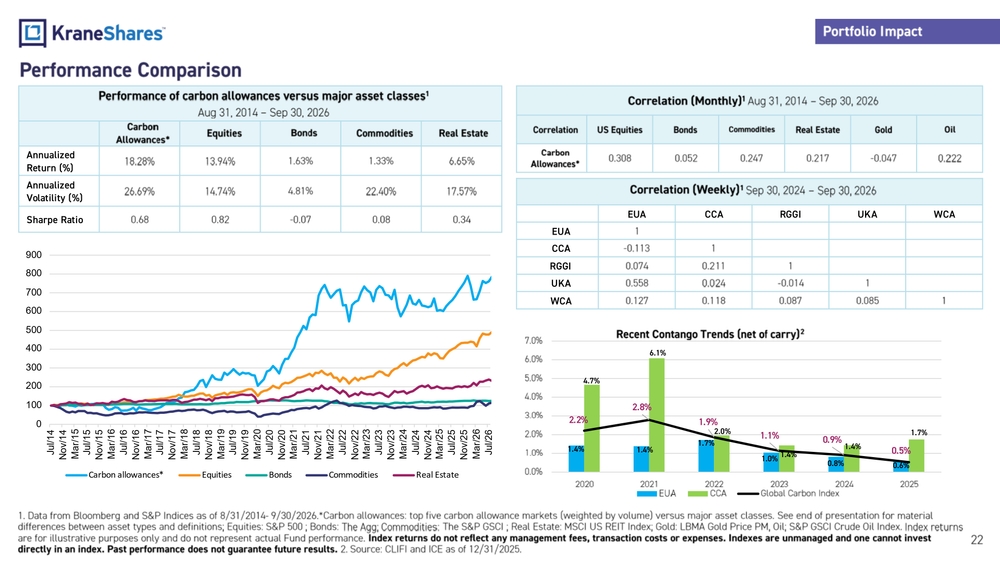
9/30/2026 .* Carbon allowances: top five carbon allowance markets (weighted by volume) versus major asset classes. See end of presentation fo r material differences between asset types and definitions; Equities: S&P 500 ; Bonds: The Agg ; Commodities: The S&P GSCI ; Real Estate: MSCI US REIT Index; Gold: LBMA Gold Price PM, Oil; S&P GSCI Crude Oil Index. Index returns are for illustrative purposes only and do not represent actual Fund performance. Index returns do not reflect any management fees, transaction costs or expenses. Indexes are unmanaged and one cannot invest directly in an index. Past performance does not guarantee future results. 2. Source: CLIFI and ICE as of 12/31/2025. Portfolio Impact 22 Performance Comparison 1.4% 1.4% 1.7% 1.0% 0.8% 0.6% 4.7% 6.1% 2.0% 1.4% 1.4% 1.7% 2.2% 2.8% 1.9% 1.1% 0.9% 0.5% 0.0% 1.0% 2.0% 3.0% 4.0% 5.0% 6.0% 7.0% 2020 2021 2022 2023 2024 2025 Recent Contango Trends (net of carry) 2
EUA CCA Global Carbon Index Performance of carbon allowances versus major asset classes 1 Aug 31, 2014 – Sep 30, 2026 Carbon Allowances* Equities Bonds Commodities Real Estate Annualized Return (%) 18.28% 13.94% 1.63% 1.33% 6.65% Annualized Volatility (%) 26.69% 14.74% 4.81% 22.40% 17.57% Sharpe Ratio 0.68 0.82
0.07 0.08 0.34 Correlation (Monthly) 1 Aug 31, 2014 – Sep 30, 2026 Correlation US Equities Bonds Commodities Real Estate Gold Oil Carbon Allowances* 0.308 0.052 0.247 0.217
0.047 0.222 Correlation (Weekly) 1 Sep 30, 2024 – Sep 30, 2026 EUA CCA RGGI UKA WCA EUA 1 CCA
0.113 1 RGGI 0.074 0.211 1 UKA 0.558 0.024
0.014 1 WCA 0.127 0.118 0.087 0.085 1 0 100 200 300 400 500 600 700 800 900 Jul/14 Nov/14 Mar/15 Jul/15 Nov/15 Mar/16 Jul/16 Nov/16 Mar/17 Jul/17 Nov/17 Mar/18 Jul/18 Nov/18 Mar/19 Jul/19 Nov/19 Mar/20 Jul/20 Nov/20 Mar/21 Jul/21 Nov/21 Mar/22 Jul/22 Nov/22 Mar/23 Jul/23 Nov/23 Mar/24 Jul/24 Nov/24 Mar/25 Jul/25 Nov/25 Mar/26 Jul/26 Carbon allowances* Equities Bonds Commodities Real Estate
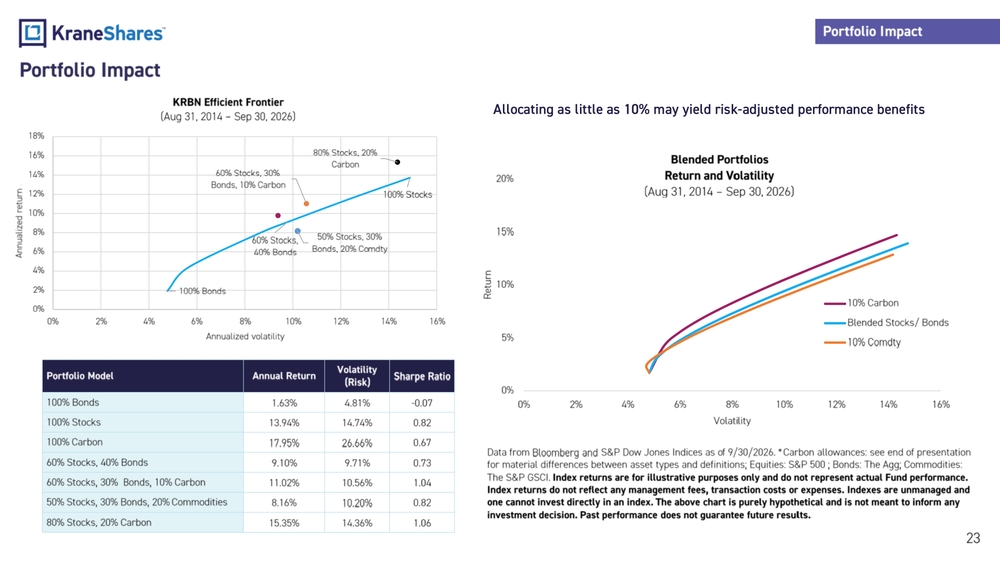
23 Portfolio Model Annual Return Volatility (Risk) Sharpe Ratio 100% Bonds 1.63% 4.81%
0.07 100% Stocks 13.94% 14.74% 0.82 100% Carbon 17.95% 26.66% 0.67 60% Stocks, 40% Bonds 9.10% 9.71% 0.73 60% Stocks, 30% Bonds, 10% Carbon 11.02% 10.56% 1.04 50% Stocks, 30% Bonds, 20% Commodities 8.16% 10.20% 0.82 80% Stocks, 20% Carbon 15.35% 14.36% 1.06 Data from Bloomberg and S&P Dow Jones Indices as of 9/30/2026. * Carbon allowances: see end of presentation for material differences between asset types and definitions; Equities: S&P 500 ; Bonds: The Agg; Commodities: The S&P GSCI. Index returns are for illustrative purposes only and do not represent actual Fund performance. Index returns do not reflect any management fees, transaction costs or expenses. Indexes are unmanaged and one cannot invest directly in an index. The above chart is purely hypothetical and is not meant to inform any investment decision. Past performance does not guarantee future results. Portfolio Impact Allocating as little as 10% may yield risk-adjusted performance benefits Portfolio Impact 100% Stocks 60% Stocks, 40% Bonds 100% Bonds 60% Stocks, 30% Bonds, 10% Carbon 50% Stocks, 30% Bonds, 20% Comdty 80% Stocks, 20% Carbon 0% 2% 4% 6% 8% 10% 12% 14% 16% 18% 0% 2% 4% 6% 8% 10% 12% 14% 16% Annualized return Annualized volatility KRBN Efficient Frontier (Aug 31, 2014 – Sep 30, 2026) 0% 5% 10% 15% 20% 0% 2% 4% 6% 8% 10% 12% 14% 16% Return Volatility Blended Portfolios Return and Volatility (Aug 31, 2014 – Sep 30, 2026) 10% Carbon Blended Stocks/ Bonds 10% Comdty
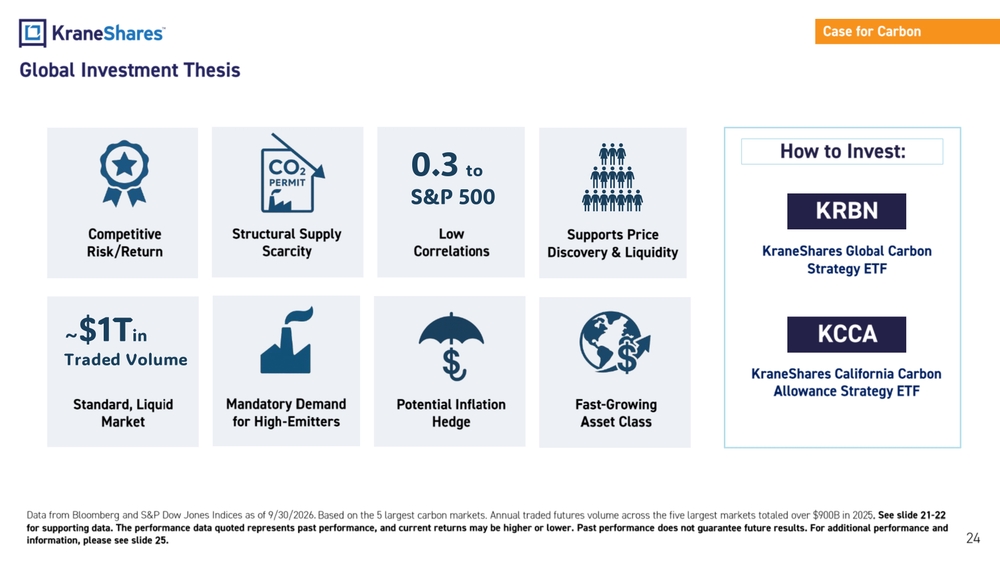
Global Investment Thesis 24 Data from Bloomberg and S&P Dow Jones Indices as of 9/30/2026 . Based on the 5 largest carbon markets. Annual traded futures volume across the five largest markets totaled over $900B in 202 5. See slide 2 1
2 2 for supporting data. The performance data quoted represents past performance, and current returns may be higher or lower. Past performance does no t g uarantee future results. For additional performance and information, please see slide 2 5 . KRBN KraneShares Global Carbon Strategy ETF KraneShares California Carbon Allowance Strategy ETF KCCA How to Invest: Case for Carbon Competitive Risk/Return Structural Supply Scarcity Low Correlations 0.3 to S&P 500 Mandatory Demand for High
Emitters Supports Price Discovery & Liquidity Fast
Growing Asset Class Standard, Liquid Market ~$1Tin Traded Volume Potential Inflation Hedge
KraneShares Global Carbon Strategy ETF (KRBN) Investment Strategy : The KraneShares Global Carbon Strategy ETF (KRBN) is benchmarked to the S&P Global Carbon Credit Index, which offers broad coverage of cap
and
trade carbon allowances by tracking the most traded carbon credit futures contracts . The index introduces a new measure for hedging risk and going long the price of carbon while supporting responsible investing . Currently, the index covers the major European and North American cap
and
trade programs : European Union Allowances (EUA), California Carbon Allowances (CCA), the Regional Greenhouse Gas Initiative (RGGI), United Kingdom Allowances (UKA) , and Washington State Carbon Allowances (WCA) . KRBN Partner : Climate Finance Partners serves as the sub
adviser of the Fund . Climate Finance Partners delivers innovative climate finance solutions and investment products to address capital needs for emerging environmental challenges . CLIFI is led by a team of investment professionals with deep experience in the fields of traditional investment and environmental finance . KRBN Performance History as of 9 / 30 / 202 6 : Fund Details Data as of 9 /30/2026 Primary Exchange NYSE CUSIP 500767678 ISIN US5007676787 Total Annual Fund Operating Expense 0. 90 % Inception Date 07/29/2020 Distribution Frequency Quarterly Index Name S&P Global Carbon Credit Index Cumulative % Average Annualized % 3 Mo YTD Since Inception 1 Yr 3 Yr 5 Yr Since Inception Fund NAV 2.16%
3.84% 147.72% 6.61% 2.18% 3.92% 15.82% Closing Price 1.63%
4.80% 145.03% 6.00% 1.89% 3.59% 15.62% Underlying Index 1.83%
4.38% 161.19% 5.89% 2.94% 5.17% 16.82% The performance data quoted represents past performance. Past performance does not guarantee future results. The investment return and principal value of an investment will fluctuate so that an investor ' s shares, when sold or redeemed, may be worth more or less than their original cost and current performance may be lower or higher than the performance quoted. For performance data current to the most recent month end, please visit www.kraneshares.com/krbn. Closing Price returns use the official ETF closing price or, if unavailable, the NBBO midpoint when NAV is calculated, and ma y d iffer from returns received at other trading times. NAVs use prices as of 4:00 p.m. Eastern Time. See page 46 for additional information. Diversification does not ensure a profit or guarantee against a loss . Index returns are for illustrative purposes only. Index performance returns do not reflect any management fees, transaction costs or expenses. Indexes are unmanaged and one cannot invest directly in an index. KRBN 25
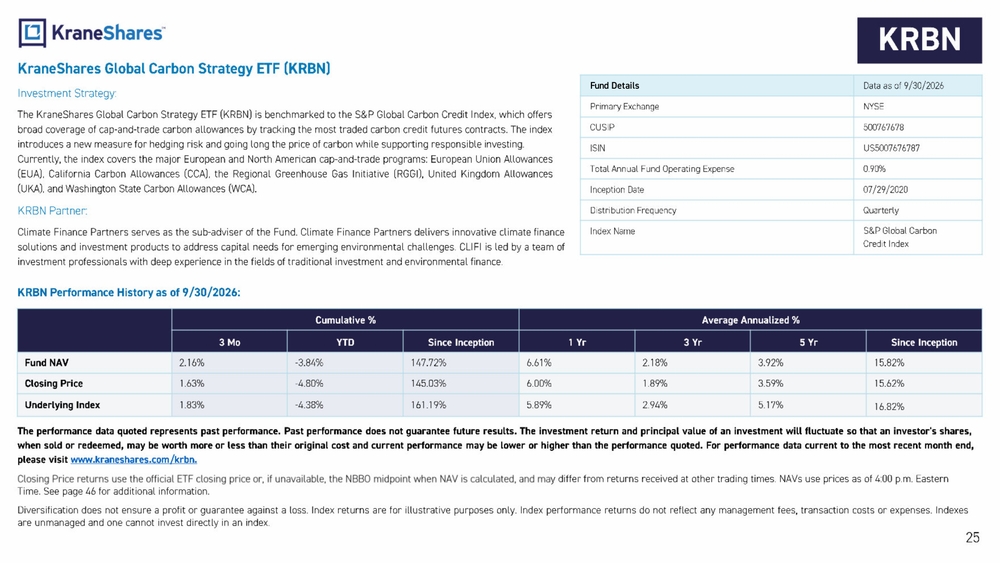
Holdings and Exposures of the KraneShares Global Carbon Strategy ETF (KRBN) Carbon Allowance Futures Breakdown Data as of 9 /30/2026 Currency Exposure Breakdown Data as of 9 /30/2026 26 KRBN Holdings, carbon allowance exposures, and collateral are subject to change. Includes USD cash deposits & cash in margin accounts ($14,411,341), and implied short USD exposure from Euro FX futures Carbon Allowance Exposures as of 09/30/2026 Identifier Position Current Exposure($) % NAV European Union Allowance (EUA) 2026 Note US36255HES31 610 58,932,143 42.77% California Carbon Allowance (CCA) Vintage 2026 Future KBCZ26 Comdty 1,099 35,442,750 25.72% European Union Allowance (EUA) 2026 Future MOZ26 Comdty 272 26,288,596 19.08% UK Allowance (UKA) 2026 Future UKEZ6 Comdty 87 7,097,441 5.15% Regional Greenhouse Gas Initiative (RGGI) Vintage 2026 Future RGYZ26 Comdty 154 6,503,420 4.72% Washington Carbon Allowance (WCA) Vintage 2026 Future WKDZ26 Comdty 101 3,913,750 2.84% 138,178,100 100% Collateral and Currency Management as of 09/30/2026 Identifier Position Current Notional($) % NAV KraneShares Sustainable Ultra Short Duration Index ETF 500767355 2,683,000 67,075,000 48.66% Euro FX Futures ECZ6 Curncy 193 27,422,888 19.90% European Union Allowance (EUA) 2026 Note US36255HES31 30,877,000 27,025,619 19.61% State Street Institutional U.S. Government Money Market Fund GVMXX 12,385,245 12,385,245 8.99% BRITISH STERLING POUND GBP 4,252,606 5,649,352 4.10% EURO EUR 1,385,409 1,573,613 1.14% USD Cash & Equivalents USD
13,011,547
3,297,650
2.39% 137,834,067 100 %
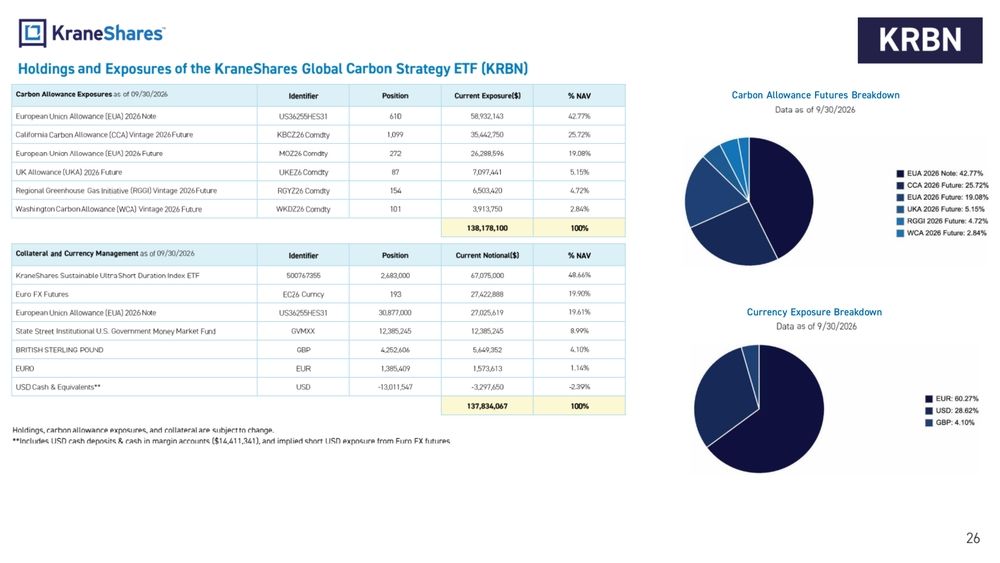
China, Emerging Markets & Regional Alternatives Income & Covered Call AI, Robotics & Emerging Technology KURE Healthcare KGRN Clean Technology KSTR STAR Market KTEC Hang Seng Tech KWEB Internet & E
Commerce China A Shares KBA / CHIN KCAI China Onshore Alpha Index AGIX Artificial Intelligence & Technology KOID Humanoid & Embodied Intelligence Electric Vehicles & Future Mobility KARS China Suite Future Tech Broader Emerging Markets KEMQ Emerging Markets Consumer Tech KPHO Dragon Capital Vietnam Growth KEMX MSCI Emerging Markets ex China U.S. & Developed Markets KVLE Value Line ® Dynamic Dividend Equity Hedgeye Hedged Equity KSPY Man Buyout Beta Index BUYO Fixed Income BNDD Quadratic Deflation ETF IVOL Quadratic Interest Rate Volatility & Inflation Hedge KHYB Asia High Income USD Bond Sustainable Ultra Short Duration KCSH Global Carbon Strategy KRBN Carbon Credits KPDD 2X Long PDD Daily KJD 2X Long JD Daily KBAB 2X Long BABA Daily KMLI 2X Long MELI Daily Covered Call & Options Income Managed Futures KMLM Mount Lucas Managed Futures KWIN Wahed Alternative Income KLIP China Internet & Covered Call Outcome Based Equity KIQQ Nasdaq Buffer & Option Income Levered & High
Conviction Exposure KBUF 90% KWEB Defined Outcome 100% KWEB Defined Outcome KPRO Alternative Income KCCA California Carbon Allowance Extensive ETF Product Suite Spanning High Growth Sectors Strategy also available in UCITS / ETC KBDU 2X Long BIDU Daily California Carbon Allowance GBP Hedged KCCP
Part II: Deep Dive into the Carbon Allowance Markets info@kraneshares.com 28
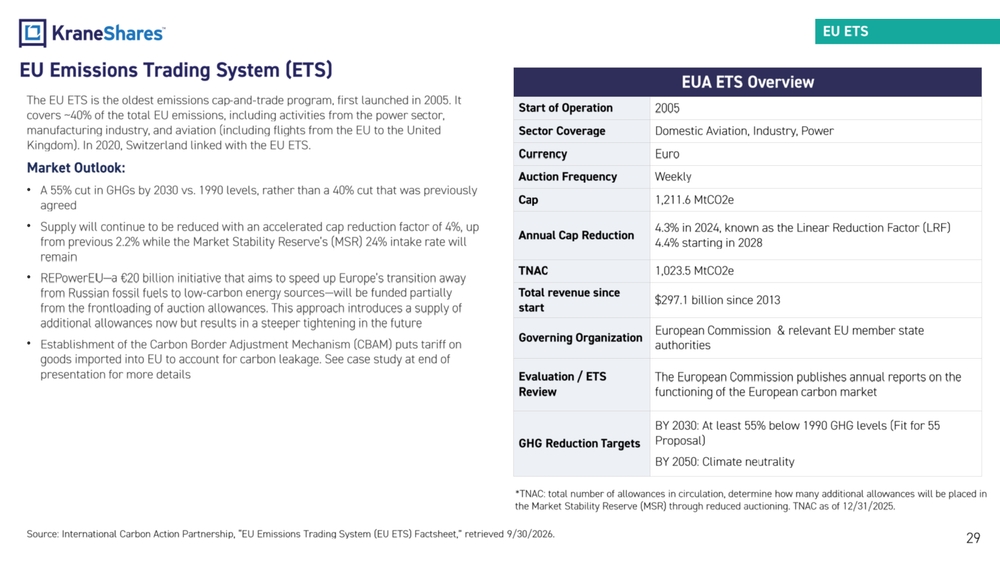
29 EUA ETS Overview Start of Operation 2005 Sector Coverage Domestic Aviation, Industry, Power Currency Euro Auction Frequency Weekly Cap 1,211.6 MtCO2e Annual Cap Reduction 4.3% in 2024, known as the Linear Reduction Factor (LRF) 4.4% starting in 2028 TNAC 1,023.5 MtCO2e Total revenue since start $297.1 billion since 2013 Governing Organization European Commission & relevant EU member state authorities Evaluation / ETS Review The European Commission publishes annual reports on the functioning of the European carbon market GHG Reduction Targets BY 2030: At least 55% below 1990 GHG levels (Fit for 55 Proposal) BY 2050: Climate neutrality EU Emissions Trading System (ETS) Source: International Carbon Action Partnershi p, “EU Emissions Trading System (EU ETS) Factsheet,” retrieved 9/30/2026 . *TNAC: total number of allowances in circulation, determine how many additional allowances will be placed in the Market Stability Reserve (MSR) through reduced auctioning. TNAC as of 12/31/2025. The EU ETS is the oldest emissions cap
and
trade program, first launched in 2005. It covers ~40% of the total EU emissions, including activities from the power sector, manufacturing industry, and aviation (including flights from the EU to the United Kingdom). In 2020, Switzerland linked with the EU ETS. Market Outlook: • A 55% cut in GHGs by 2030 vs. 1990 levels, rather than a 40% cut that was previously agreed • Supply will continue to be reduced with an accelerated cap reduction factor of 4%, up from previous 2.2% while the Market Stability Reserve’s (MSR) 24% intake rate will remain • REPowerEU — a €20 billion initiative that aims to speed up Europe’s transition away from Russian fossil fuels to low
carbon energy sources — will be funded partially from the frontloading of auction allowances. This approach introduces a supply of additional allowances now but results in a steeper tightening in the future • Establishment of the Carbon Border Adjustment Mechanism (CBAM) puts tariff on goods imported into EU to account for carbon leakage. See case study at end of presentation for more details EU ETS
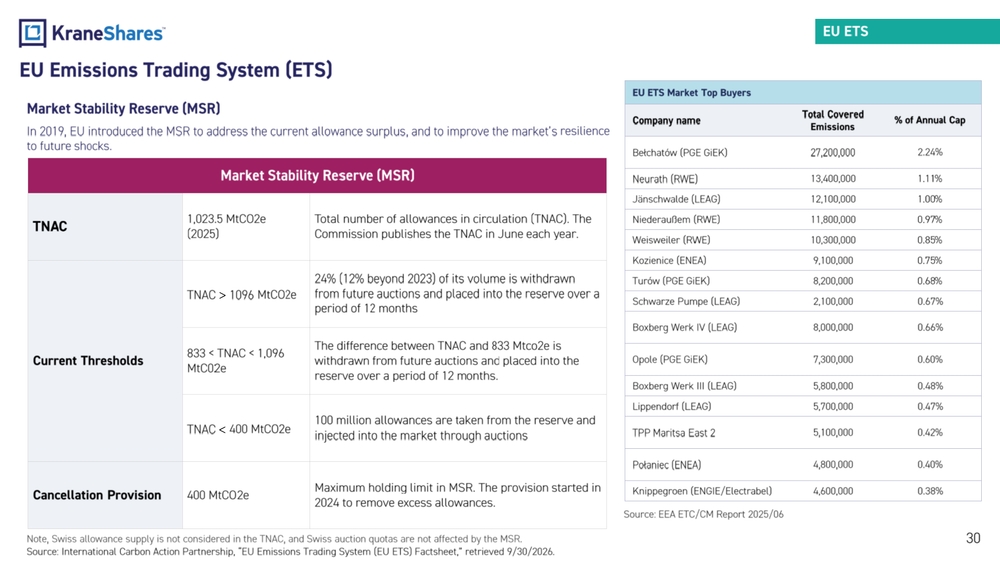
Market Stability Reserve (MSR) TNAC 1,023.5 MtCO2e (2025) Total number of allowances in circulation (TNAC). The Commission publishes the TNAC in June each year. Current Thresholds TNAC > 1096 MtCO2e 24% (12% beyond 2023) of its volume is withdrawn from future auctions and placed into the reserve over a period of 12 months 833 < TNAC < 1,096 MtC02e The difference between TNAC and 833 Mtco2e is withdrawn from future auctions and placed into the reserve over a period of 12 months. TNAC < 400 MtCO2e 100 million allowances are taken from the reserve and injected into the market through auctions Cancellation Provision 400 MtCO2e Maximum holding limit in MSR. The provision started in 2024 to remove excess allowances. Market Stability Reserve (MSR) In 2019, EU introduced the MSR to address the current allowance surplus , and to improve the market’s resilience to future shocks. Note, Swiss allowance supply is not considered in the TNAC, and Swiss auction quotas are not affected by the MSR. Source: International Carbon Action Partnership, “EU Emissions Trading System (EU ETS) Factsheet,” retrieved 9/30/2026. 30 EU ETS Market Top Buyers Company name Total Covered Emissions % of Annual Cap Bełchatów (PGE GiEK) 27,200,000 2.24% Neurath (RWE) 13,400,000 1.11 % Jänschwalde (LEAG) 12,100,000 1.00 % Niederaußem (RWE) 11,800,000 0.97 % Weisweiler (RWE) 10,300,000 0.85 % Kozienice (ENEA) 9,100,000 0.75 % Turów (PGE GiEK) 8,200,000 0.68 % Schwarze Pumpe (LEAG) 2,100,000 0.67% Boxberg Werk IV (LEAG) 8,000,000 0.66% Opole (PGE GiEK) 7,300,000 0.60% Boxberg Werk III (LEAG) 5,800,000 0.48% Lippendorf (LEAG) 5,700,000 0.47% TPP Maritsa East 2 5,100,000 0.42% Połaniec (ENEA) 4,800,000 0.40% Knippegroen (ENGIE/Electrabel) 4,600,000 0.38% Source: EEA ETC/CM Report 2025/06 EU Emissions Trading System (ETS) EU ETS