Learn about actuators with the TORK ETF
by Kraneshares
Investing In The Motion Systems Behind Robotics An overview of the KraneShares Actuator ETF (Ticker: TORK ) TORK 9/24/2026 info@kraneshares.com
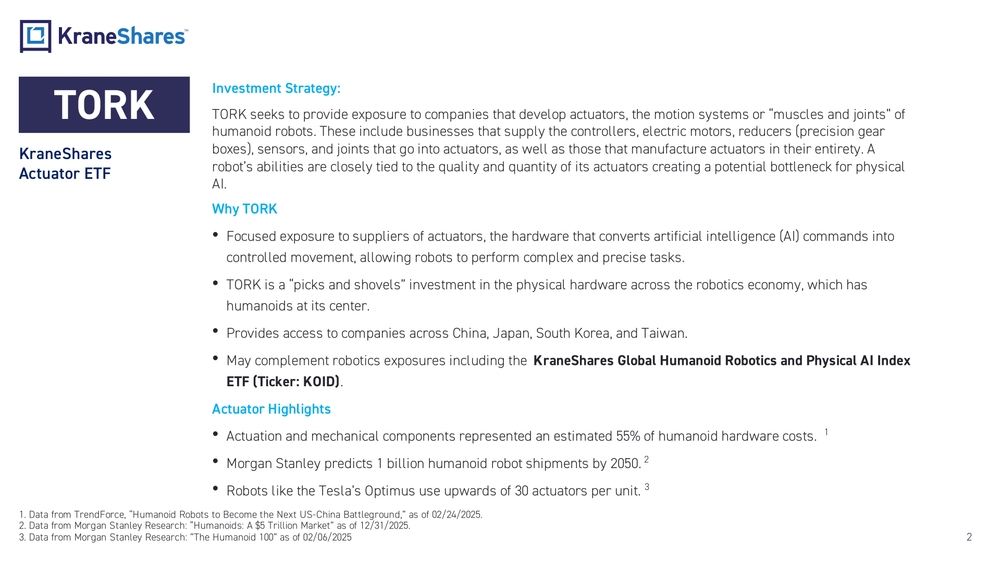
Investment Strategy: TORK seeks to provide exposure to companies that develop actuators, the motion systems or “muscles and joints” of humanoid robots. These include businesses that supply the controllers, electric motors, reducers (precision gear boxes), sensors, and joints that go into actuators, as well as those that manufacture actuators in their entirety. A robot’s abilities are closely tied to the quality and quantity of its actuators creating a potential bottleneck for physical AI. Why TORK •Focused exposure to suppliers of actuators, the hardware that converts artificial intelligence (AI) commands into controlled movement, allowing robots to perform complex and precise tasks. •TORK is a “picks and shovels” investment in the physical hardware across the robotics economy, which has humanoids at its center. •Provides access to companies across China, Japan, South Korea, and Taiwan. •May complement robotics exposures including the KraneShares Global Humanoid Robotics and Physical AI Index ETF (Ticker: KOID) . Actuator Highlights •Actuation and mechanical components represented an estimated 55% of humanoid hardware costs.1 •Morgan Stanley predicts 1 billion humanoid robot shipments by 2050.2 •Robots like the Tesla’s Optimus use upwards of 30 actuators per unit.3
- Data from TrendForce , “Humanoid Robots to Become the Next US -China Battleground,” as of 02/24/2025.
- Data from Morgan Stanley Research: “Humanoids: A $5 Trillion Market” as of 12/31/2025.
- Data from Morgan Stanley Research: ”The Humanoid 100” as of 02/06/2025 2TORK KraneShares Actuator ETF
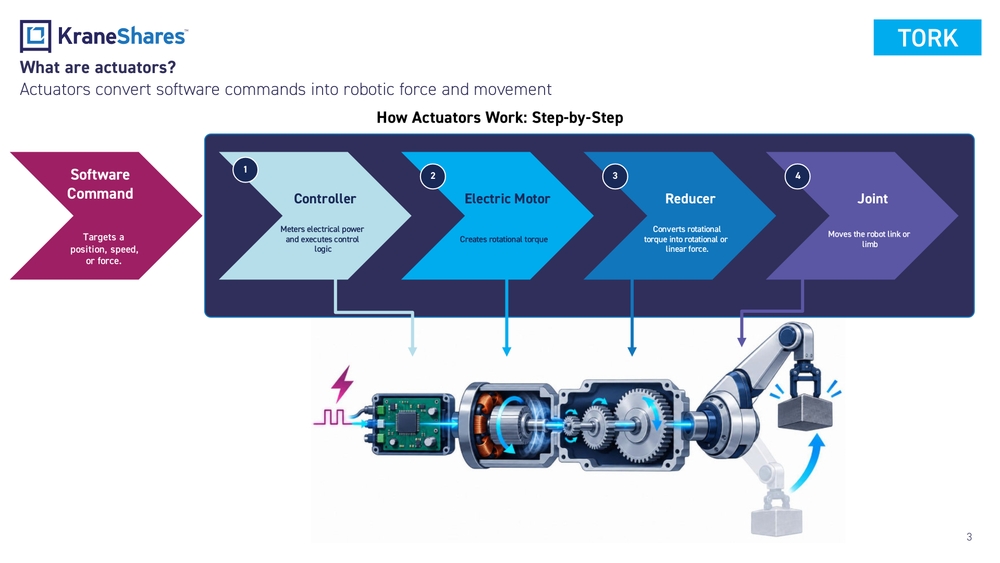
What are actuators? Actuators convert software commands into robotic force and movement Software Command Controller Meters electrical power and executes control logic2 Electric Motor Creates rotational torque3 Reducer Converts rotational torque into rotational or linear force.4 Joint Moves the robot link or limbHow Actuators Work: Step -by-Step 1 Targets a position, speed, or force. 3TORK
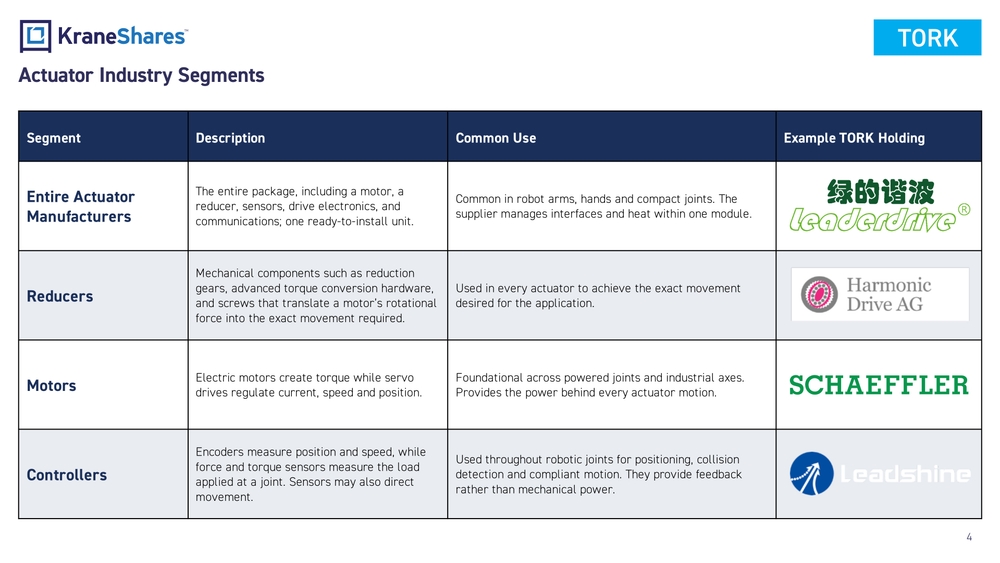
Segment Description Common Use Example TORK Holding Entire Actuator ManufacturersThe entire package, including a motor, a reducer, sensors, drive electronics, and communications; one ready -to-install unit.Common in robot arms, hands and compact joints. The supplier manages interfaces and heat within one module. ReducersMechanical components such as reduction gears, advanced torque conversion hardware, and screws that translate a motor’s rotational force into the exact movement required.Used in every actuator to achieve the exact movement desired for the application. MotorsElectric motors create torque while servo drives regulate current, speed and position.Foundational across powered joints and industrial axes. Provides the power behind every actuator motion. ControllersEncoders measure position and speed, while force and torque sensors measure the load applied at a joint. Sensors may also direct movement.Used throughout robotic joints for positioning, collision detection and compliant motion. They provide feedback rather than mechanical power. Actuator Industry Segments 4TORK
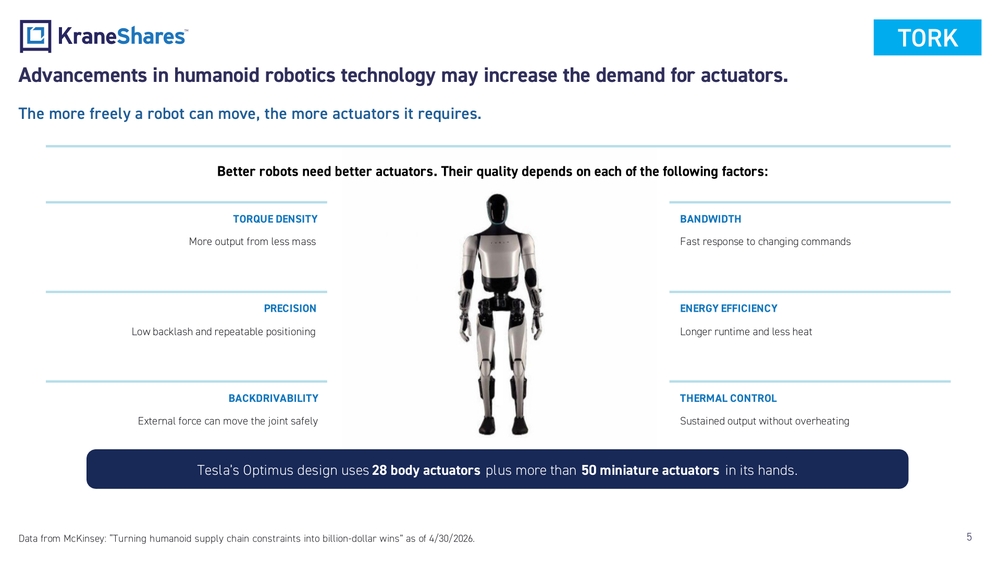
Advancements in humanoid robotics technology may increase the demand for actuators. Data from McKinsey: “Turning humanoid supply chain constraints into billion -dollar wins” as of 4/30/2026.The more freely a robot can move, the more actuators it requires. TORQUE DENSITY More output from less massBANDWIDTH Fast response to changing commands PRECISION Low backlash and repeatable positioningENERGY EFFICIENCY Longer runtime and less heat BACKDRIVABILITY External force can move the joint safelyTHERMAL CONTROL Sustained output without overheating Tesla’s Optimus design uses 28 body actuators plus more than 50 miniature actuators in its hands.Better robots need better actuators. Their quality depends on each of the following factors: 5TORK
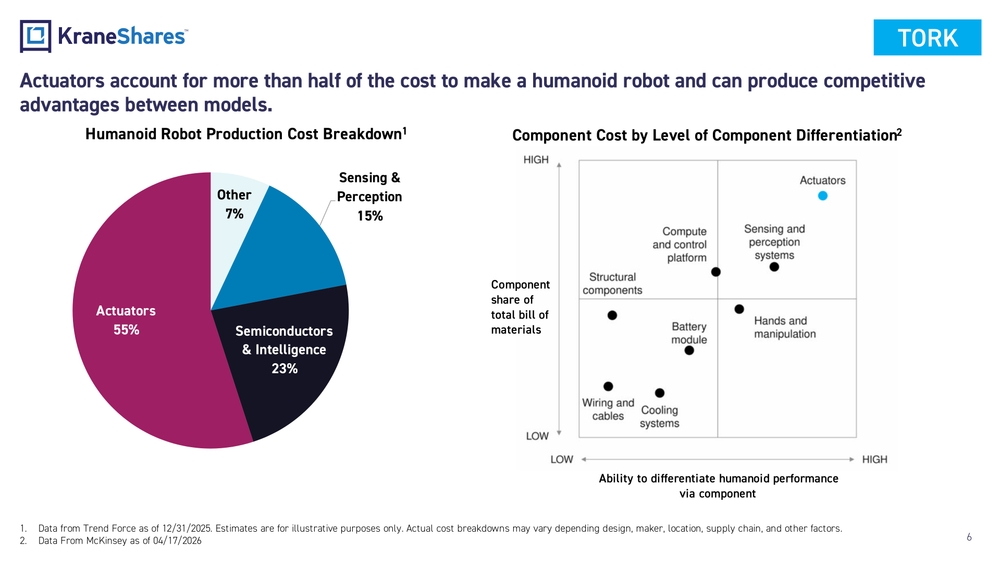
Actuators account for more than half of the cost to make a humanoid robot and can produce competitive advantages between models. Other 7%Sensing & Perception 15% Semiconductors & Intelligence 23%Actuators 55%Humanoid Robot Production Cost Breakdown1 1.Data from Trend Force as of 12/31/2025. Estimates are for illustrative purposes only. Actual cost breakdowns may vary dependi ng design, maker, location, supply chain, and other factors. 2.Data From McKinsey as of 04/17/2026Component Cost by Level of Component Differentiation2 Component share of total bill of materials Ability to differentiate humanoid performance via component 6TORK
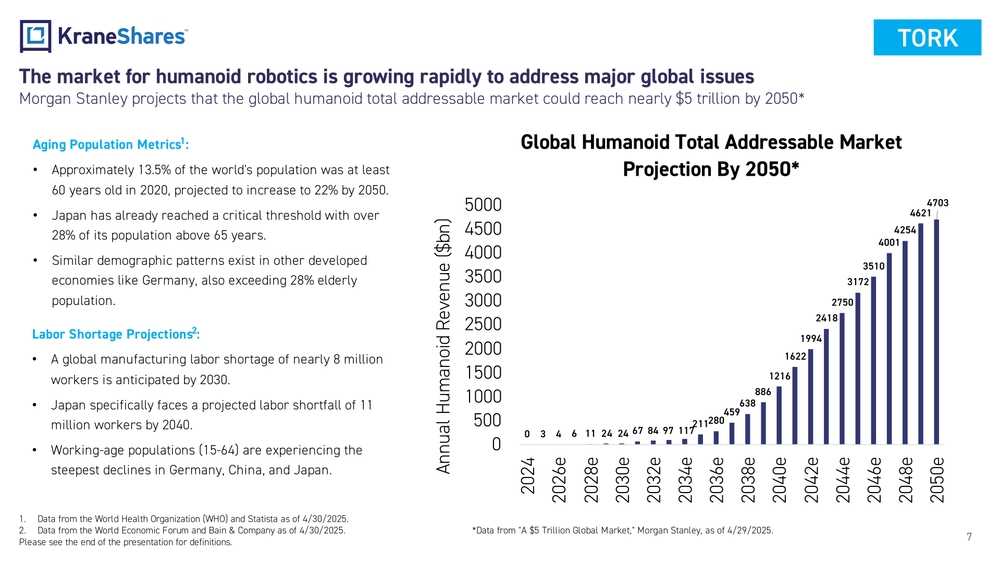
The market for humanoid robotics is growing rapidly to address major global issues Morgan Stanley projects that the global humanoid total addressable market could reach nearly $5 trillion by 2050* Aging Population Metrics1: •Approximately 13.5% of the world's population was at least 60 years old in 2020, projected to increase to 22% by 2050. •Japan has already reached a critical threshold with over 28% of its population above 65 years. •Similar demographic patterns exist in other developed economies like Germany, also exceeding 28% elderly population. Labor Shortage Projections2: •A global manufacturing labor shortage of nearly 8 million workers is anticipated by 2030. •Japan specifically faces a projected labor shortfall of 11 million workers by 2040. •Working -age populations (15 -64) are experiencing the steepest declines in Germany, China, and Japan. Data from "A $5 Trillion Global Market," Morgan Stanley, as of 4/29/2025.1. Data from the World Health Organization (WHO) and Statista as of 4/30/2025. 2. Data from the World Economic Forum and Bain & Company as of 4/30/2025. Please see the end of the presentation for definitions.034611242467849711721128045963888612161622199424182750317235104001425446214703 0500100015002000250030003500400045005000 2024 2026e 2028e 2030e 2032e 2034e 2036e 2038e 2040e 2042e 2044e 2046e 2048e 2050eAnnual Humanoid Revenue ($bn)Global Humanoid Total Addressable Market Projection By 2050 7TORK
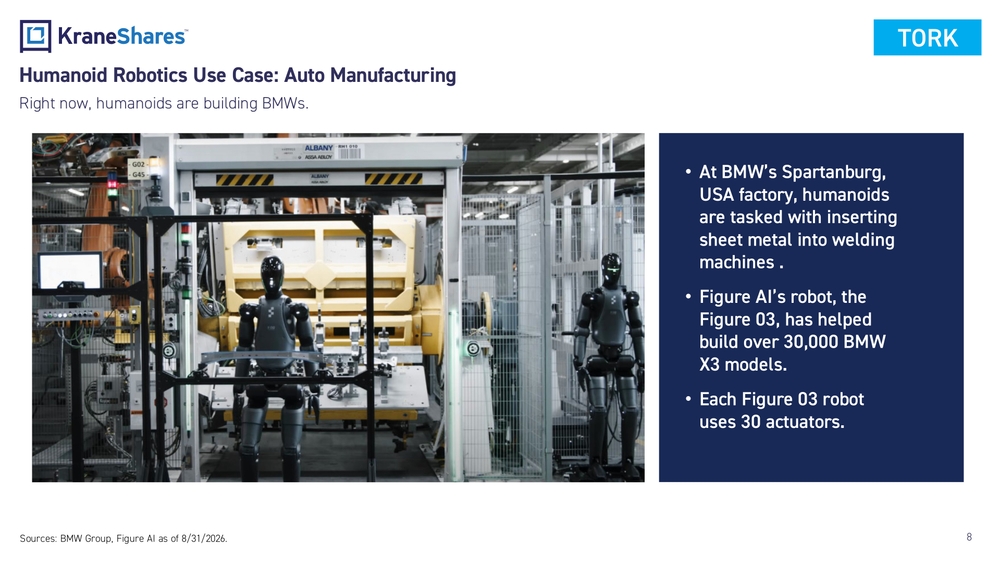
Humanoid Robotics Use Case: Auto Manufacturing Right now, humanoids are building BMWs. •At BMW’s Spartanburg, USA factory, humanoids are tasked with inserting sheet metal into welding machines . •Figure AI’s robot, the Figure 03, has helped build over 30,000 BMW X3 models. •Each Figure 03 robot uses 30 actuators. Sources: BMW Group, Figure AI as of 8/31/2026. 8TORK
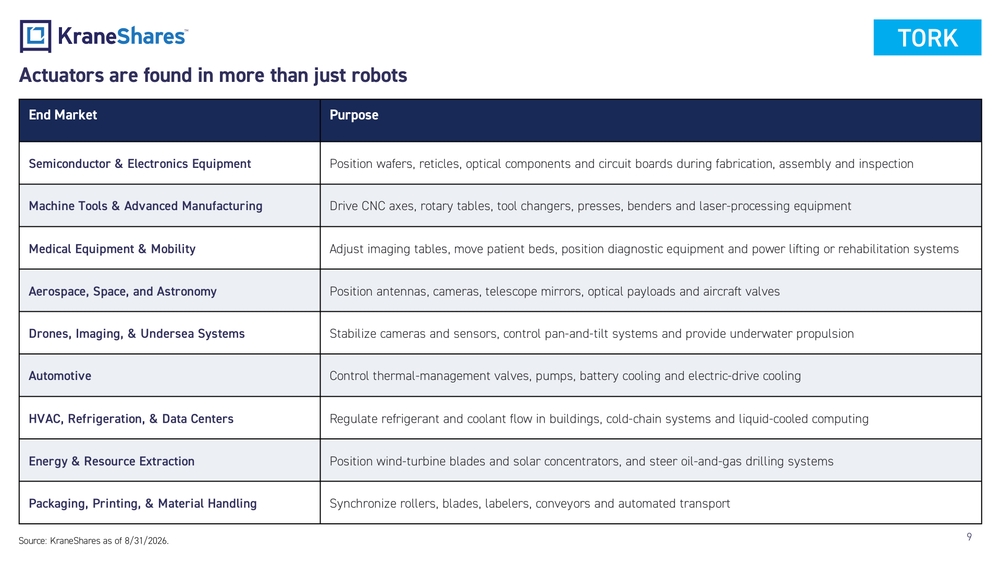
Actuators are found in more than just robots End Market Purpose Semiconductor &Electronics Equipment Position wafers, reticles, optical components and circuit boards during fabrication, assembly and inspection Machine Tools &Advanced Manufacturing Drive CNC axes, rotary tables, tool changers, presses, benders and laser -processing equipment Medical Equipment &Mobility Adjust imaging tables, move patient beds, position diagnostic equipment and power lifting or rehabilitation systems Aerospace, Space , and Astronomy Position antennas, cameras, telescope mirrors, optical payloads and aircraft valves Drones, Imaging , & Undersea S ystems Stabilize cameras and sensors, control pan -and-tilt systems and provide underwater propulsion Automotive Control thermal -management valves, pumps, battery cooling and electric -drive cooling HVAC, Refrigeration , & D ata Centers Regulate refrigerant and coolant flow in buildings, cold -chain systems and liquid -cooled computing Energy &Resource Extraction Position wind -turbine blades and solar concentrators, and steer oil -and-gas drilling systems Packaging, Printing , & M aterial Handling Synchronize rollers, blades, labelers, conveyors and automated transport Source: KraneShares as of 8/31/2026.9TORK
68%
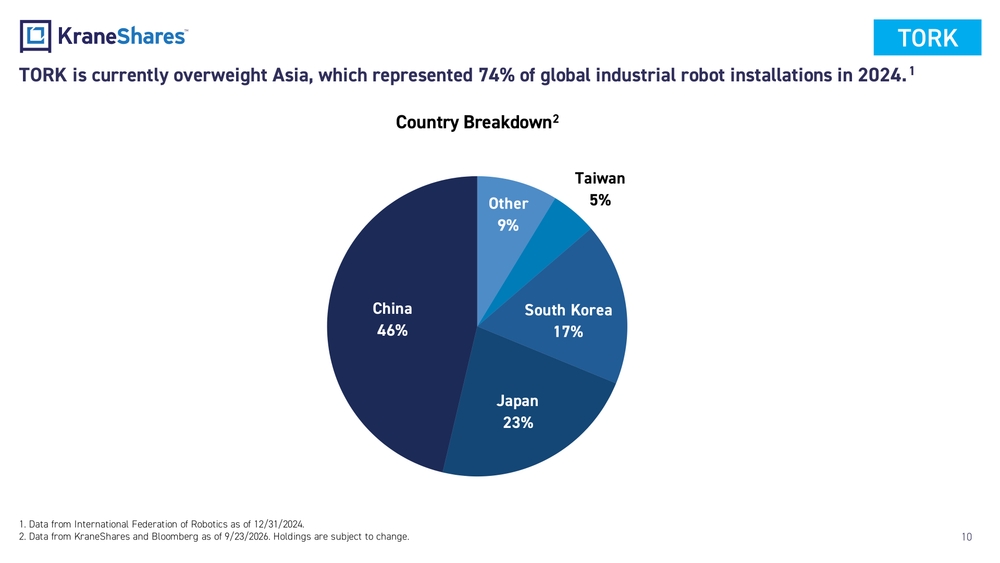
- Data from International Federation of Robotics as of 12/31/2024.
- Data from KraneShares and Bloomberg as of 9/23/2026. Holdings are subject to change.TORK is currently overweight Asia, which represented 74% of global industrial robot installations in 2024.1 Other 9%Taiwan 5% South Korea 17% Japan 23%China 46%Country Breakdown2 10TORK
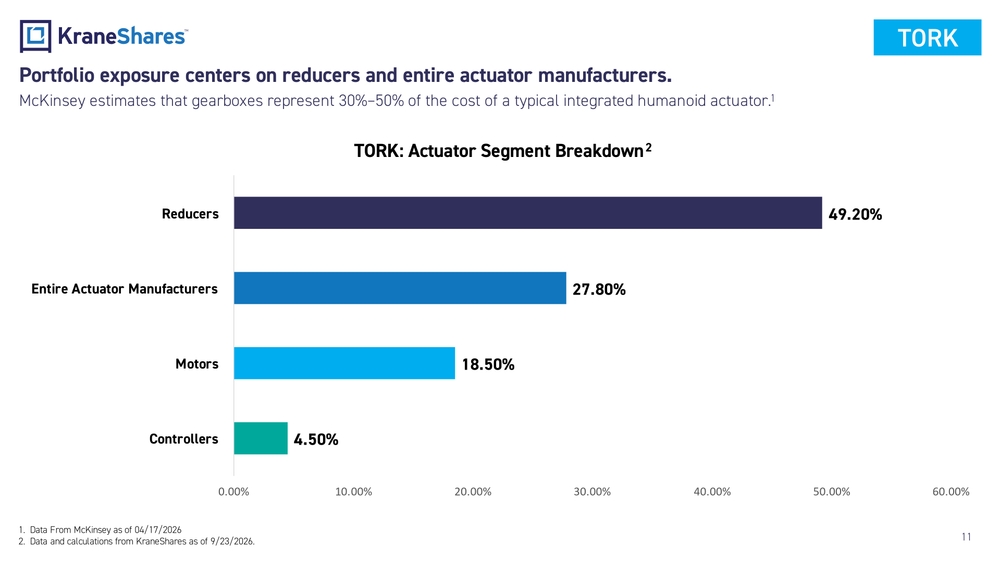
4.50%18.50%27.80%49.20% 0.00% 10.00% 20.00% 30.00% 40.00% 50.00% 60.00%ControllersMotorsEntire Actuator ManufacturersReducersTORK: Actuator Segment Breakdown2Portfolio exposure centers on reducers and entire actuator manufacturers. McKinsey estimates that gearboxes represent 30% –50% of the cost of a typical integrated humanoid actuator.1 1.Data From McKinsey as of 04/17/2026 2.Data and calculations from KraneShares as of 9/23/2026.11TORK
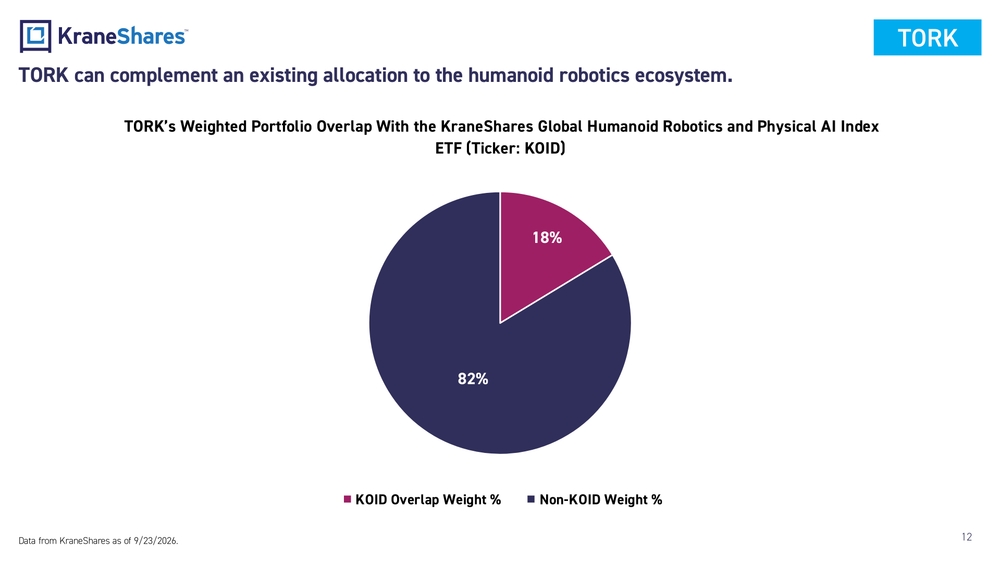
18% 82%TORK’s Weighted Portfolio Overlap With the KraneShares Global Humanoid Robotics and Physical AI Index ETF (Ticker: KOID) KOID Overlap Weight % Non-KOID Weight %TORK can complement an existing allocation to the humanoid robotics ecosystem. Data from KraneShares as of 9/23/2026.12TORK
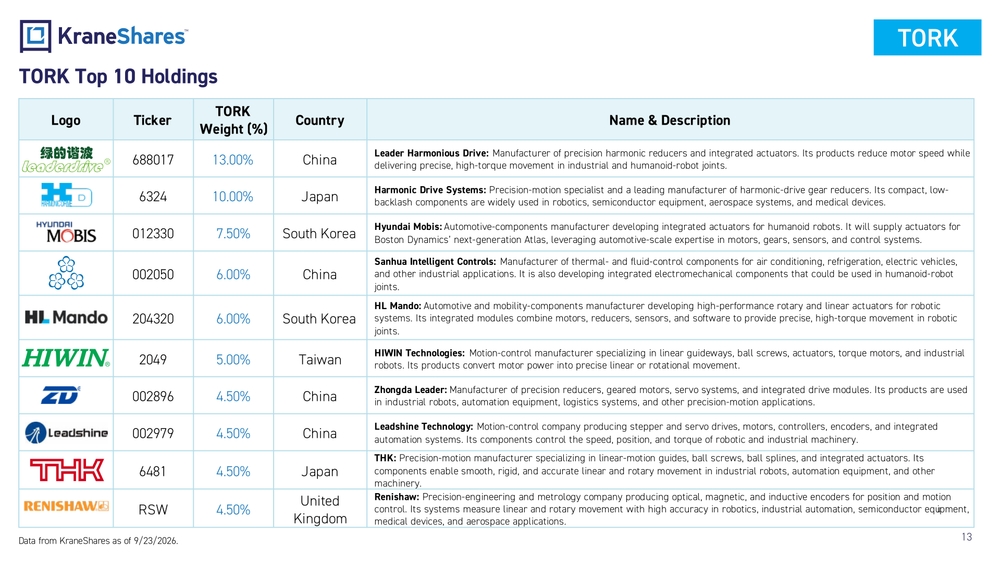
Logo TickerTORK Weight (%)Country Name & Description 688017 13.00% ChinaLeader Harmonious Drive: Manufacturer of precision harmonic reducers and integrated actuators. Its products reduce motor speed while delivering precise, high -torque movement in industrial and humanoid -robot joints. 6324 10.00% JapanHarmonic Drive Systems: Precision -motion specialist and a leading manufacturer of harmonic -drive gear reducers. Its compact, low - backlash components are widely used in robotics, semiconductor equipment, aerospace systems, and medical devices. 012330 7.50% South KoreaHyundai Mobis: Automotive -components manufacturer developing integrated actuators for humanoid robots. It will supply actuators for Boston Dynamics’ next -generation Atlas, leveraging automotive -scale expertise in motors, gears, sensors, and control systems. 002050 6.00% ChinaSanhua Intelligent Controls: Manufacturer of thermal - and fluid -control components for air conditioning, refrigeration, electric vehicles, and other industrial applications. It is also developing integrated electromechanical components that could be used in humano id-robot joints. 204320 6.00% South KoreaHL Mando: Automotive and mobility -components manufacturer developing high -performance rotary and linear actuators for robotic systems. Its integrated modules combine motors, reducers, sensors, and software to provide precise, high -torque movement in robo tic joints. 2049 5.00% TaiwanHIWIN Technologies: Motion -control manufacturer specializing in linear guideways, ball screws, actuators, torque motors, and industrial robots. Its products convert motor power into precise linear or rotational movement. 002896 4.50% ChinaZhongda Leader: Manufacturer of precision reducers, geared motors, servo systems, and integrated drive modules. Its products are used in industrial robots, automation equipment, logistics systems, and other precision -motion applications. 002979 4.50% ChinaLeadshine Technology: Motion -control company producing stepper and servo drives, motors, controllers, encoders, and integrated automation systems. Its components control the speed, position, and torque of robotic and industrial machinery. 6481 4.50% JapanTHK: Precision -motion manufacturer specializing in linear -motion guides, ball screws, ball splines, and integrated actuators. Its components enable smooth, rigid, and accurate linear and rotary movement in industrial robots, automation equipment, and othe r machinery. RSW 4.50%United KingdomRenishaw: Precision -engineering and metrology company producing optical, magnetic, and inductive encoders for position and motion control. Its systems measure linear and rotary movement with high accuracy in robotics, industrial automation, semiconductor equipment, medical devices, and aerospace applications.TORK Top 10 Holdings Data from KraneShares as of 9/23/2026. 13 TORK
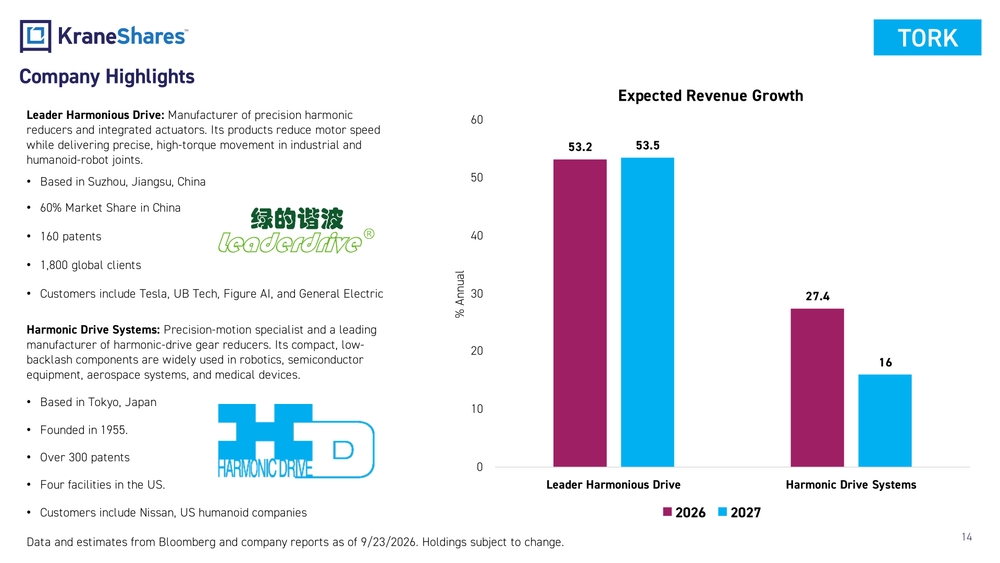
Leader Harmonious Drive: Manufacturer of precision harmonic reducers and integrated actuators. Its products reduce motor speed while delivering precise, high -torque movement in industrial and humanoid -robot joints. •Based in Suzhou, Jiangsu, China •60% Market Share in China •160 patents •1,800 global clients •Customers include Tesla , UB Tech, Figure AI, and General ElectricCompany Highlights Data and estimates from Bloomberg and company reports as of 9/23/2026. Holdings subject to change. 14Harmonic Drive Systems: Precision -motion specialist and a leading manufacturer of harmonic -drive gear reducers. Its compact, low - backlash components are widely used in robotics, semiconductor equipment, aerospace systems, and medical devices. •Based in Tokyo, Japan •Founded in 1955. •Over 300 patents •Four facilities in the US. •Customers include Nissan, US humanoid companies 53.2 27.453.5 16 0102030405060 Leader Harmonious Drive Harmonic Drive Systems% AnnualExpected Revenue Growth 2026 2027TORK
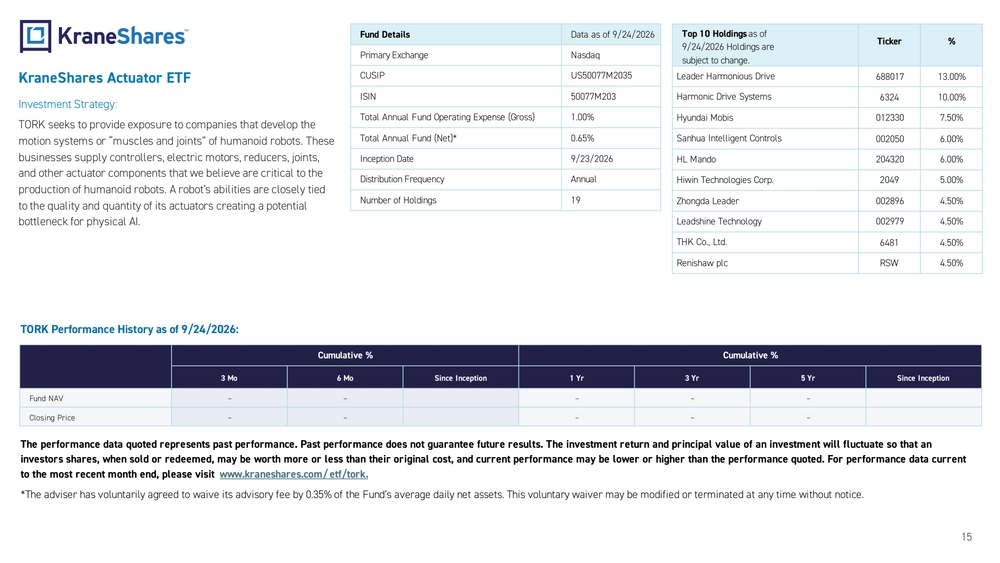
KraneShares Actuator ETF Investment Strategy: TORK seeks to provide exposure to companies that develop the motion systems or “muscles and joints” of humanoid robots. These businesses supply controllers, electric motors, reducers, joints, and other actuator components that we believe are critical to the production of humanoid robots. A robot’s abilities are closely tied to the quality and quantity of its actuators creating a potential bottleneck for physical AI.Fund Details Data as of 9/24/2026 Primary Exchange Nasdaq CUSIP US50077M2035 ISIN 50077M203 Total Annual Fund Operating Expense (Gross) 1.00% Total Annual Fund (Net)* 0.65% Inception Date 9/23/2026 Distribution Frequency Annual Number ofHoldings 19Top 10 Holdings as of 9/24/2026 Holdings are subject to change.Ticker % Leader Harmonious Drive 688017 13.00% Harmonic Drive Systems 6324 10.00% Hyundai Mobis 012330 7.50% Sanhua Intelligent Controls 002050 6.00% HL Mando 204320 6.00% Hiwin Technologies Corp. 2049 5.00% Zhongda Leader 002896 4.50% Leadshine Technology 002979 4.50% THK Co., Ltd. 6481 4.50% Renishaw plc RSW 4.50% TORK Performance History asof9/24/2026: Cumulative % Cumulative % 3Mo 6Mo Since Inception 1Yr 3Yr 5Yr Since Inception Fund NAV – – – – – Closing Price – – – – – The performance data quoted represents past performance. Past performance does not guarantee future results. The investment return and principal value of an investment will fluctuate so that an investors shares, when sold or redeemed, may be worth more or less than their original cost, and current performance may be lower or higher than the performance quoted. For performance data current to the most recent month end, please visit www.kraneshares.com/ etf/tork . *The adviser has voluntarily agreed to waive its advisory fee by 0.35% of the Fund’s average daily net assets. This voluntary waiver may be modified or terminated at any time without notice. 15
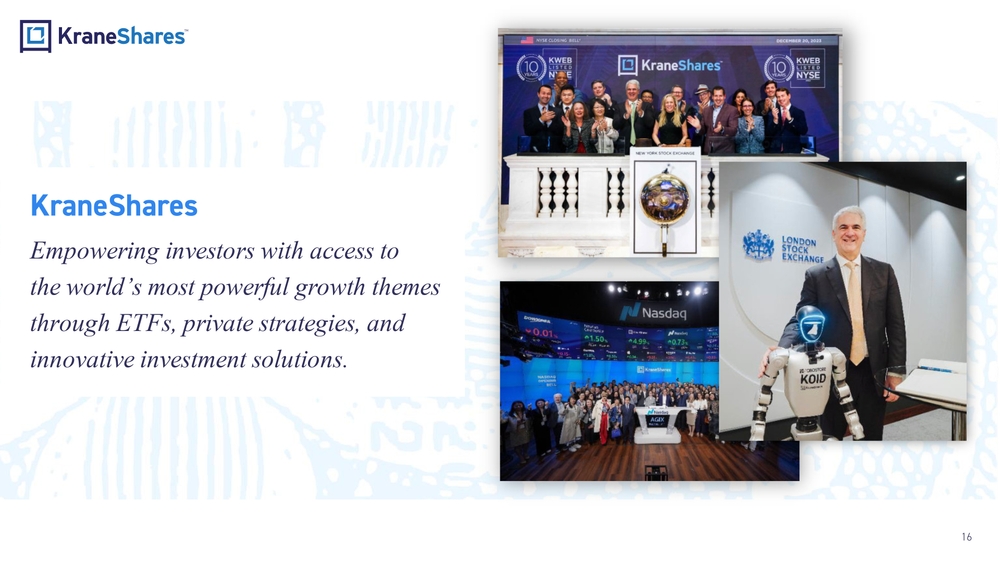
KraneShares Empowering investors with access to the world’ s most powerful growth themes through ETFs, private strategies, and innovative investment solutions. 16
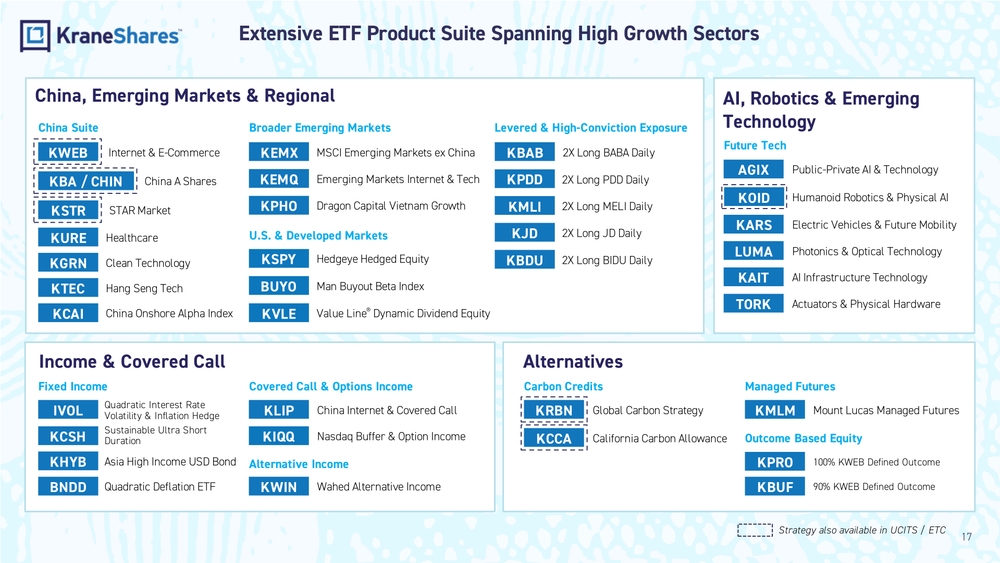
China, Emerging Markets & Regional Alternatives Income & Covered Call AI, Robotics & Emerging Technology KURE Healthcare KGRN Clean Technology KTEC Hang Seng Tech KCAI China Onshore Alpha IndexAGIX Public -Private AI & TechnologyChina Suite Future TechBroader Emerging Markets KEMQ Emerging Markets Internet & Tech KPHO Dragon Capital Vietnam GrowthKEMX MSCI Emerging Markets ex China U.S. & Developed Markets KVLE Value Line® Dynamic Dividend EquityHedgeye Hedged Equity KSPY Man Buyout Beta Index BUYO Fixed Income BNDD Quadratic Deflation ETFIVOLQuadratic Interest Rate Volatility & Inflation Hedge KHYB Asia High Income USD BondSustainable Ultra Short Duration KCSHCarbon CreditsKPDD 2X Long PDD Daily KJD 2X Long JD DailyKBAB 2X Long BABA Daily KMLI 2X Long MELI Daily Covered Call & Options Income Managed Futures KMLM Mount Lucas Managed Futures KWIN Wahed Alternative IncomeKLIP China Internet & Covered Call Outcome Based Equity KIQQ Nasdaq Buffer & Option IncomeLevered & High -Conviction Exposure KBUF 90% KWEB Defined Outcome100% KWEB Defined Outcome KPRO Alternative Income Extensive ETF Product Suite Spanning High Growth Sectors KWEB Internet & E -Commerce KOID Humanoid Robotics & Physical AI Strategy also available in UCITS / ETCKBDU 2X Long BIDU DailyChina A Shares KBA / CHIN KSTR STAR Market Global Carbon Strategy KRBN KCCA California Carbon AllowanceElectric Vehicles & Future Mobility KARS LUMA Photonics & Optical Technology KAIT AI Infrastructure Technology TORK Actuators & Physical Hardware 17
Definitions: P/E (Price -to-Earnings ratio): A company’s share price divided by its earnings per share. It shows how much investors are paying for each dollar of current or historical earnings. Forward P/E: A company’s share price divided by its forecast earnings per share, usually for the next 12 months or fiscal year. It depends on analysts’ estimates and may change as forecasts are revised. EPS (Earnings per Share): A company’s net income attributable to common shareholders divided by its weighted -average number of shares outstanding. It meas ures the profit earned for each share. Revenue Growth: The percentage increase or decrease in a company’s sales over a specified period, commonly year over year. Revenue growth mea sures changes in the top line, not profitability. Total Addressable Market (TAM): The maximum annual revenue opportunity available for a product or service if it captured 100% of its relevant market. TAM rep resents theoretical market size rather than a realistic sales forecast. 18
Important Notes: Carefully consider the Funds’ investment objectives, risk factors, charges and expenses before investing. This and additional information can be found in the Fund’s full and summary prospectus, which may be obtained by visiting www.kraneshares.com/etf/tork . Read the prospectus carefully before investing. Risk Disclosures: Investing involves risk, including possible loss of principal. There can be no assurance that a Fund will achieve its stated objectives. Indices are unmanaged and do not include the effect of fees. This information should not be relied upon as research, investment advice, or a recommendation regarding any products, strate gies, or any security in particular. This material is strictly for illustrative, educational, or informational purposes and is subject to change. Certain content represents an assessment of the market envir onment at a specific time and is not intended to be a forecast of future events or a guarantee of future results; material is as of the dates noted and is subject to change without notice. Humanoid, embedded intelligence technology, and actuator/robotics supply chain companies often face high research and capital costs, resulting in variable profitability in a competitive market where products can quickly become obsolete. Their reliance on intellectual property makes them vulnerable to losses, while legal and regulat ory changes can impact profitability. Defining these companies can be complex, and some may risk commercial failure. They are also affected by global scientific developments, leading to rapid obsolescence, an d may be subject to government regulations. Many companies in which the Fund invests may not currently be profitable, with no guarantee of future success. A-Shares are issued by companies in mainland China and traded on local exchanges. They are available to domestic and certain fo reign investors, including QFIs and those participating in Stock Connect Programs like Shanghai -Hong Kong and Shenzhen -Hong Kong. Foreign investments in A -Shares face various regulations and restrictio ns, including limits on asset repatriation. A -Shares may experience frequent trading halts and illiquidity, which can lead to volatility in the Fund’s share price and increased trading halt ris ks. The Chinese economy is an emerging market, vulnerable to domestic and regional economic and political changes, often showing more volatility than developed markets. Companies face risks from potential gov ernment interventions, and the export -driven economy is sensitive to downturns in key trading partners, impacting the Fund. U.S. -China tensions raise concerns over tariffs and trade restrictions, which could ha rm China’s exports and the Fund. China’s regulatory standards are less stringent than in the U.S., resulting in limited information about issuers. Tax laws are unclear and subject to change, potentially imp acting the Fund and leading to unexpected liabilities for foreign investors. Fluctuations in currency of foreign countries may have an adverse effect to domestic currency values. The Japanese economy depends heavily on international trade and is vulnerable to economic, political, and social instability, which could affect the Fund. The yen is volatile, influenced by fluctuations in Asia, and has historically shown unpredictable movements against the U.S. dollar. Natural disasters, such as earthquakes and tidal wave s, also pose risks. Furthermore, government intervention and an unstable financial services sector can negatively impact the economy, which relies significantly on trade with developing nations in East and So utheast Asia. The Fund invests in non -U.S. securities, which can be less liquid and subject to weaker regulatory oversight compared to U.S. se curities. Risks include currency fluctuations, political or economic instability, incomplete financial disclosure, and potential taxes or nationalization of holdings. Foreign trading hours and settlement pro cesses may also limit the Fund’s ability to trade, and different accounting standards can add complexity. Suspensions of foreign securities may adversely impact the Fund, and delays in settlement or holidays may hinder asset liquidation, increasing the risk of loss. 19
Risk disclosures continued: The Fund may invest in derivatives, which are often more volatile than other investments and may magnify the Fund’s gains or losses. A derivative (i.e., futures/forward contracts, swaps, and options) is a contract that derives its value from the performance of an underlying asset. The primary risk of derivatives is that changes in the asset’s market value and the derivative may not be proportionate, and some derivatives can have the potential for unlimited losses. Derivatives are also subject to liquidity and counterparty risk. The Fund is subject to liquidity risk, meaning that certain investments may become difficult to purchase or sell at a reasonable time and price. If a transaction for these securities is large, it may not be possible to initiate, which may cause the Fund to suffer losses. Counterparty risk is the risk of loss in the event that the counterparty to an agreement fails to make required payments or otherwise comply with the terms of the derivative. Large capitalization companies may struggle to adapt fast, impacting their growth compared to smaller firms, especially in ex pansive times. This could result in lower stock returns than investing in smaller and mid -sized companies. In addition to the normal risks associated with investing, investments in smaller companies typically e xhibit higher volatility. The Fund may invest in privately -issued and private company securities, which are generally not registered, may carry resale res trictions, and often lack active markets. These investments can be less liquid, harder to value, and subject to larger price swings, which may result in delays or higher costs when buying or selling. Priva te companies may have limited operating histories, smaller or less established businesses, fewer financial resources, and less available information. They may be more vulnerable to competition, market con ditions, or economic downturns. A liquid market for their securities may never develop and IPOs, if they occur, can be volatile and may negatively affect the Fund’s investment. A large number of shares of the Fund is held by a single shareholder or a small group of shareholders. Redemptions from these shareholders can harm Fund performance, especially in declining markets, leading to forced sales at disadvantageous prices, increased costs, and adverse tax effects for remaining shareholders. The Fund is new and does not yet have a significant number of shares outstanding. If the Fund does not grow in size, it will be at greater risk than larger funds of wider bid -ask spreads for its shares, trading at a greater premium or discount to NAV, liquidation and/or a trading halt. Narrowly focused investments typically exhibit highe r volatility. The Fund’s assets are expected to be concentrated in an industry or group of industries, especially the Technology Sector, Industrial Sector, and companies focused on Artificial Intelligence an d Technology. The securities or futures in that concentration could react similarly to market developments. Thus, the Fund is subject to loss due to adverse occurrences that affect that concentration. TORK is non -diversified. ETF shares are bought and sold on an exchange at market price (not NAV) and are not individually redeemed from the Fund. Howe ver, shares may be redeemed at NAV directly by certain authorized broker - dealers (Authorized Participants) in very large creation/redemption units. The returns shown do not represent the returns you would receive if you traded shares at other times. Shares may trade at a premium or discount to their NAV in the secondary market. Brokerage commissions will reduce returns. Beginning 12/23/2020, ma rket price returns are based on the official closing price of an ETF share or, if the official closing price isn't available, the midpoint between the national best bid and national best offer ("NBBO") as of the time the ETF calculates the current NAV per share. Prior to that date, market price returns were based on the midpoint between the Bid and Ask price. NAVs are calculated using prices as of 4:00 PM Eastern Time . The KraneShares ETFs and KFA Funds ETFs are distributed by SEI Investments Distribution Company (SIDCO), 1 Freedom Valley Dri ve, Oaks, PA 19456, which is not affiliated with Krane Funds Advisors, LLC, the Investment Adviser for the Funds, or any sub -advisers for the Funds. 20