KLIP: KraneShares KWEB Covered Call Strategy ETF
by Kraneshares
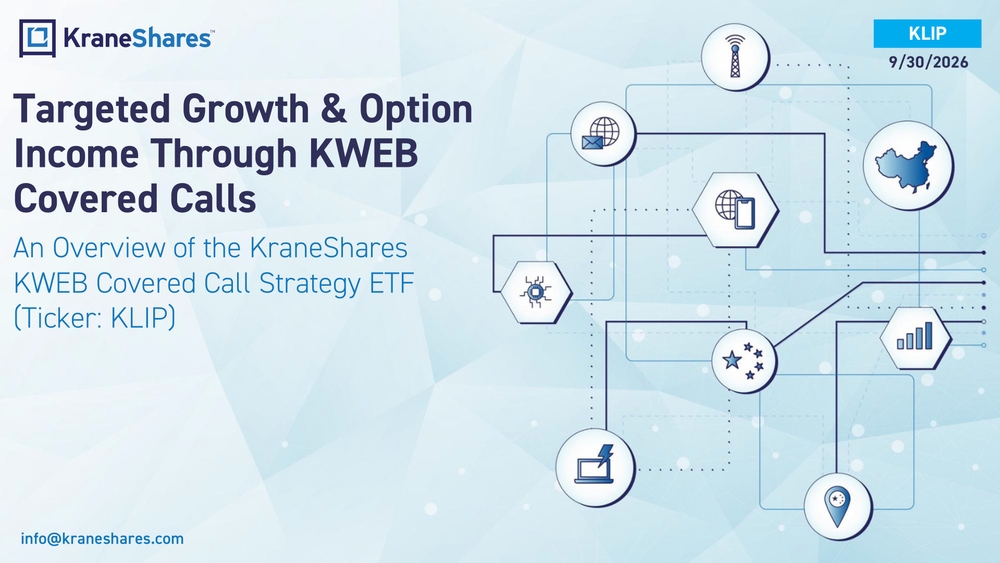
KLIP 9/30/2026 Targeted Growth & Option Income Through KWEB Covered Calls An Overview of the KraneShares KWEB Covered Call Strategy ETF (Ticker: KLIP) info@kraneshares.com
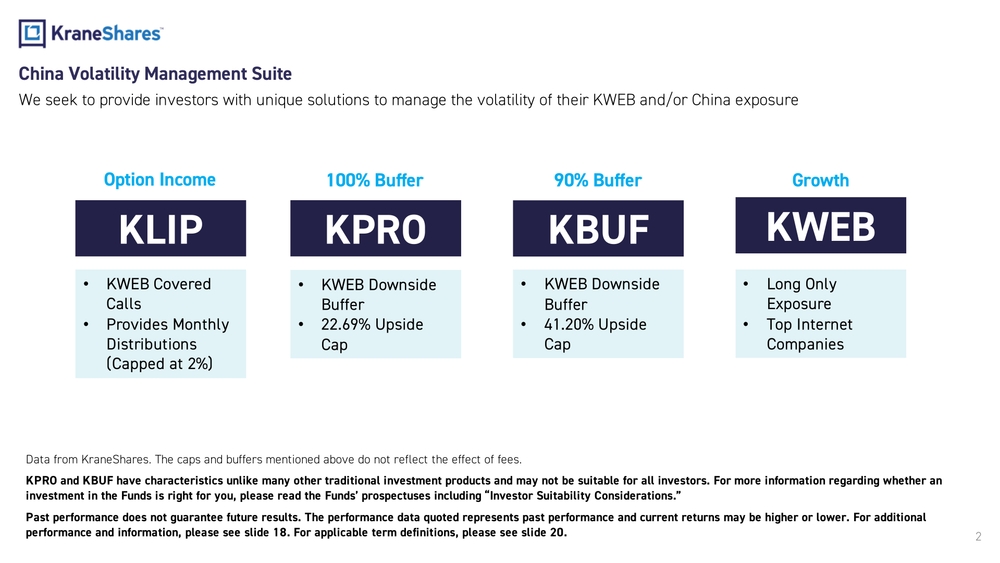
2We seek to provide investors with unique solutions to manage the volatility of their KWEB and/or China exposureChina Volatility Management Suite Data from KraneShares. The caps and buffers mentioned above do not reflect the effect of fees. KPRO and KBUF have characteristics unlike many other traditional investment products and may not be suitable for all investor s. For more information regarding whether an investment in the Funds is right for you, please read the Funds’ prospectuses including “Investor Suitability Considerations. ” Past performance does not guarantee future results. The performance data quoted represents past performance and current retur ns may be higher or lower. For additional performance and information, please see slide 18. For applicable term definitions, please see slide 20.Option Income 90% Buffer Growth •KWEB Covered Calls •Provides Monthly Distributions (Capped at 2%)KLIP KBUF100% Buffer KPRO KWEB •KWEB Downside Buffer •41.20% Upside Cap•Long Only Exposure •Top Internet Companies•KWEB Downside Buffer •22.69% Upside Cap
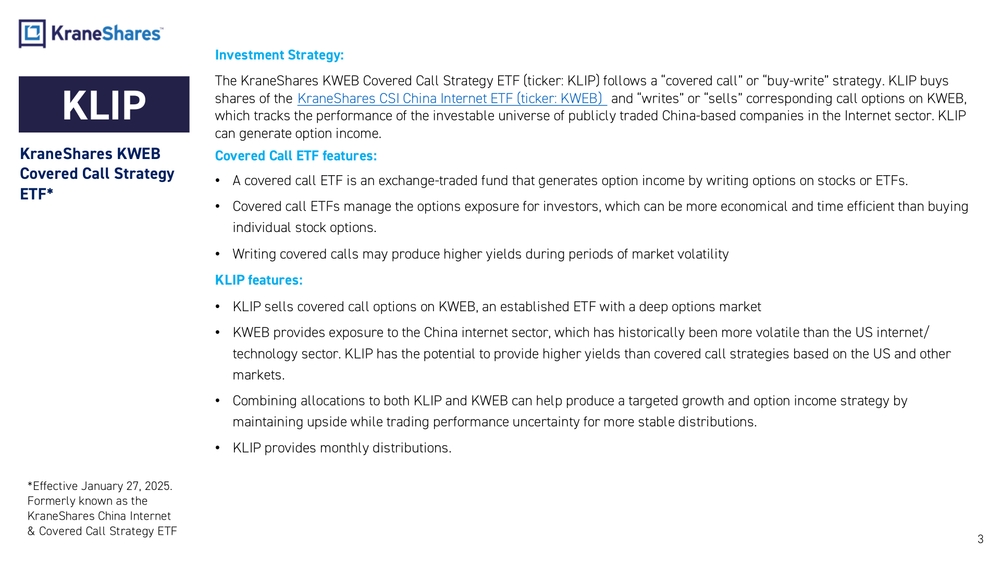
Investment Strategy: The KraneShares KWEB Covered Call Strategy ETF (ticker: KLIP) follows a “covered call” or “buy -write” strategy. KLIP buys shares of the KraneShares CSI China Internet ETF (ticker: KWEB) and “writes” or “sells” corresponding call options on KWEB, which tracks the performance of the investable universe of publicly traded China -based companies in the Internet sector. KLIP can generate option income. Covered Call ETF features: •A covered call ETF is an exchange -traded fund that generates option income by writing options on stocks or ETFs. •Covered call ETFs manage the options exposure for investors, which can be more economical and time efficient than buying individual stock options. •Writing covered calls may produce higher yields during periods of market volatility KLIP features: •KLIP sells covered call options on KWEB, an established ETF with a deep options market •KWEB provides exposure to the China internet sector, which has historically been more volatile than the US internet/ technology sector. KLIP has the potential to provide higher yields than covered call strategies based on the US and other markets. •Combining allocations to both KLIP and KWEB can help produce a targeted growth and option income strategy by maintaining upside while trading performance uncertainty for more stable distributions. •KLIP provides monthly distributions.KLIP KraneShares KWEB Covered Call Strategy ETF* 3*Effective January 27, 2025. Formerly known as the KraneShares China Internet & Covered Call Strategy ETF
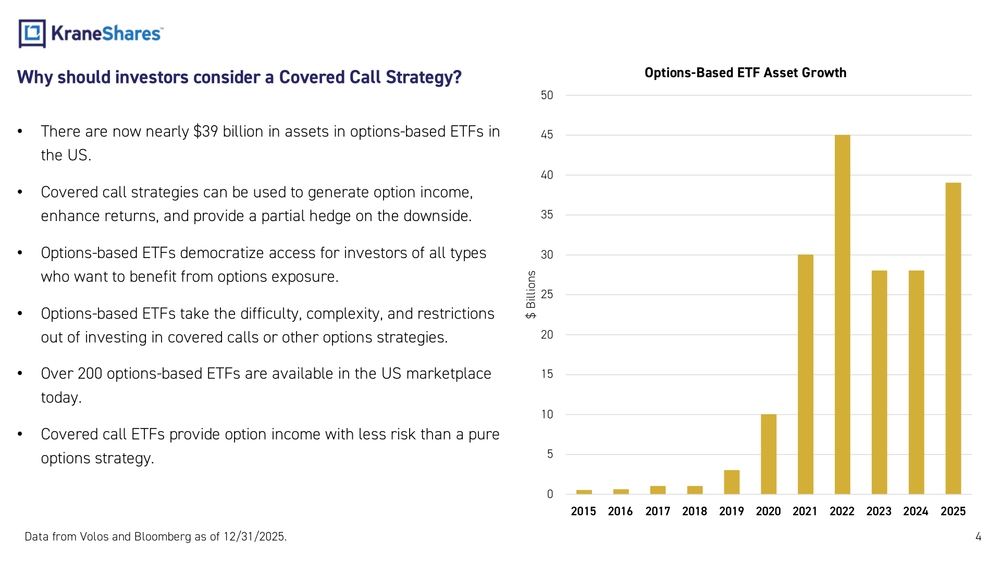
4Why should investors consider a Covered Call Strategy? •There are now nearly $39 billion in assets in options -based ETFs in the US. •Covered call strategies can be used to generate option income, enhance returns, and provide a partial hedge on the downside. •Options -based ETFs democratize access for investors of all types who want to benefit from options exposure. •Options -based ETFs take the difficulty, complexity, and restrictions out of investing in covered calls or other options strategies. •Over 200 options -based ETFs are available in the US marketplace today. •Covered call ETFs provide option income with less risk than a pure options strategy. Data from Volos and Bloomberg as of 12/31/2025.05101520253035404550 2015 2016 2017 2018 2019 2020 2021 2022 2023 2024 2025$ BillionsOptions -Based ETF Asset Growth
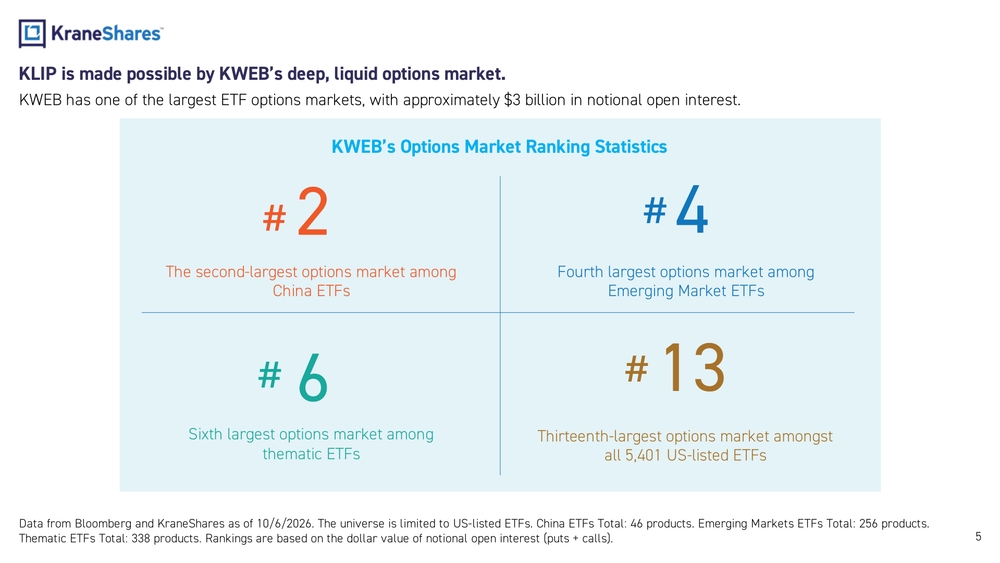
5KWEB has one of the largest ETF options markets, with approximately $3 billion in notional open interest.KLIP is made possible by KWEB’s deep, liquid options market. Data from Bloomberg and KraneShares as of 10/6/2026. The universe is limited to US -listed ETFs. China ETFs Total: 46 products. E merging Markets ETFs Total: 256 products. Thematic ETFs Total: 338 products. Rankings are based on the dollar value of notional open interest (puts + calls). 2 The second -largest options market among China ETFs# 4 Fourth largest options market among Emerging Market ETFs# 13 Thirteenth -largest options market amongst all 5,401 US -listed ETFs# 6 Sixth largest options market among thematic ETFs#KWEB’s Options Market Ranking Statistics
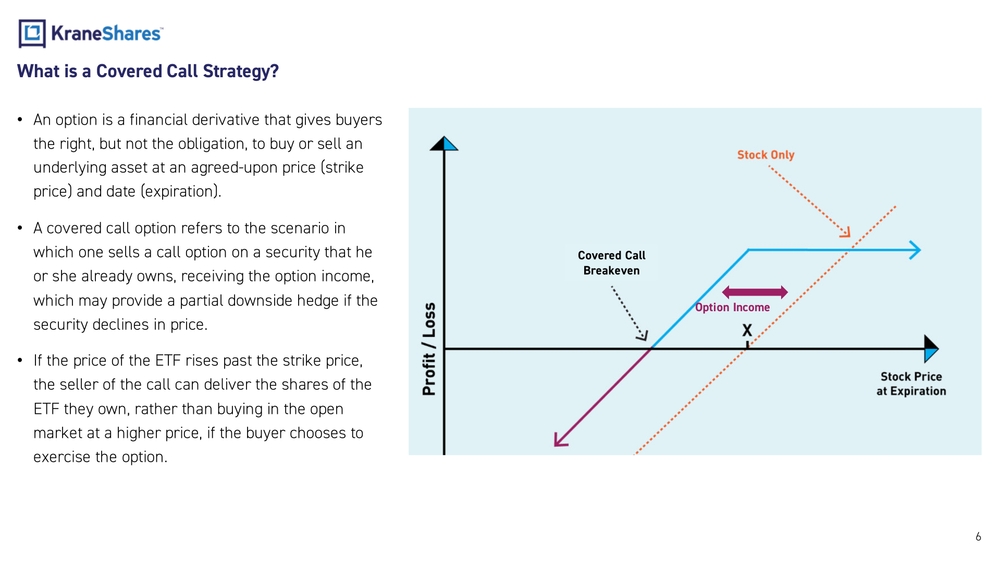
6What is a Covered Call Strategy? •An option is a financial derivative that gives buyers the right, but not the obligation, to buy or sell an underlying asset at an agreed -upon price (strike price) and date (expiration). •A covered call option refers to the scenario in which one sells a call option on a security that he or she already owns, receiving the option income, which may provide a partial downside hedge if the security declines in price. •If the price of the ETF rises past the strike price, the seller of the call can deliver the shares of the ETF they own, rather than buying in the open market at a higher price, if the buyer chooses to exercise the option. Option IncomeCovered Call Breakeven
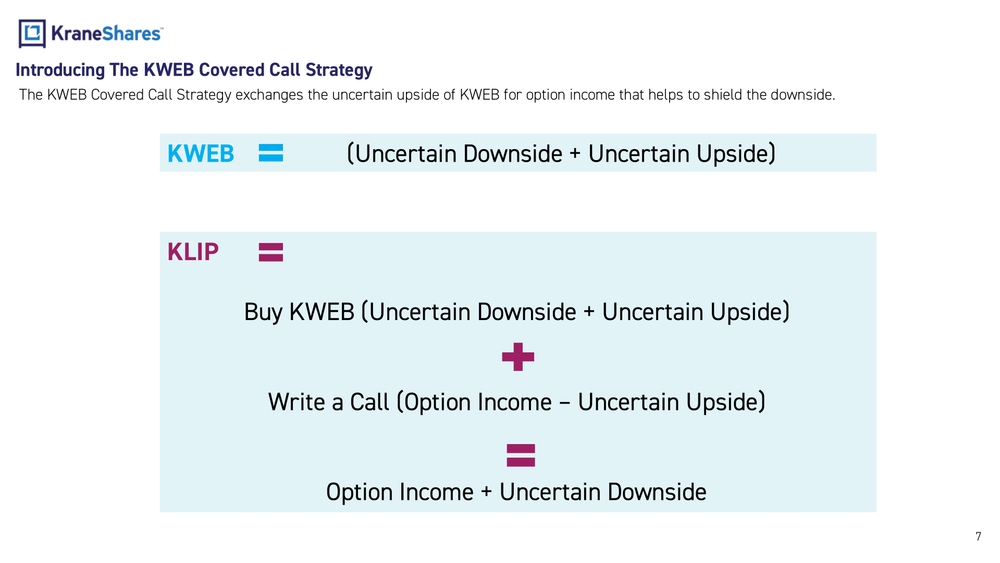
KWEB (Uncertain Downside + Uncertain Upside) KLIP Buy KWEB (Uncertain Downside + Uncertain Upside) Write a Call (Option Income – Uncertain Upside) Option Income + Uncertain Downside 7Introducing The KWEB Covered Call Strategy The KWEB Covered Call Strategy exchanges the uncertain upside of KWEB for option income that helps to shield the downside.
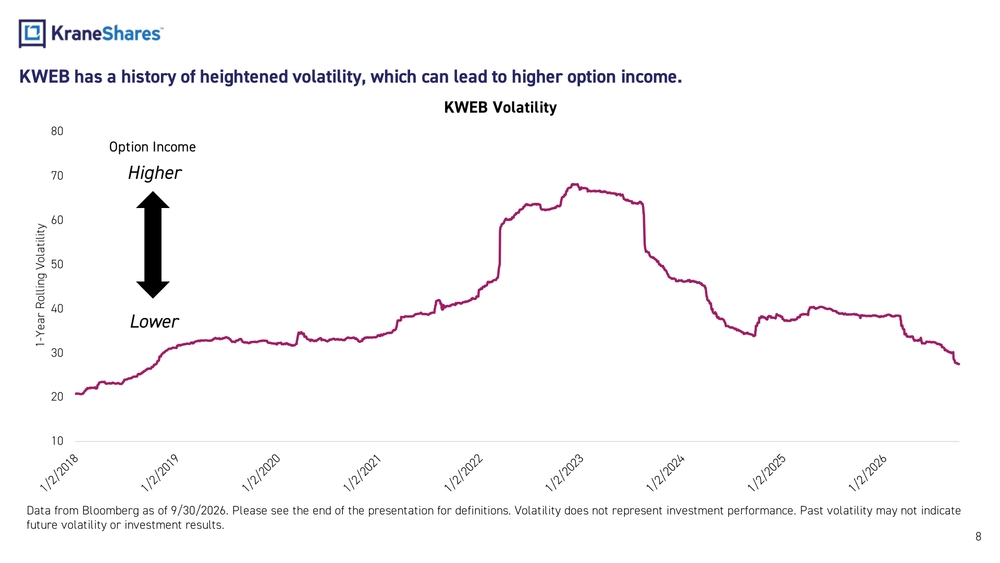
8KWEB has a history of heightened volatility, which can lead to higher option income. Data from Bloomberg as of 9/30/2026. Please see the end of the presentation for definitions. Volatility does not represent in vestment performance. Past volatility may not indicate future volatility or investment results.Higher LowerOption Income 10203040506070801-Year Rolling VolatilityKWEB Volatility
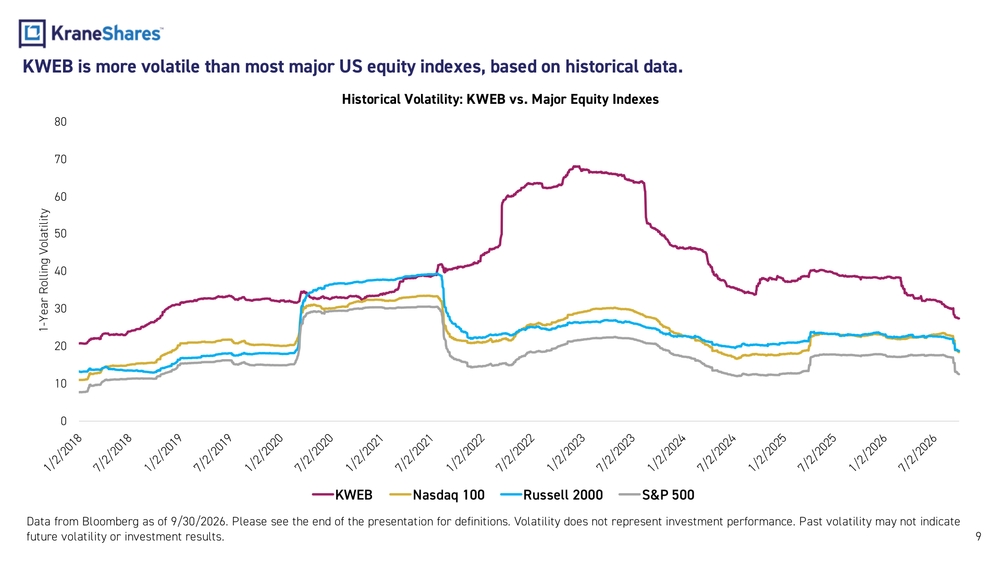
9KWEB is more volatile than most major US equity indexes, based on historical data. Data from Bloomberg as of 9/30/2026. Please see the end of the presentation for definitions. Volatility does not represent investment performance. Past volatility may not indicate future volatility or investment results.010203040506070801-Year Rolling VolatilityHistorical Volatility: KWEB vs. Major Equity Indexes KWEB Nasdaq 100 Russell 2000 S&P 500
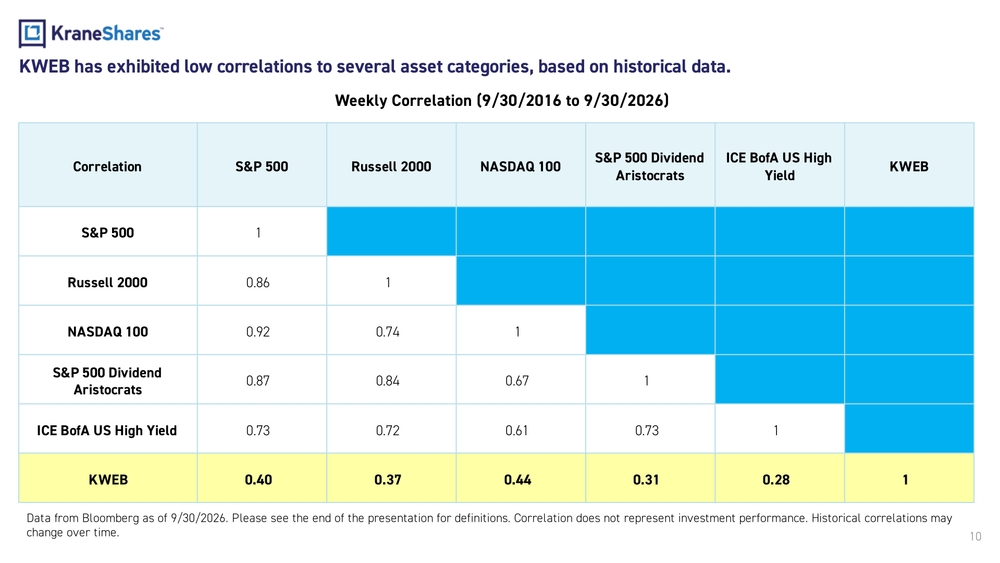
10KWEB has exhibited low correlations to several asset categories, based on historical data. Correlation S&P 500 Russell 2000 NASDAQ 100S&P 500 Dividend AristocratsICE BofA US High YieldKWEB S&P 500 1 Russell 2000 0.86 1 NASDAQ 100 0.92 0.74 1 S&P 500 Dividend Aristocrats0.87 0.84 0.67 1 ICE BofA US High Yield 0.73 0.72 0.61 0.73 1 KWEB 0.40 0.37 0.44 0.31 0.28 1Weekly Correlation (9/30/2016 to 9/30/2026) Data from Bloomberg as of 9/30/2026. Please see the end of the presentation for definitions. Correlation does not represent i nvestment performance. Historical correlations may change over time.
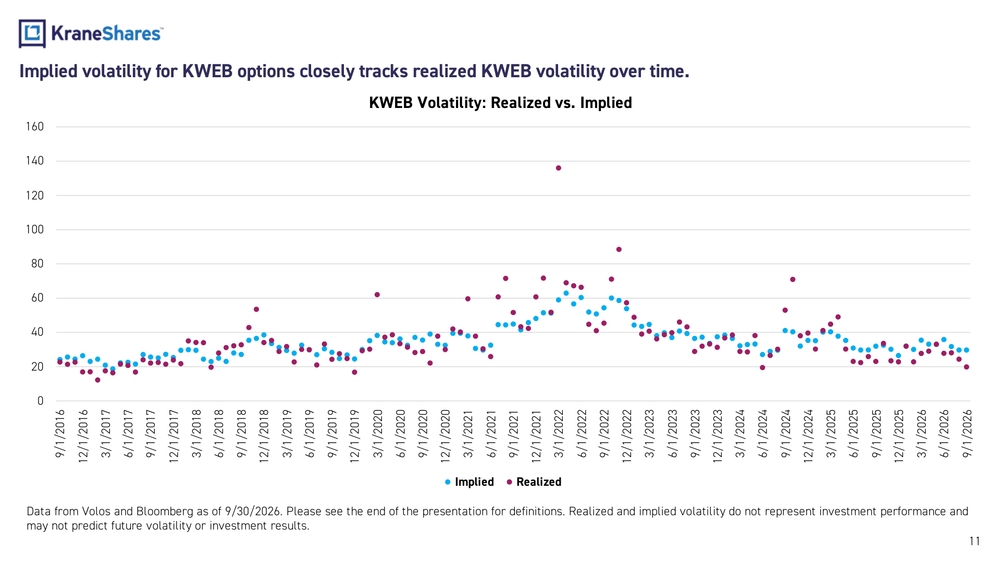
Implied volatility for KWEB options closely tracks realized KWEB volatility over time. Data from Volos and Bloomberg as of 9/30/2026. Please see the end of the presentation for definitions. Realized and implied v olatility do not represent investment performance and may not predict future volatility or investment results. 11020406080100120140160 9/1/2016 12/1/2016 3/1/2017 6/1/2017 9/1/2017 12/1/2017 3/1/2018 6/1/2018 9/1/2018 12/1/2018 3/1/2019 6/1/2019 9/1/2019 12/1/2019 3/1/2020 6/1/2020 9/1/2020 12/1/2020 3/1/2021 6/1/2021 9/1/2021 12/1/2021 3/1/2022 6/1/2022 9/1/2022 12/1/2022 3/1/2023 6/1/2023 9/1/2023 12/1/2023 3/1/2024 6/1/2024 9/1/2024 12/1/2024 3/1/2025 6/1/2025 9/1/2025 12/1/2025 3/1/2026 6/1/2026 9/1/2026KWEB Volatility: Realized vs. Implied Implied Realized
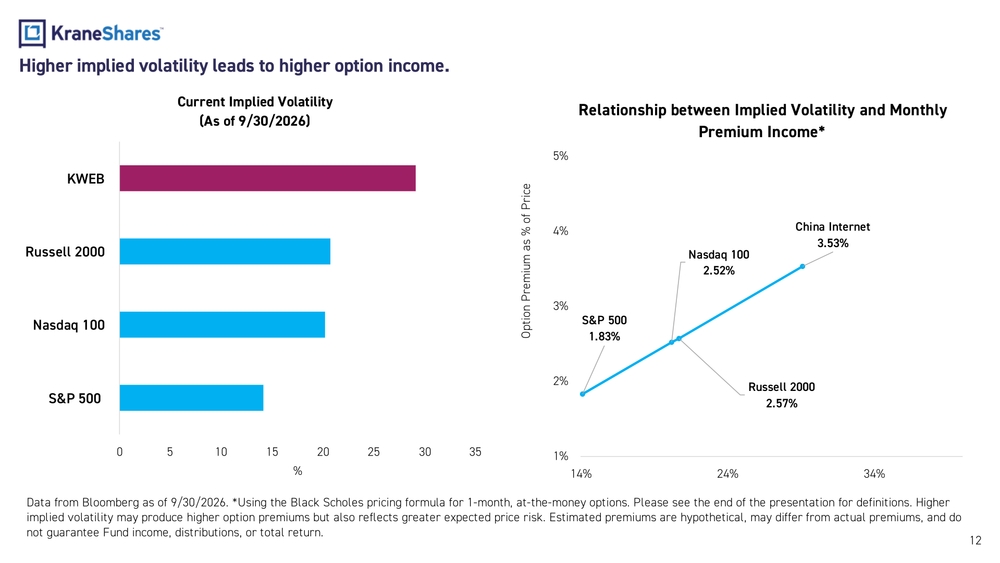
Higher implied volatility leads to higher option income. Data from Bloomberg as of 9/30/2026. Using the Black Scholes pricing formula for 1 -month, at -the-money options. Please see the end of the presentation for definitions. Higher implied volatility may produce higher option premiums but also reflects greater expected price risk. Estimated premiums are h ypothetical, may differ from actual premiums, and do not guarantee Fund income, distributions, or total return.120 5 10 15 20 25 30 35S&P 500Nasdaq 100Russell 2000KWEB %Current Implied Volatility (As of 9/30/2026) S&P 500 1.83%Nasdaq 100 2.52% Russell 2000 2.57%China Internet 3.53% 1%2%3%4%5% 14% 24% 34%Option Premium as % of PriceRelationship between Implied Volatility and Monthly Premium Income
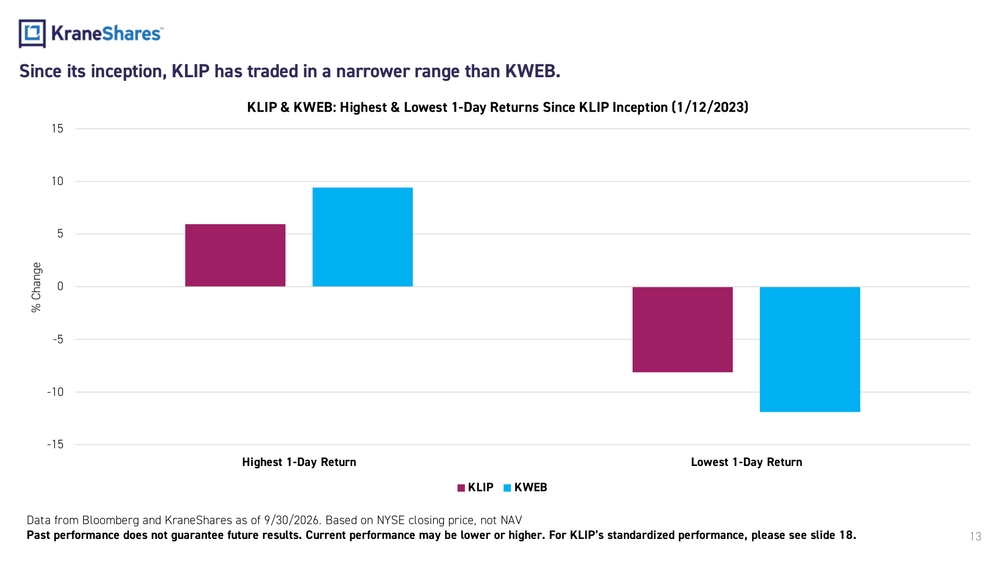
13Since its inception, KLIP has traded in a narrower range than KWEB. Data from Bloomberg and KraneShares as of 9/30/2026. Based on NYSE closing price, not NAV Past performance does not guarantee future results. Current performance may be lower or higher. For KLIP’s standardized perfo rmance, please see slide 18.-15-10-5051015 Highest 1-Day Return Lowest 1-Day Return% ChangeKLIP & KWEB: Highest & Lowest 1 -Day Returns Since KLIP Inception (1/12/2023) KLIP KWEB
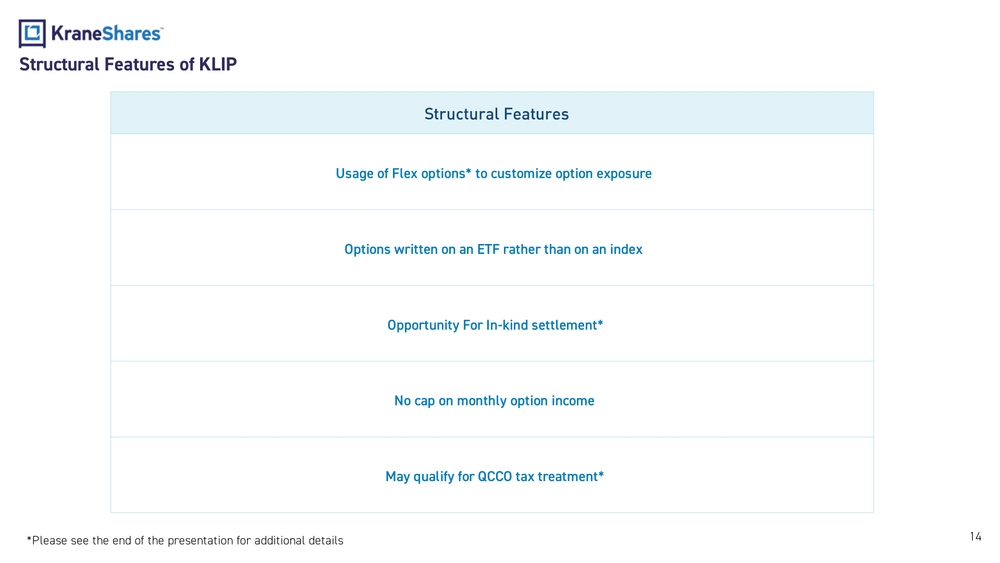
14Structural Features of KLIP Structural Features Usage of Flex options* to customize option exposure Options written on an ETF rather than on an index Opportunity For In -kind settlement* No cap on monthly option income May qualify for QCCO tax treatment* *Please see the end of the presentation for additional details
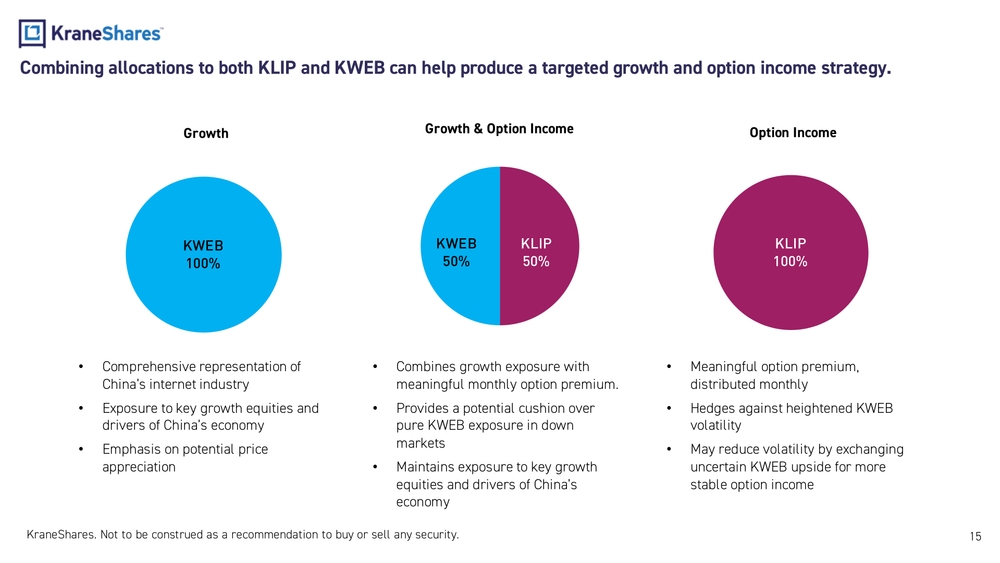
15KLIP 50%KWEB 50%Growth & Option Income KWEB 100%Growth KLIP 100%Option IncomeCombining allocations to both KLIP and KWEB can help produce a targeted growth and option income strategy. •Comprehensive representation of China’s internet industry •Exposure to key growth equities and drivers of China’s economy •Emphasis on potential price appreciation•Combines growth exposure with meaningful monthly option premium. •Provides a potential cushion over pure KWEB exposure in down markets •Maintains exposure to key growth equities and drivers of China’s economy•Meaningful option premium, distributed monthly •Hedges against heightened KWEB volatility •May reduce volatility by exchanging uncertain KWEB upside for more stable option income KraneShares. Not to be construed as a recommendation to buy or sell any security.
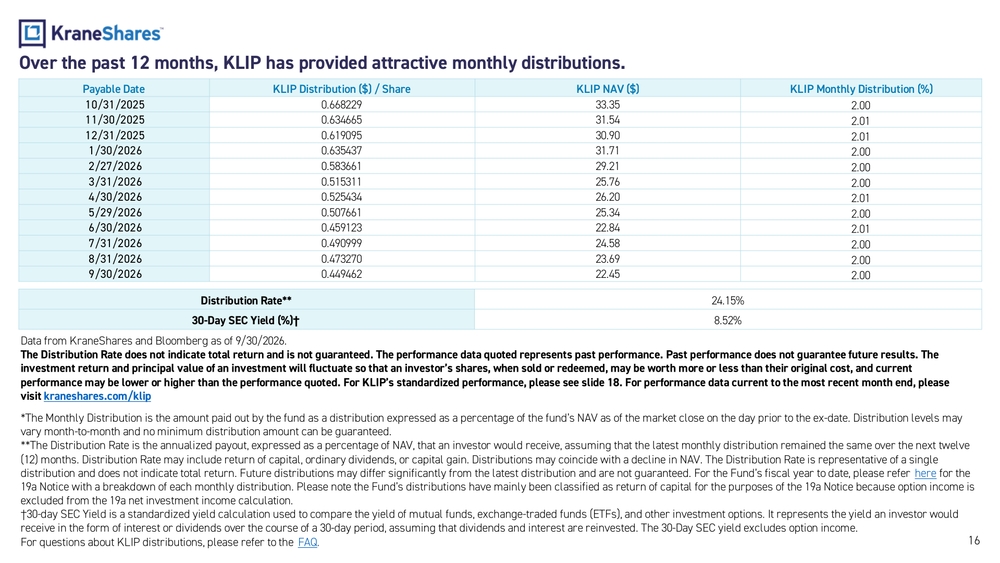
Data from KraneShares and Bloomberg as of 9/30/2026. The Distribution Rate does not indicate total return and is not guaranteed. The performance data quoted represents past perfo rmance. Past performance does not guarantee future results. The investment return and principal value of an investment will fluctuate so that an investor’s shares, when sold or redeemed, ma y be worth more or less than their original cost, and current performance may be lower or higher than the performance quoted. For KLIP’s standardized performance, please see slide 18. For performance data current to the most recent month end, please visit kraneshares.com/ klipOver the past 12 months, KLIP has provided attractive monthly distributions. Payable Date KLIP Distribution ($) / Share KLIP NAV ($) KLIP Monthly Distribution (%) 10/31/2025 0.668229 33.35 2.00 11/30/2025 0.634665 31.54 2.01 12/31/2025 0.619095 30.90 2.01 1/30/2026 0.635437 31.71 2.00 2/27/2026 0.583661 29.21 2.00 3/31/2026 0.515311 25.76 2.00 4/30/2026 0.525434 26.20 2.01 5/29/2026 0.507661 25.34 2.00 6/30/2026 0.459123 22.84 2.01 7/31/2026 0.490999 24.58 2.00 8/31/2026 0.473270 23.69 2.00 9/30/2026 0.449462 22.45 2.00 *The Monthly Distribution is the amount paid out by the fund as a distribution expressed as a percentage of the fund’s NAV as of the market close on the day prior to the ex -date. Distribution levels may vary month -to-month and no minimum distribution amount can be guaranteed. The Distribution Rate is the annualized payout, expressed as a percentage of NAV, that an investor would receive, assuming that the latest monthly distribution remained the same over the next twelve (12) months. Distribution Rate may include return of capital, ordinary dividends, or capital gain. Distributions may coincide with a decline in NAV. The Distribution Rate is representative of a single distribution and does not indicate total return. Future distributions may differ significantly from the latest distribution a nd are not guaranteed. For the Fund’s fiscal year to date, please refer here for the 19a Notice with a breakdown of each monthly distribution. Please note the Fund’s distributions have mainly been classified as return of capital for the purposes of the 19a Notice because option income is excluded from the 19a net investment income calculation. †30-day SEC Yield is a standardized yield calculation used to compare the yield of mutual funds, exchange -traded funds (ETFs), an d other investment options. It represents the yield an investor would receive in the form of interest or dividends over the course of a 30 -day period, assuming that dividends and interest are reinve sted. The 30 -Day SEC yield excludes option income. For questions about KLIP distributions, please refer to the FAQ.Distribution Rate 24.15% 30-Day SEC Yield (%)† 8.52% 16
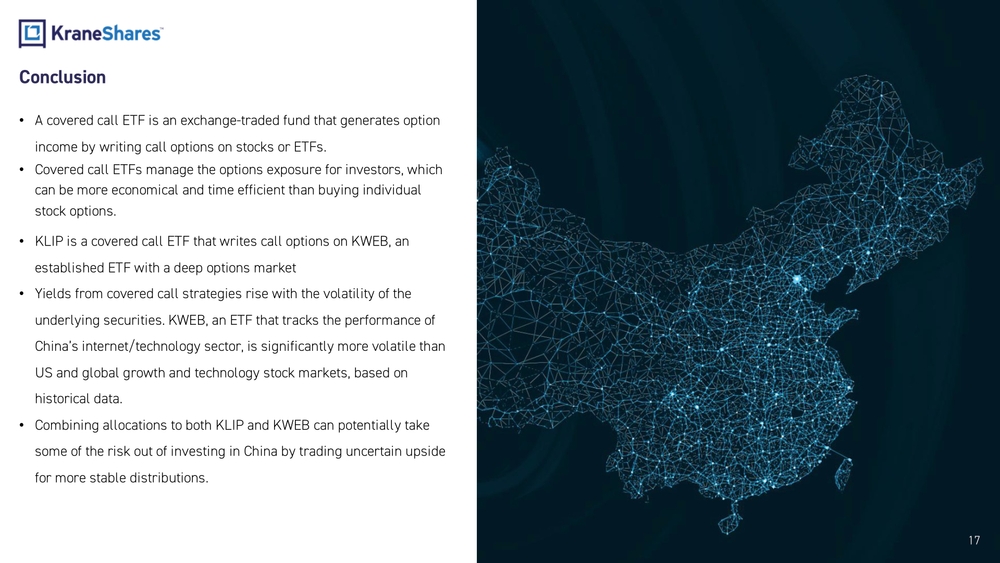
17•A covered call ETF is an exchange -traded fund that generates option income by writing call options on stocks or ETFs. •Covered call ETFs manage the options exposure for investors, which can be more economical and time efficient than buying individual stock options. •KLIP is a covered call ETF that writes call options on KWEB, an established ETF with a deep options market •Yields from covered call strategies rise with the volatility of the underlying securities. KWEB, an ETF that tracks the performance of China’s internet/technology sector, is significantly more volatile than US and global growth and technology stock markets, based on historical data. •Combining allocations to both KLIP and KWEB can potentially take some of the risk out of investing in China by trading uncertain upside for more stable distributions.Conclusion 17
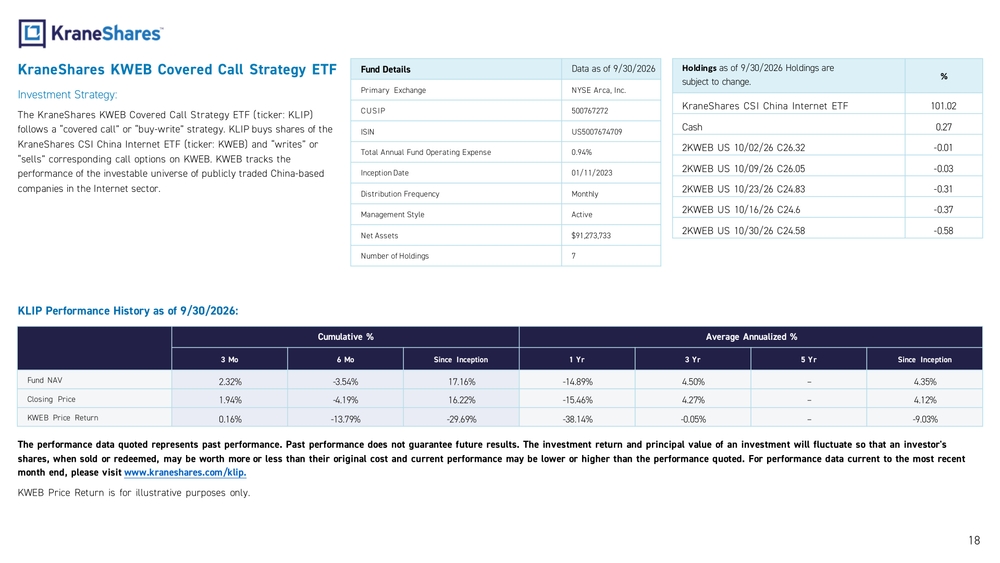
KraneShares KWEB Covered Call Strategy ETF Investment Strategy: TheKraneShares KWEB Covered Call Strategy ETF (ticker: KLIP) follows a“covered call” or“buy-write” strategy. KLIP buys shares ofthe KraneShares CSIChina Internet ETF (ticker: KWEB) and“writes” or “sells” corresponding calloptions onKWEB. KWEB tracks the performance oftheinvestable universe ofpublicly traded China -based companies intheInternet sector.Fund Details Data as of 9/30/2026 Primary Exchange NYSE Arca, Inc. CUSIP 500767272 ISIN US5007674709 Total Annual Fund Operating Expense 0.94% Inception Date 01/11/2023 Distribution Frequency Monthly Management Style Active NetAssets $91,273,733 Number ofHoldings 7Holdings asof9/30/202 6Holdings are subject tochange.% KraneShares CSI China Internet ETF 101.02 Cash 0.27 2KWEB US 10/02/26 C26.32 -0.01 2KWEB US 10/09/26 C26.05 -0.03 2KWEB US 10/23/26 C24.83 -0.31 2KWEB US 10/16/26 C24.6 -0.37 2KWEB US 10/30/26 C24.58 -0.58 KLIP Performance History asof9/30/202 6: Cumulative % Average Annualized % 3Mo 6Mo Since Inception 1Yr 3Yr 5Yr Since Inception Fund NAV 2.32% -3.54% 17.16% -14.89% 4.50% – 4.35% Closing Price 1.94% -4.19% 16.22% -15.46% 4.27% – 4.12% KWEB Price Return 0.16% -13.79% -29.69% -38.14% -0.05% – -9.03% Theperformance data quoted represents past performance. Past performance does notguarantee future results. The investment return andprincipal value ofaninvestment will fluctuate sothat aninvestor 's shares, when sold orredeemed, may beworth more orless than their original cost andcurrent performance may belower orhigher than theperformance quoted. Forperformance data current tothemost recent month end, please visit www.kraneshares.com/klip. KWEB Price Return isforillustrative purposes only. 18
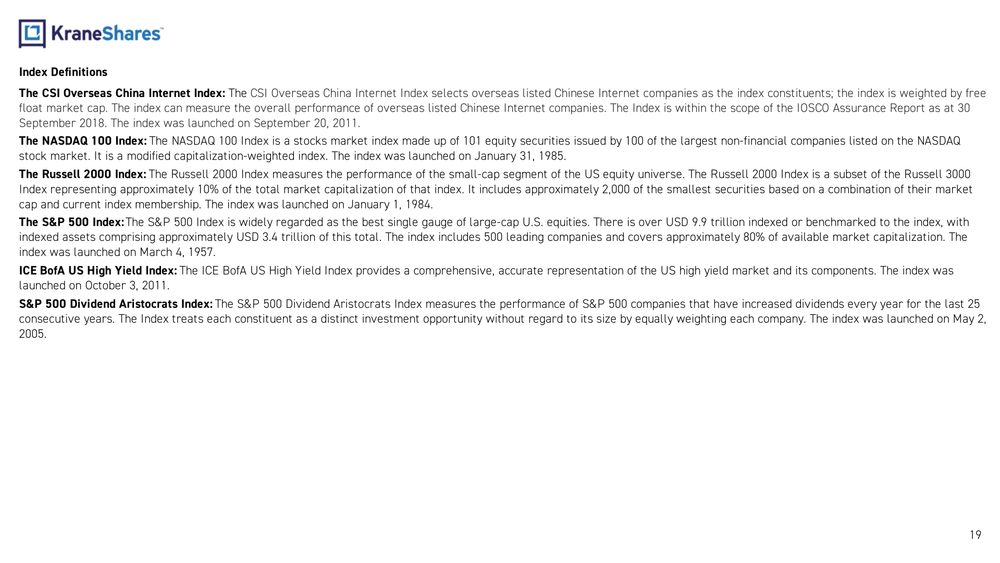
19Index Definitions The CSI Overseas China Internet Index: The CSI Overseas China Internet Index selects overseas listed Chinese Internet companies as the index constituents; the index is weighted by free float market cap. The index can measure the overall performance of overseas listed Chinese Internet companies. The Index is w ithin the scope of the IOSCO Assurance Report as at 30 September 2018. The index was launched on September 20, 2011. The NASDAQ 100 Index: The NASDAQ 100 Index is a stocks market index made up of 101 equity securities issued by 100 of the largest non -financial compan ies listed on the NASDAQ stock market. It is a modified capitalization -weighted index. The index was launched on January 31, 1985. The Russell 2000 Index: The Russell 2000 Index measures the performance of the small -cap segment of the US equity universe. The Russell 2000 Index is a subset of the Russell 3 000 Index representing approximately 10% of the total market capitalization of that index. It includes approximately 2,000 of the smallest securities based on a combination of their market cap and current index membership. The index was launched on January 1, 1984. The S&P 500 Index: The S&P 500 Index is widely regarded as the best single gauge of large -cap U.S. equities. There is over USD 9.9 trillion indexed or benchmarked to the index, with indexed assets comprising approximately USD 3.4 trillion of this total. The index includes 500 leading companies and covers a pproximately 80% of available market capitalization. The index was launched on March 4, 1957. ICE BofA US High Yield Index: The ICE BofA US High Yield Index provides a comprehensive, accurate representation of the US high yield market and its components. The ind ex was launched on October 3, 2011. S&P 500 Dividend Aristocrats Index: The S&P 500 Dividend Aristocrats Index measures the performance of S&P 500 companies that have increased dividends every year for the last 25 consecutive years. The Index treats each constituent as a distinct investment opportunity without regard to its size by equal ly weighting each company. The index was launched on May 2, 2005.
20Term Definitions Volatility: The degree of variation of a trading price series over time as measured by the standard deviation of returns. Standard deviati on is a quantity calculated to measure the extent of deviation for a group as a whole. A low standard deviation indicates that the data points tend to be closer to the mean (a lso called the expected value) of the set, while a high standard deviation indicates that the data points are spread out over a wider range of values. Implied Volatility: The future volatility that the market is pricing in currently. Implied volatility is based on option prices in the open marke t and is a key feature in the Black Scholes option pricing model. Realized Volatility: The actual volatility, or standard deviation, of a security based on historical data over some time period. Option Income: The cost of an option relative to the price of the underl ying security. Option income rises with volatility. Strike Price : The price at which an option can be exercised. Black Scholes: The Black -Scholes model is the mathematical equation that estimates the theoretical value of derivatives based on other investme nt instruments, considering the impact of time and other risk factors. Since being developed in 1973, the model continues to be regarded as one of the best ways to price options contracts. Flex Options: Customized equity contracts that allow investors to tailor contract terms and enjoy expanded position limits for exchange -listed equity and index options. In this case, the use of flex options ensures that the calls that KLIP sells cannot be exercised before expiration at month -end. In-Kind Settlement: Settlement that involves payment for services with something other than cash or legal tender, in this case ETF shares. Settle ment in-kind is beneficial because there is no need for a liquidity event, i.e. selling ETF shares for cash to settle the transaction. QCCO Treatment: Qualified covered call option (QCCO) treatment is a tax treatment that allows certain ETFs to receive more favorable tax trea tment on the option income generated from selling call options. To qualify for QCCO treatment, an ETF must meet several requirements: The ETF must be organized as a regulated investment company (RIC) under the Internal Revenue Code. The ETF must hold the underlying securities that are the subject of the call option for at least 45 da ys before and after the date on which the call option was written. The ETF must hold the call option until it is either exercised or expires. The call option must be written on securi ties that are either held by the ETF or are readily convertible into securities that the ETF holds. The ETF must receive option income for selling the call options that are not more than 33 1/3% of the sum of the option income and any interest and dividends earned during the period the option is held. If an ETF meets these requirements, any option income generated from s elling call options will be taxed at the long -term capital gains rate, which is generally lower than the ordinary income tax rate.
21Important Notes: This material must be preceded or accompanied by a current prospectus . Investors should read it carefully before investing or sending money. Risk Disclosures: Investing involves risk, including possible loss ofprincipal. There canbenoassurance that aFund willachieve itsstated objectives. Indices areunmanaged anddonotinclude theeffect offees. One cannot invest directly inanindex. This information should notberelied upon asresearch, investment advice, orarecommendation regarding anyproducts, strategies, oranysecurity inparticular. This material isstrictly for illustrative, educational, orinformational purposes andis subject tochange. Certain content represents anassessment ofthemarket environment ataspecific time andisnotintended tobea forecast offuture events oraguarantee offuture results; material isasofthedates noted andissubject tochange without notice. Bywriting covered calloptions inreturn forthereceipt of option income ,theFund willgive uptheopportunity tobenefit from potential increases inthevalue oftheIndex above theexercise prices ofsuch options, butwillcontinue tobear theriskofdeclines inthevalue oftheIndex. Theoption income received from theoptions may notbesufficient tooffset anylosses sustained from the volatility oftheunderlying stocks over time. Asaresult, therisks associated with writing covered calloptions may besimilar totherisks associated with writing putoptions. Inaddition, theFund’s ability tosellthesecurities underlying theoptions willbelimited while theoptions areineffect unless theFund cancels outtheoption positions through thepurchase of offsetting identical options prior totheexpiration ofthewritten options. Asthewriter ofacalloption, theFund may notbeable tocontrol thetime when itmay berequired tofulfill itsobligation tothepurchaser oftheoption; however, theterms ofthe FLEX options written bytheFund willmake them exercisable only ontheir expiration date. Exchanges may suspend thetrading ofoptions involatile markets. Iftrading is suspended, theFund may beunable towrite options attimes that may be desirable oradvantageous todoso.Option income theFund receives from writing calloptions willresult inshort -term capital gains andwillbedistributed asordinary income. Asaresult, asignificant portion ofdistributions could betaxed ateffective rates higher than those that would apply iftheFund engaged in adifferent investment strategy. TheFund may invest inderivatives, which areoften more volatile than other investments andmay magnify theFund’s gains orlosses. Aderivative (i.e., futures/forward contracts, swaps, and options) isacontract that derives itsvalue from the performance ofanunderlying asset. Theprimary riskofderivatives isthat changes intheasset’s market value andthederivative may notbe proportionate, andsome derivatives canhave thepotential forunlimited losses. Derivatives arealso subject toliquidity andcounterparty risk. TheFund issubject toliquidity risk, meaning that certain investments may become difficult topurchase orsellatareasonable time andprice. Ifatransaction forthese securities islarge, itmay notbepossible to initiate, which may cause theFund tosuffer losses. Counterparty riskistheriskofloss intheevent that thecounterparty toanagreement fails tomake required payments orotherwise comply with theterms ofthederivative.
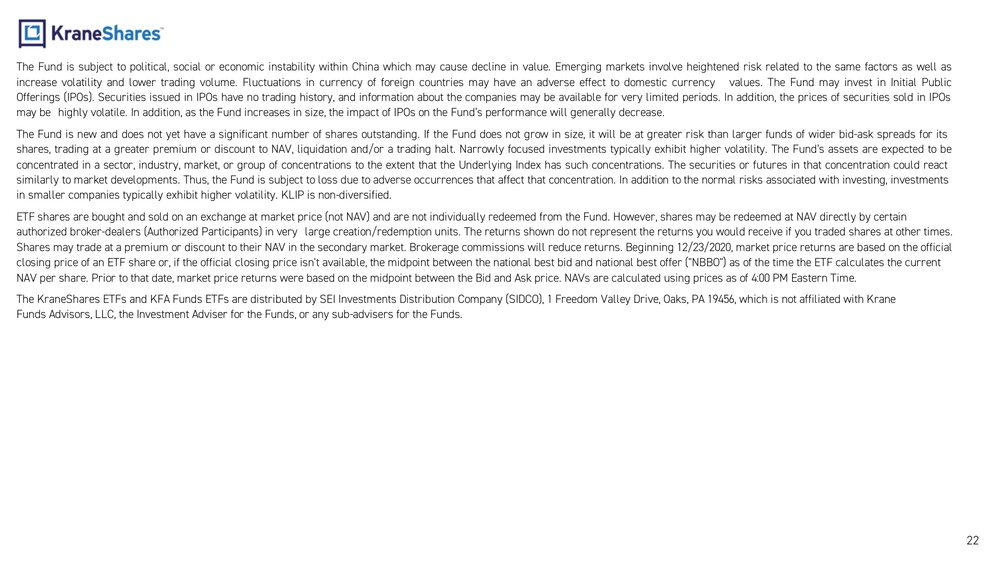
22The Fund is subject to political, social or economic instability within China which may cause decline in value . Emerging markets involve heightened risk related to the same factors as well as increase volatility and lower trading volume . Fluctuations in currency of foreign countries may have an adverse effect to domestic currency values . The Fund may invest in Initial Public Offerings (IPOs) . Securities issued in IPOs have no trading history, and information about the companies may be available for very limited periods . In addition, the prices of securities sold in IPOs may be highly volatile . In addition, as the Fund increases in size, the impact of IPOs on the Fund’s performance will generally decrease . The Fund is new and does not yet have a significant number of shares outstanding . If the Fund does not grow in size, it will be at greater risk than larger funds of wider bid-ask spreads for its shares, trading at a greater premium or discount to NAV, liquidation and/or a trading halt. Narrowly focused investments typically exhibit higher volatility . The Fund’s assets are expected to be concentrated in a sector, industry, market, or group of concentrations to the extent that the Underlying Index has such concentrations . The securities or futures in that concentration could react similarly to market developments . Thus, the Fund is subject to loss due to adverse occurrences that affect that concentration . In addition to the normal risks associated with investing, investments in smaller companies typically exhibit higher volatility . KLIP is non-diversified . ETF shares are bought and sold on an exchange at market price (not NAV) and are not individually redeemed from the Fund. However, shares may be redeemed at NAV directly by certain authorized broker -dealers (Authorized Participants) in very large creation/redemption units. The returns shown do not represent the returns you would receive if you traded shares at other times. Shares may trade at a premium or discount to their NAV in the secondary market. Brokerage commissions will reduce returns. Beginning 12/23/2020, market price returns are based on the official closing price of an ETF share or, if the official closing price isn't available, the midpoint between the national best bid and national best offer ("NBBO") as of the time the ETF calculates the current NAV per share. Prior to that date, market price returns were based on the midpoint between the Bid and Ask price. NAVs are calculated using prices as of 4:00 PM Eastern Time. The KraneShares ETFs and KFA Funds ETFs are distributed by SEI Investments Distribution Company (SIDCO), 1 Freedom Valley Drive, Oaks, PA 19456, which is not affiliated with Krane Funds Advisors, LLC, the Investment Adviser for the Funds, or any sub-advisers for the Funds.