2025_08_msci_white_paper
by Kraneshares
Capturing the Growth of Venture -Backed Companies
INSIGHTS IN ACTION August 2025
© 2025 MSCI Inc. All rights reserved. Please refer to the disclaimer at the end of this document.
msci.com 2 © 2025 MSCI Inc. All rights reserved. Please refer to the disclaimer at the end of this document.
Capturing the Growth of Venture -Backed Companies | August 2025
Authors
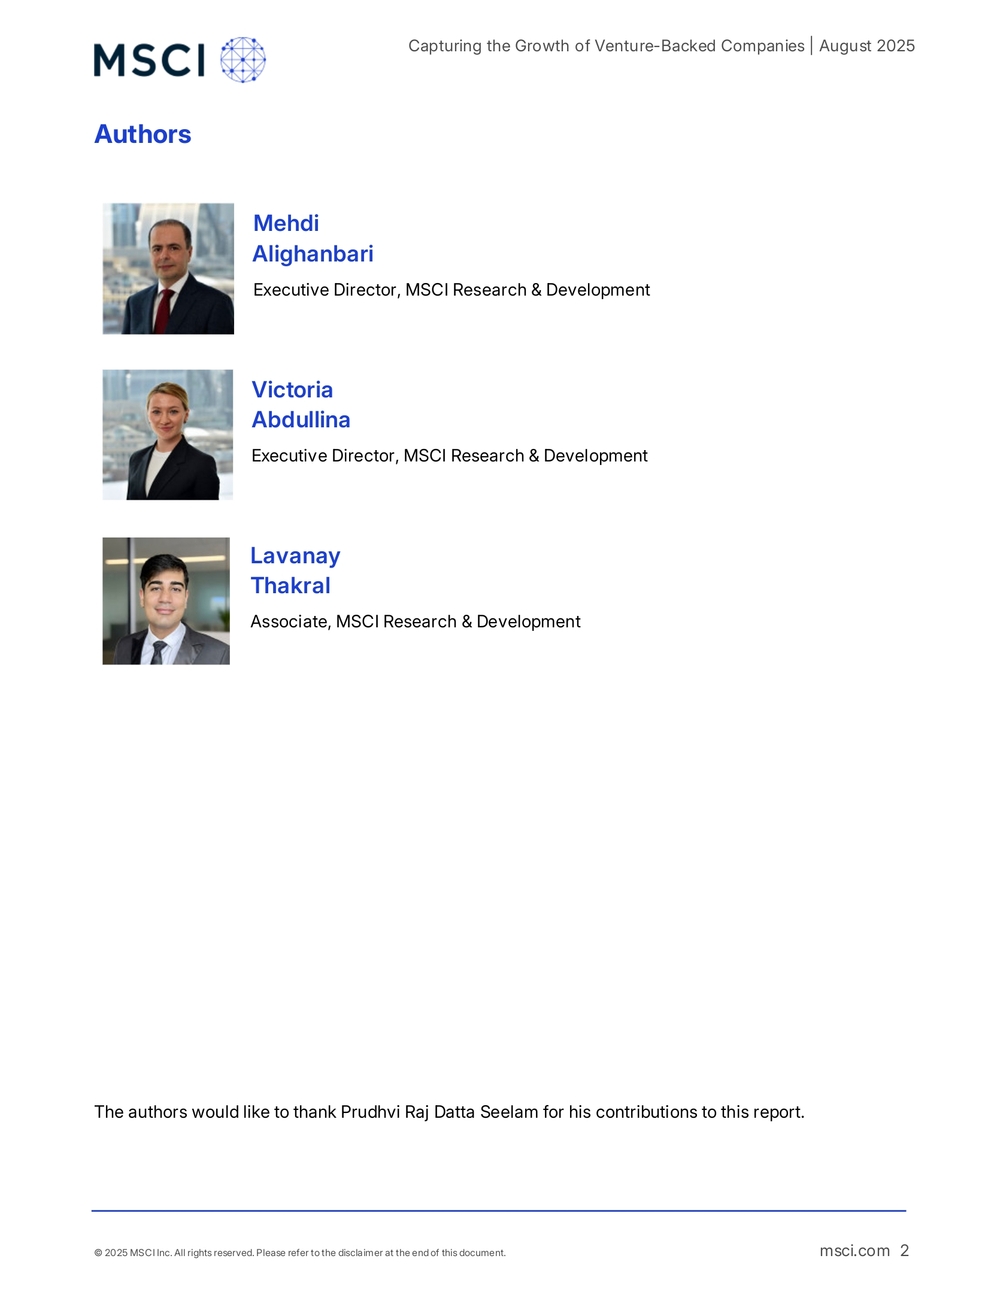
The authors would like to thank Prudhvi Raj Datta Seelam for his contributions to this report. Mehdi Alighanbari Executive Director, MSCI Research & Development
Victoria Abdu llina Executive Director, MSCI Research & Development
Lavanay Thak ral Associate, MSCI Research & Development
msci.com 3 © 2025 MSCI Inc. All rights reserved. Please refer to the disclaimer at the end of this document.
Capturing the Growth of Venture -Backed Companies | August 2025
Contents
Executive summary ............................................................................................................... 4 VC market structure .............................................................................................................. 5 Private companies are drivers of innovation .................................................................................... 5 Companies are spending more time “in private” ............................................................................. 6 Introducing the MSCI Venture -Backed Private Company Indexes .................................... 8 Construction of the indexes ................................................................................................................ 8 Sourcing of representative share prices ........................................................................................... 8 Liquidity is key ........................................................................................................................................ 8 Investability and tradability .................................................................................................................. 9 Breadth and weighting considerations .............................................................................................. 9 Evergreen and vintage varieties ......................................................................................................... 9 Top 50 Index characteristics ............................................................................................................. 10 Measuring performance ..................................................................................................................... 12 Long -term VC performance .............................................................................................................. 12 Conclusion ............................................................................................................................ 13
msci.com 4 © 2025 MSCI Inc. All rights reserved. Please refer to the disclaimer at the end of this document.
Capturing the Growth of Venture -Backed Companies | August 2025
Executive summary
Venture capital (VC) -backed companies have emerged as pivotal drivers of innovation and economic transformation, especially in high -growth sectors like artificial intelligence and space exploration. However, the trend of companies remaining private longer has limited public market investors' ability to participate in this value creation. Addressing this gap, MSCI has launched a new suite of indexes to track the performance of venture- backed private companies using secondary -market data.
The MSCI All Country Venture -Backed Private Company Indexes bring transparency and structure to an otherwise opaque asset class. These indexes leverage data from brokers and platforms specializing in secondary -market transactions to ensure representativeness and liquidity. Index eligibility requires transaction activity, confirmed bids and asks and demonstrable pricing data, providing a robust foundation for benchmarking and for use in creating investment solutions. The flagship MSCI All Country Venture -Backed Private Company Top 50 Index comprises the largest 50 venture -backed companies by estimated market capitalization, weighted accordingly. It is dominated by the information technology sector (45%) and more than three -quarters of its constituents are U.S. - based, highlighting the country’s leadership in the VC ecosystem. Since its inception in March 2023, the Top 50 Index has delivered a 40% annualized return , outperforming most global public -equity benchmarks.
The MSCI All Country Venture -Backed Private Company Indexes provide a way for investors to access, benchmark and evaluate venture -backed opportunities. In doing so, it bridges a longstanding divide between public and private markets, enabling broader participation in the innovation economy.
msci.com 5 © 2025 MSCI Inc. All rights reserved. Please refer to the disclaimer at the end of this document.
Capturing the Growth of Venture -Backed Companies | August 2025
VC market structure The VC market is a key component of financial markets that generally provid es funding and support to early -stage companies with high growth potential. VC investors often invest in startups and emerging businesses, often in exchange for equity stakes , to finance growth plans. Such investments are typically higher risk than public equities, but can yield substantial returns if the companies succeed.
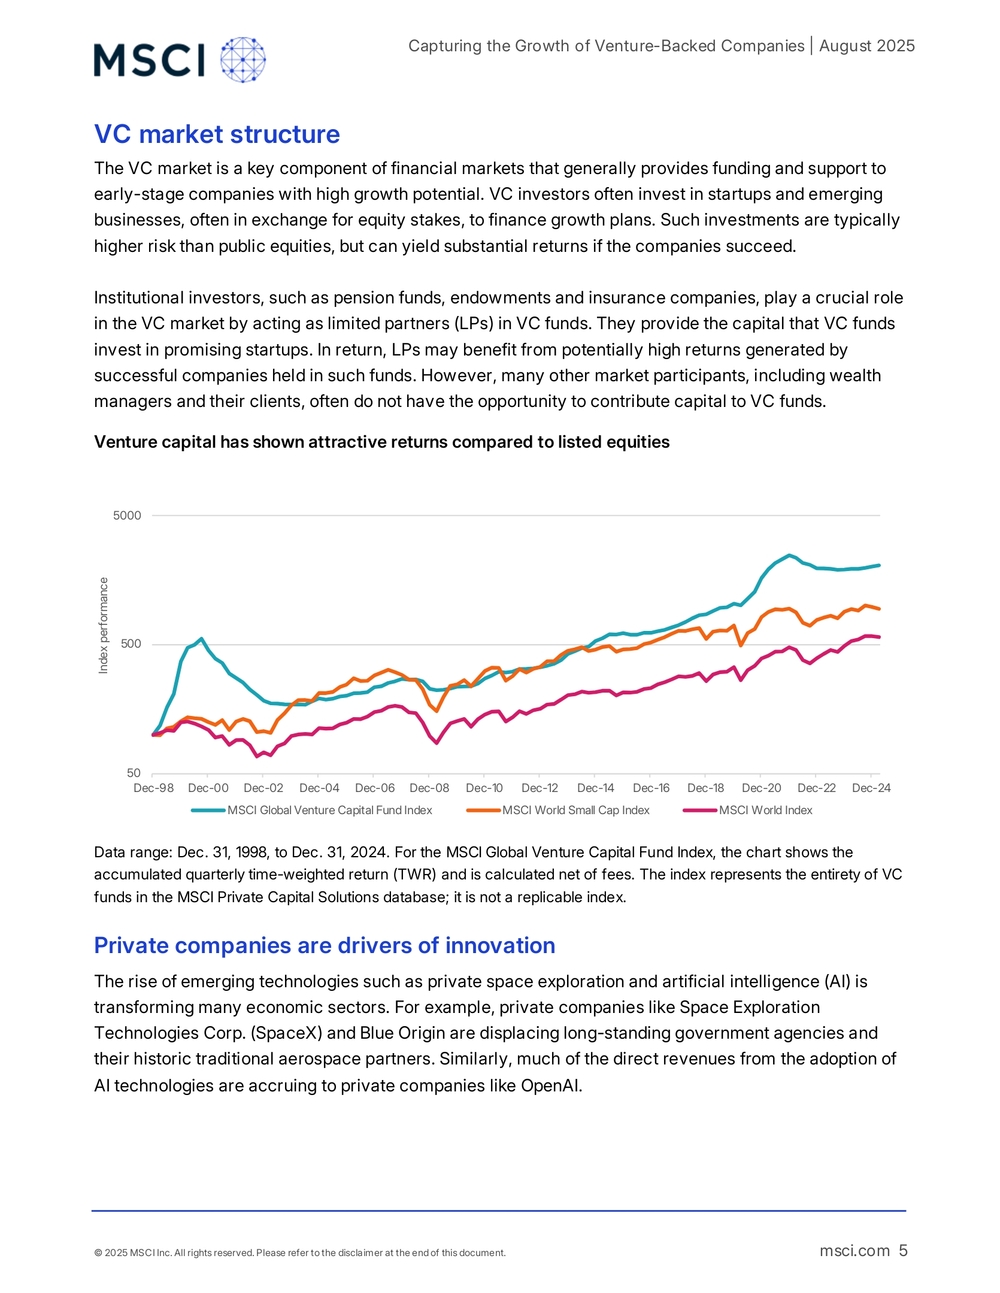
Institutional investors, such as pension funds, endowments and insurance companies, play a crucial role in the VC market by acting as limited partners (LPs) in VC funds . They provide the capital that VC funds invest in promising startups. In return, LPs may benefit from potential ly high returns generated by successful companies held in such funds. However, many other market participants, including wealth managers and their clients , often do not have the opportunity to contribute capital to VC funds. Venture capital has shown attractive returns compared to listed equities
Data range: Dec. 31, 1998, to Dec. 31, 2024. For the MSCI Global Venture Capital Fund Index, the chart shows the accumulated quarterly time -weighted return (TWR) and is calculated net of fees. The index represents the entirety of VC funds in the MSCI Private Capital Solutions database; it is not a replicable index. Private companies are drivers of i nnovation The rise of emerging technologies such as private space exploration and artificial intelligence (AI) is transforming many economic sectors . For example, pr ivate companies like Space Exploration Technologies Corp. (SpaceX) and Blue Origin are displacing long -standing government agencies and their historic traditional aerospace partners . Similarly, much of the direct revenues from the adoption of AI technologies are accruing to private companies like OpenAI . 505005000 Dec-98 Dec-00 Dec-02 Dec-04 Dec-06 Dec-08 Dec-10 Dec-12 Dec-14 Dec-16 Dec-18 Dec-20 Dec-22 Dec-24Index performance MSCI Global Venture Capital Fund Index MSCI World Small Cap Index MSCI World Index
msci.com 6 © 2025 MSCI Inc. All rights reserved. Please refer to the disclaimer at the end of this document.
Capturing the Growth of Venture -Backed Companies | August 2025
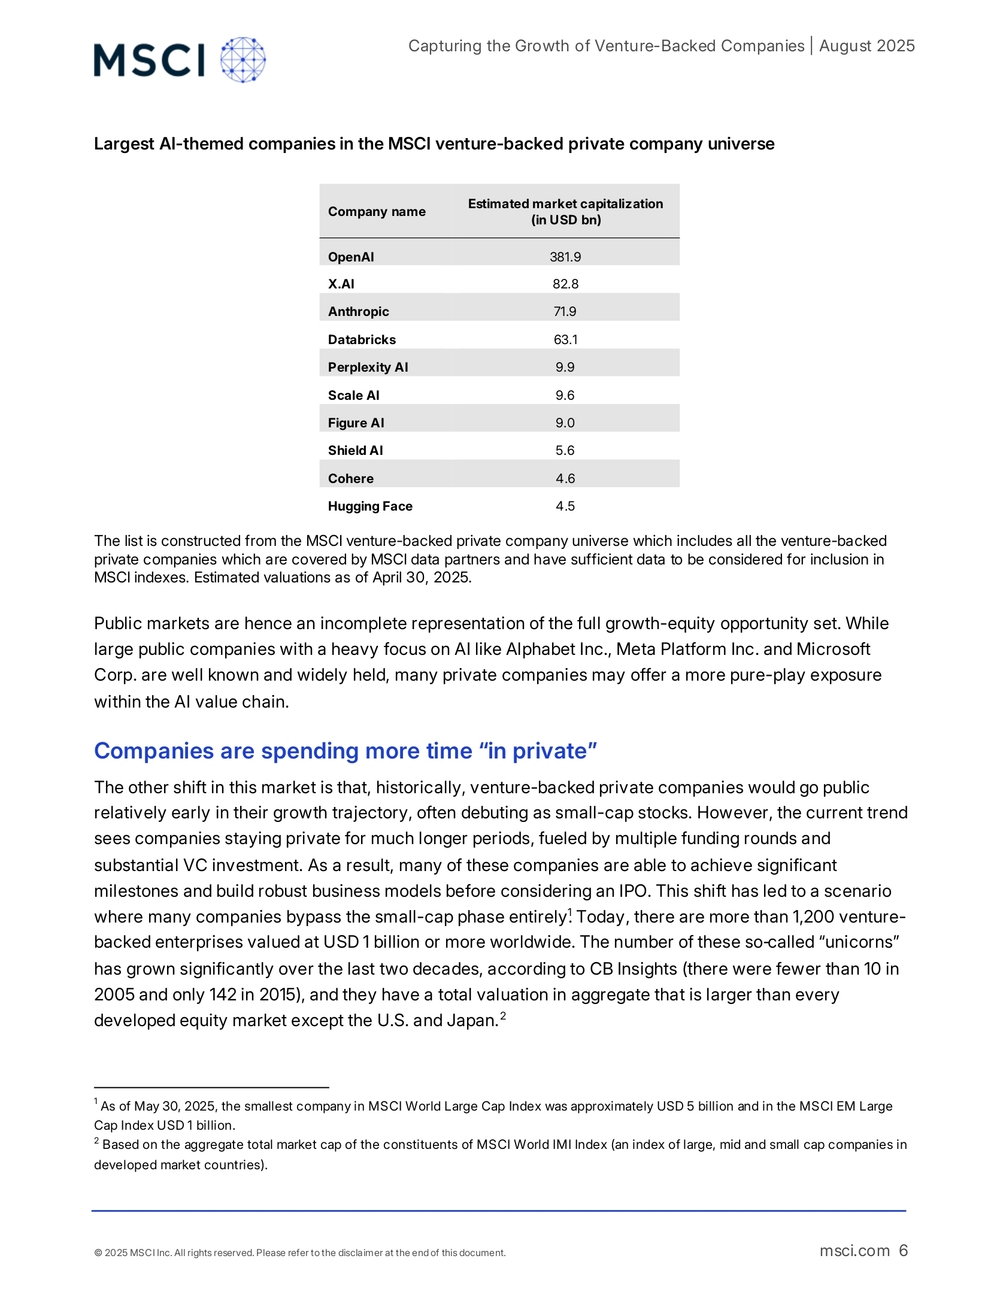
Largest AI -themed companies in the MSCI venture -backed private company universe
Company n ame Estimated m arket c apitalization (in USD bn ) OpenAI 381.9 X.AI 82.8 Anthropic 71.9 Databricks 63.1 Perplexity AI 9.9 Scale AI 9.6 Figure AI 9.0 Shield AI 5.6 Cohere 4.6 Hugging Face 4.5
The list is constructed from the MSCI venture -backed private company universe which includes all the venture -backed private companies which are covered by MSCI data partners and have sufficient data to be considered for inclusion in MSCI indexes. Estimated valuations as of April 30, 2025.
Public markets are hence an incomplete representation of the full growth -equity opportunity set. While large public companies with a heavy focus on AI like Alphabet Inc., Meta Platform Inc. and Microsoft Corp. are well known and widely held, many private companies may offer a more pure -play exposure within the AI value chain. Companies are spending more time “in private” The other shift in this market is that, h istorically, venture- backed private companies would go public relatively early in their growth trajectory, often debuting as small -cap stocks. However, the current trend sees companies staying private for much longer periods, fueled by multiple funding rounds and substantial VC investment. As a result, many of these companies are able to achieve significant milestones and build robust business models before considering an IPO. This shift has led to a scenario where many companies bypass the small -cap phase entirely.1 Today, there are more than 1,200 venture - backed enterprises valued at USD 1 billion or more worldwide . The number of these so -called “unicorns” has grown significantly over the last two decades , according to CB Insights (there were fewer than 10 in 2005 and only 142 in 2015 ), and they have a total valuation in aggregate that is larger than every developed equity market except the U.S. and Japan.2
1 As of May 30, 2025, the smallest company in MSCI World Large Cap Index was approximately USD 5 b illion and in the MSCI EM Large Cap Index USD 1 billion. 2 Based on the aggregate total market cap of the constituents of MSCI World IMI Index (an index of large, mid and small cap companies in developed market countries).
msci.com 7 © 2025 MSCI Inc. All rights reserved. Please refer to the disclaimer at the end of this document.
Capturing the Growth of Venture -Backed Companies | August 2025
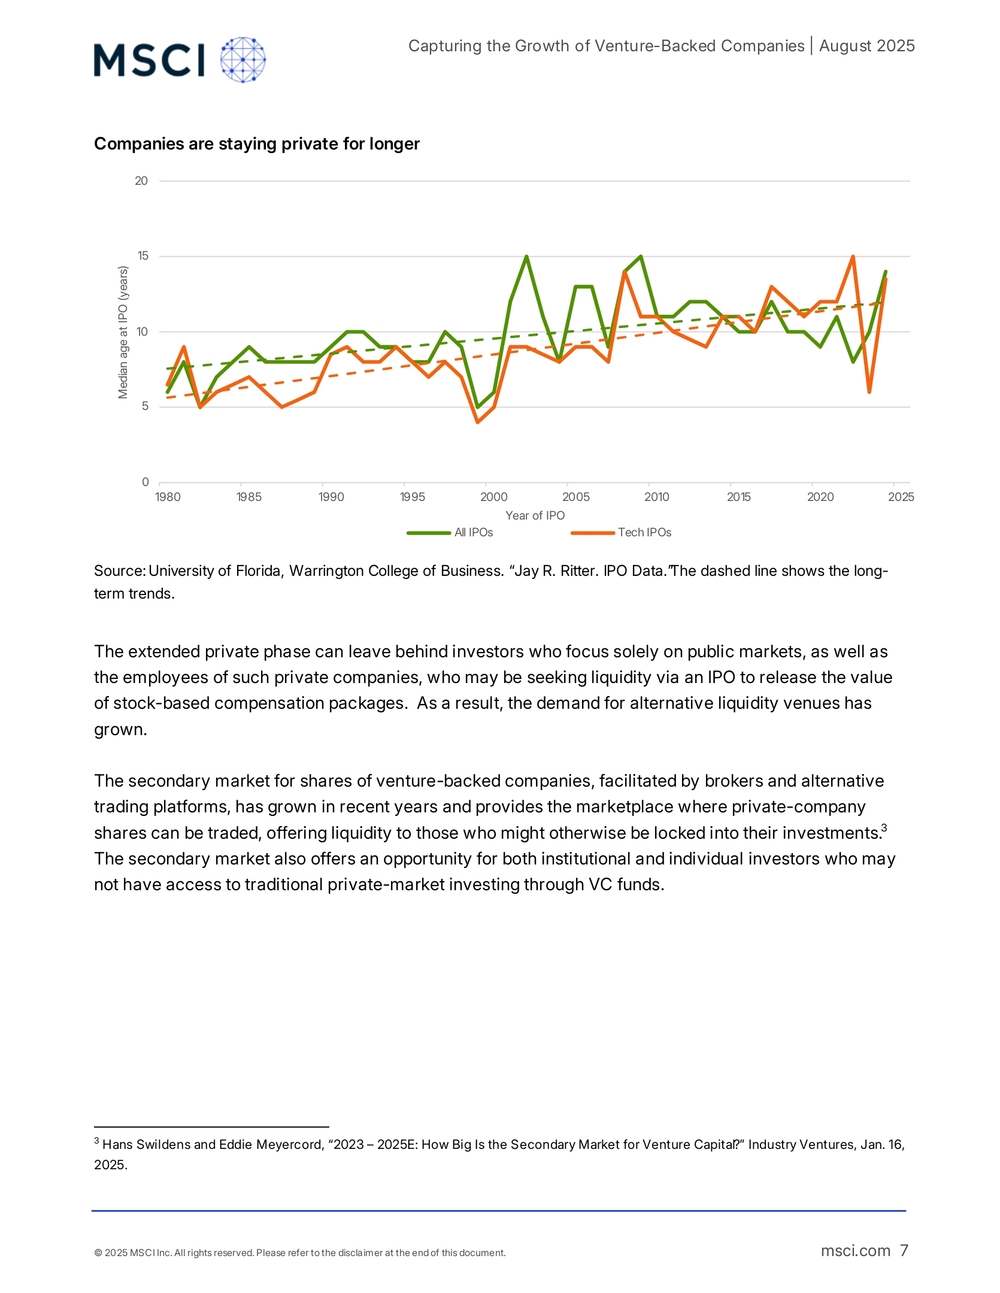
Companies are staying private for longer
Source: University of Florida, Warrington College of Business. “Jay R. Ritter. IPO Data.” The dashed line shows the long - term trends.
The extended private phase can leave behind investors who focus solely on public markets, as well as the employees of such private companies, who may be seeking liquidity via an IPO to release the value of stock- based compensation packages . As a result , the demand for alternative liquidity venues has grown .
The secondary market for shares of venture -backed companies , facilitated by brokers and alternative trading platforms, has grown in recent years and provides the marketplace where private- company shares can be traded, offering liquidity to those who might otherwise be locked into their investments.3 The secondary market also offer s an opportunity for both institutional and individual investors who may not have access to traditional private -market investing through VC funds.
3 Hans Swildens and Eddie Meyercord, “2023 – 2025E: How Big Is the Secondary Market for Venture Capital ?” Industry Ventures, Jan. 16, 2025. 05101520 1980 1985 1990 1995 2000 2005 2010 2015 2020 2025Median age at IPO (years) Year of IPO All IPOs Tech IPOs
msci.com 8 © 2025 MSCI Inc. All rights reserved. Please refer to the disclaimer at the end of this document.
Capturing the Growth of Venture -Backed Companies | August 2025
Introducing the MSCI Venture-Backed Private Company Indexes
Indexes tracking the performance of th e VC asset class have been around for some time. The history for the MSCI Global Venture Capital Fund Index, for example, begins in the 1970s.4 The material growth in secondary markets for venture -backed companies and the availability of secondary -market transaction data, however, is a relatively new phenomenon. This expansion points to the growing need for standardization within this marketplace , including more reliable data, transparency, and different types of benchmarks .
The MSCI All Country Venture -Backed Private Company Indexes are designed to bring more transparency to the opaque market for venture -backed private- company stock, while increasing standardization in this market segment. Construction of the index es Sourcing of representative share prices For index construction, the sourcing of robust, reliable and representative secondary -market prices and corporate -events data is critical. MSCI sources data from two specialist firms focused on secondary - market data collection for transactions related to venture -backed private companies: Caplight and PM Insights. Both firms operate broker -contributor networks to collect and analyze indications of interest (IOIs) and closed transaction information across a broad cross -section of secondary -market participants in the venture- backed private- company market .5 Liquidity is key When it comes to purchasing shares in the secondary market, the number of companies realistically available is only a fraction of the 1,200 unicorns referenced above. That is, liquidity remains concentrated in a small subset. While the secondary market is growing in both the volume and types of companies, investors looking to source investments today are likely limited to fewer than 100 compan ies.
An index, whether designed to represent the market’s performance and value, or as the reference for a financial product, should have constituents drawn from the most liquid part of the market where the prices are most representative of the current clearing price of the companies. Additionally, more liquidity with such constituents offer s investors the best opportunity to access shares using the secondary - market trading platforms or brokers near such share -price levels.
4 The MSCI Global Venture Capital Fund Index included around 450 funds as of December 1998. This number increased to more than 2,000 by the end of 2024. 5 The evaluated prices are directly sourced f rom MSCI data partners. The inputs to the pricing models include VC funding rounds, secondary -market closed trades, secondary -market bid and ask orders, price events as well as public comparables.
msci.com 9 © 2025 MSCI Inc. All rights reserved. Please refer to the disclaimer at the end of this document.
Capturing the Growth of Venture -Backed Companies | August 2025
Investability and tradability To support the represent ativeness and liquidity of the index es and the underlying components, MSCI applies filter s to the universe of available companies based on trading activity in the secondary markets.
We designed these filters so as not to be too restrictive and they are applied to ensure that there have been confirmed transactions and indications of interest (both bids and asks) in recent history. While trading volumes are high er for many of the larger high -profile venture -backed companies, a comprehensive view of all trades for any one company is not available due to the fragmented nature of the secondary market . There is no centralized exchange, and secondary -market trading platforms observe only a fraction of the actual trades. Furthermore , shares trade over -the-counter between institutional brokers who are not obligated to report the transactions to any central source or regulatory authority.
In our index methodolog ies, all the constituents need to have sellers, buyers and completed transactions. Direct trades and trades through special purpose vehicles (SPVs) are acceptable as completed transactions as they reasonably represent that the ownership interest in a private- company share has changed hands. While forward trades are sometimes used in the secondary market , MSCI does not consider these as sufficiently reliable indication s of completed transactions . These trades are ineligible and not considered in MSCI’s assessment of a company’s trading activity. Breadth and weighting considerations The level of diversification both in terms of the number of names in an index and their weights are important factors to consider . A larger number of constituents may better represent the broad er venture - backed company market but will come at the cost of liquidity. A market -capitalization -weighted index may offer better capacity and liquidity but may also suffer from concentration in a small number of companies.6 Capping the weights , or moving to an equal -weighted approach , reduce s the concentration of an index. Evergreen and vintag e varieties The MSCI All Country Venture -Backed Private C ompany Indexes include evergreen and vintage variations. Both types are constructed using comparable rigorous selection criteria based on transaction activity and the estimated valuation of companies. The evergreen indexes include the most liquid private companies at each quarterly rebalance to reflect the then -current market dynamics, while the vintage series are launched at the rebalance date of the evergreen indexes and are designed to represent buy -and-hold strategies . As such, a fund tracking a vintage index would have minimum turnover as the index does not go through any active adjustments or
6 Here, the market capitalization or market valuation is estimated based on the evaluated price per share and number of shares issued . This data point is directly sourced from data providers Caplight and PM Insights.
msci.com 10 © 2025 MSCI Inc. All rights reserved. Please refer to the disclaimer at the end of this document.
Capturing the Growth of Venture -Backed Companies | August 2025
rebalances .7 Companies are removed from vintage indexes at the time of exit events (e.g., IPO, acquisition) , to align with the timing of a fund manager potentially returning cash proceeds to investors in a fund.
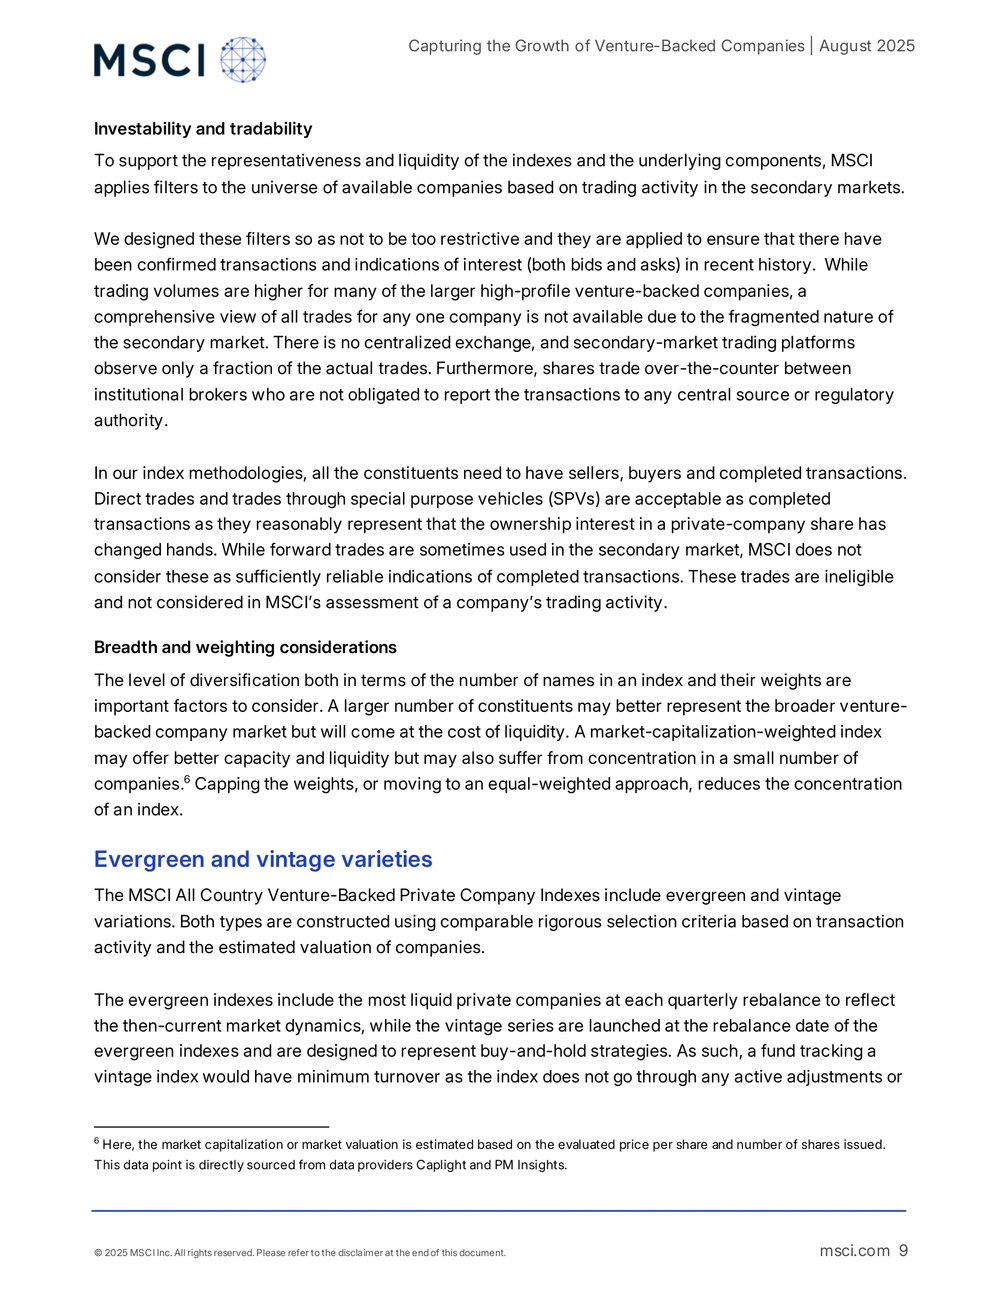
The MSCI All Country Venture -Backed Private Company Top 50 Index (from now on referred to as the Top 50 Index) is designed to represent the performance of the 50 largest venture -backed companies in the MSCI eligible universe. Its constituents are weighted in proportion to their estimated market capitalization on each quarterly rebalance date.8 In addition to the Top 50, MSCI publishes T op 10 and Top 20 indexes , which target more- liquid companies . Vintage series versions of these narrower indexes are designed with the idea that they will form the basis of investment products .9 Top 50 Index characteristics In the following charts, we detail the composition of the Top 50 I ndex. We first compare the sector weights of the Top 50 Index with the MSCI World Index, a broad global public -equity index. Information technology constitutes over 45% of the weight of the Top 50 Index , followed by i ndustrials and communication services, largely driven by index constituents Space Exploration Technologies Corp. (SpaceX ) and ByteDance Ltd., respectively. Sector breakdowns of the Top 50 Index vs. the MSCI World Index
Data as of June 2, 2025.
7 In the MSCI All Country Top 50 Index (the evergreen index ) and for the available history , on average six constituents are added and deleted on each rebalance. These tend to be smaller names that are added to or deleted from the index due to the changes in their valuations, liquidity or corporate actions. 8 The eligible universe is the universe of all companies for which MSCI’s data partners have the required data coverage. 9 For the Top 50 index, if the number of constituents is below 50 due to liquidity constraints, the constraints are relaxed to achieve the target 50 names. 45.2% 25.4%19.1%9.7%0.7%Top 50 Index Information Technology Industrials CommunicationServices Financials Health Care25% 11% 8% 17%10%10%6%MSCI World Index Information Technology Industrials Communication Services Financials Consumer Discretionary Health Care Consumer Staples Utilities Materials Energy Real Estate
msci.com 11 © 2025 MSCI Inc. All rights reserved. Please refer to the disclaimer at the end of this document.
Capturing the Growth of Venture -Backed Companies | August 2025
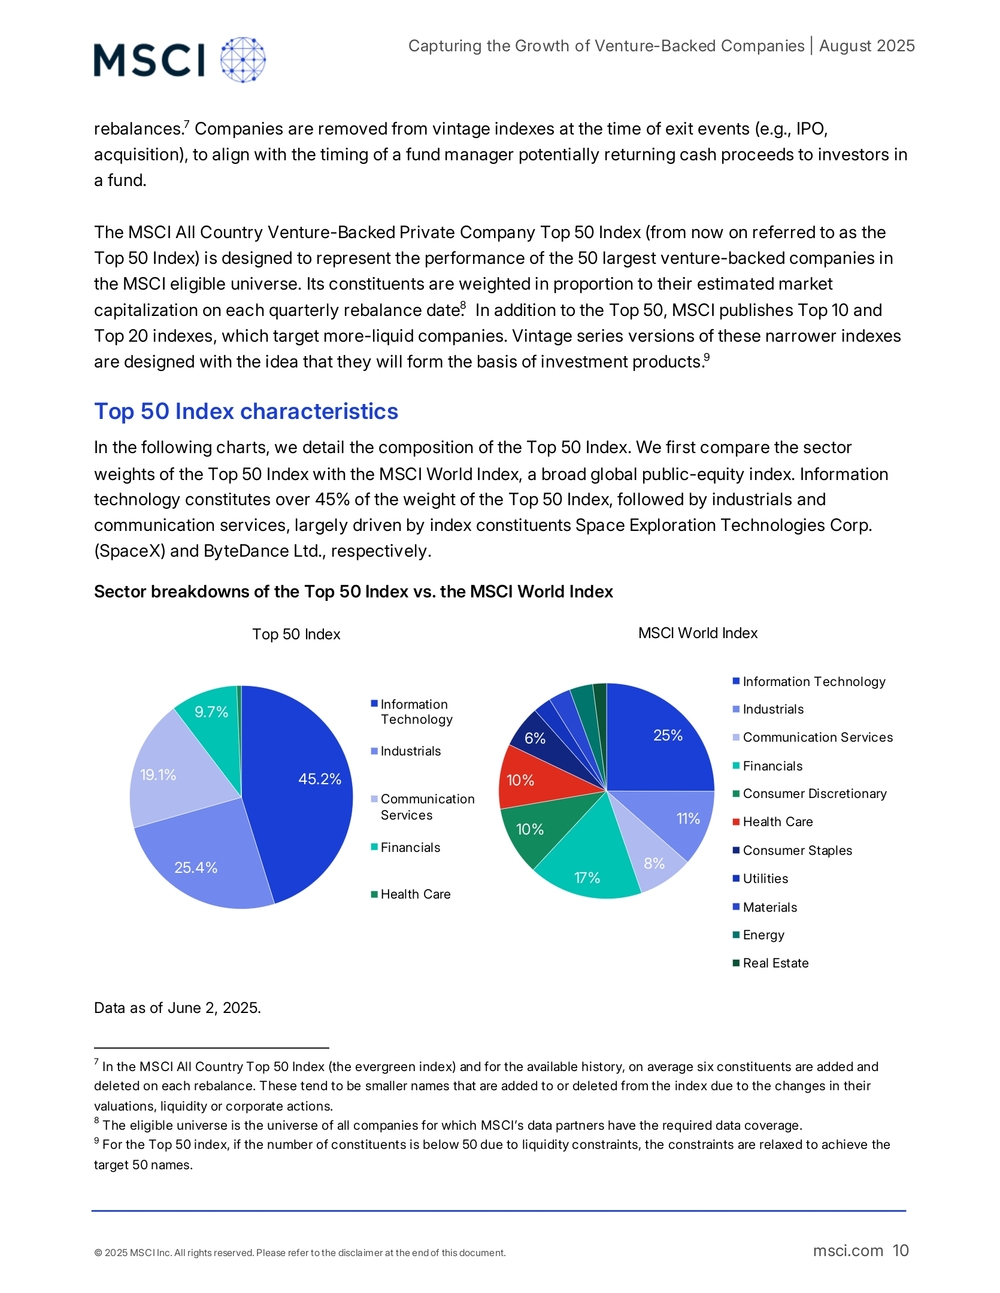
Largest constituents of the Top 50 Index
Weights as of June 2, 2025. Estimated market capitalizations are as of April 30, 2025.
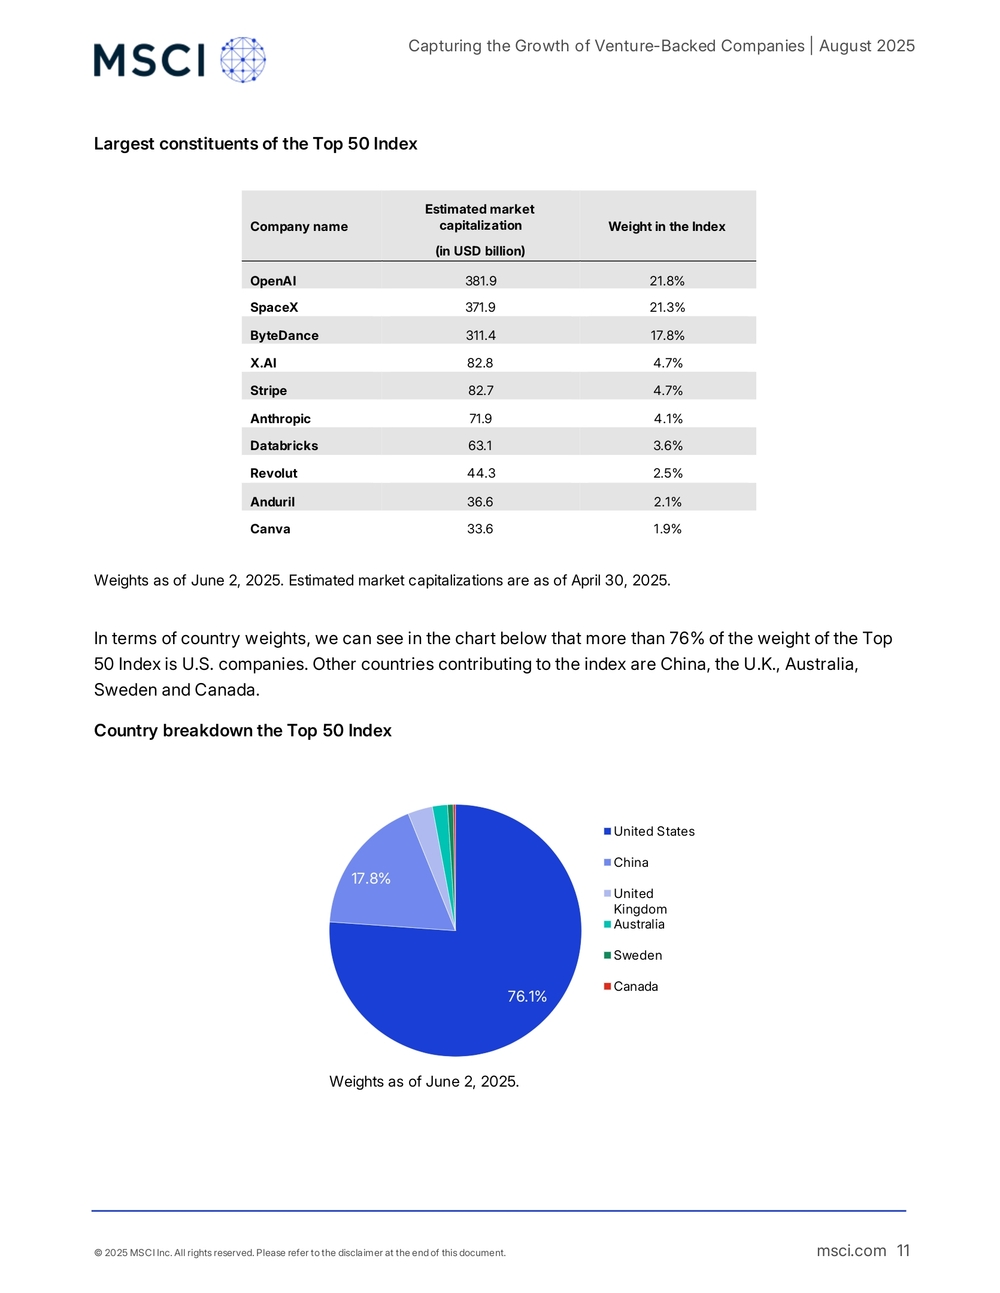
In terms of country weight s, we can see in the chart below that more than 76% of the weight of the Top 50 Index is U.S. companies. Other countries contributing to the index are China, the U.K., Australia, Sweden and Canada. Country breakdown the Top 50 Index
Weights as of June 2, 2025 . 76.1%17.8%United States China United Kingdom Australia Sweden CanadaCompany n ame Estimated market capitalization (in USD billion) Weight in the Index OpenAI 381.9 21.8% SpaceX 371.9 21.3% ByteDance 311.4 17.8% X.AI 82.8 4.7% Stripe 82.7 4.7% Anthropic 71.9 4.1% Databricks 63.1 3.6% Revolut 44.3 2.5% Anduril 36.6 2.1% Canva 33.6 1.9%
msci.com 12 © 2025 MSCI Inc. All rights reserved. Please refer to the disclaimer at the end of this document.
Capturing the Growth of Venture -Backed Companies | August 2025
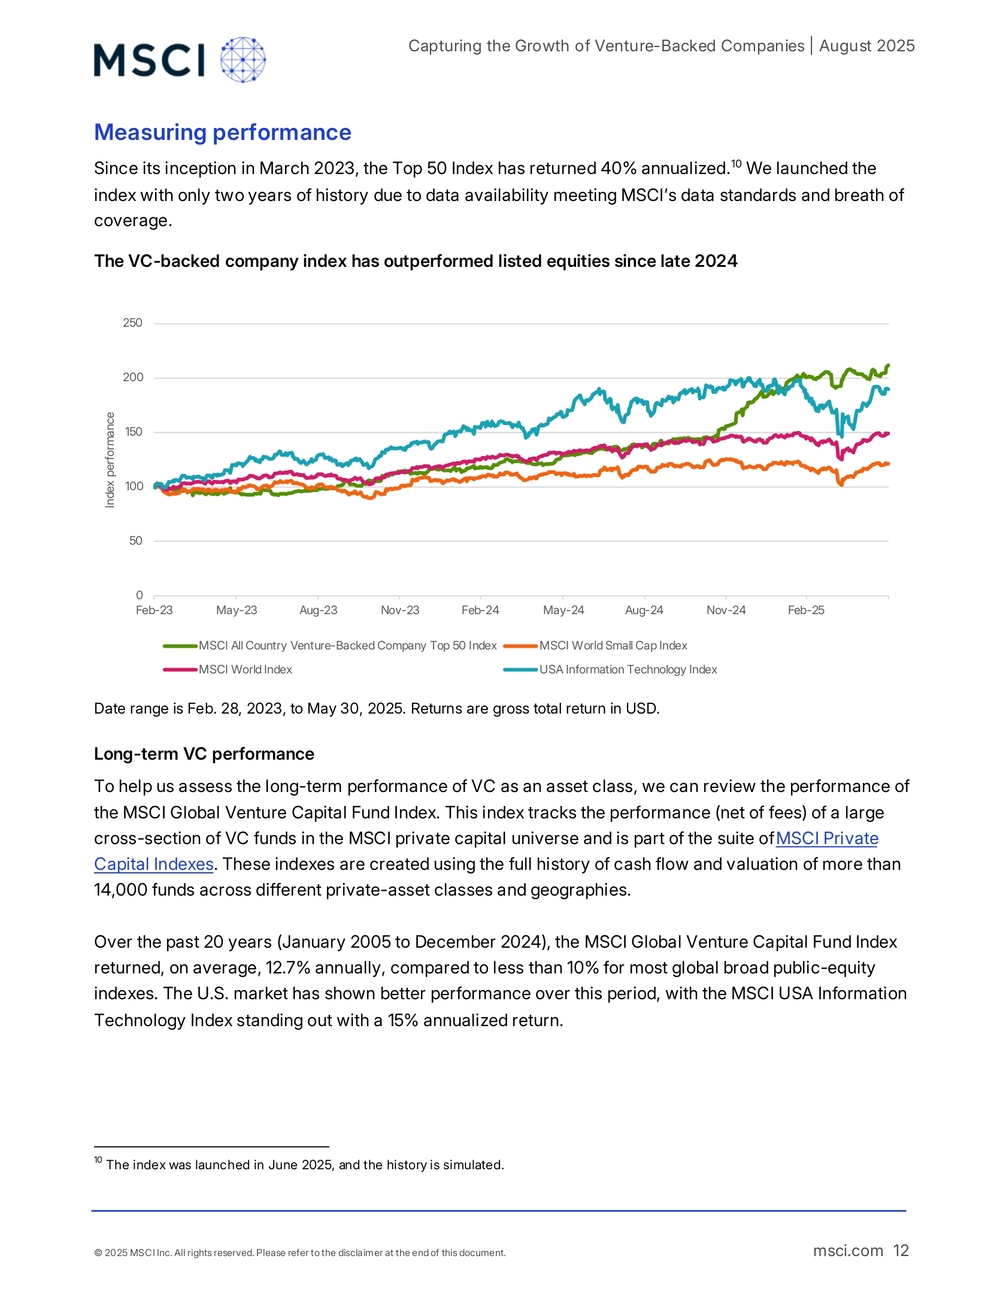
Measuring performance Since its inception in March 2023, the Top 50 Index has returned 40% annualized .10 We launched the index with only two years of history due to data availability meeting MSCI’s data standards and breath of coverage. The VC -backed company index has outperform ed listed equities since late 2024
Date range is Feb. 28, 2023, to May 30, 2025 . Returns are gross total retu rn in USD. Long -term VC performance To help us assess the long-term performance of VC as an asset class, we can review the performance of the MSCI Global Venture Capital Fund Index. This index tracks the performance (net of fees) of a large cross -section of VC funds in the MSCI private capital universe and is part of the suite of MSCI Private Capital Index es. These indexes are created using the full history of cash flow and valuation of more than 14,000 funds across different private- asset classes and geographies.
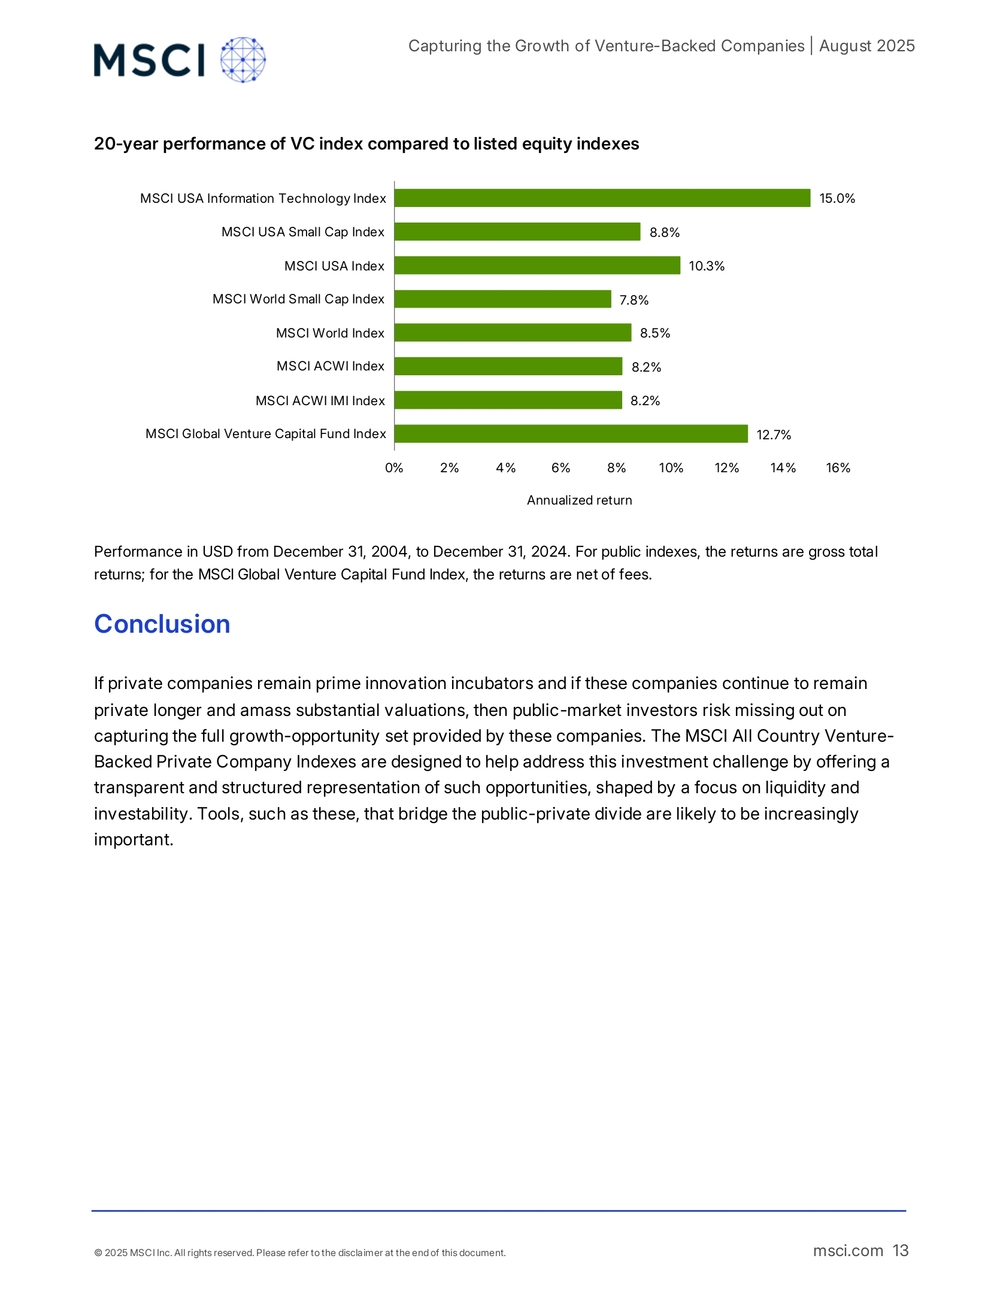
Over the past 20 years (Jan uary 2005 to December 2024), the MSCI Global Venture Capital Fund Index returned, on average , 12.7% annually , compared to less than 10% for most global broad public -equity indexes . The U.S. market has shown better performance over this period , with the MSCI USA Information Technology Index standing out with a 15% annual ized return .
10 The index wa s launched in June 2025, and the history is simulated. 050100150200250 Feb-23 May-23 Aug-23 Nov-23 Feb-24 May-24 Aug-24 Nov-24 Feb-25Index performance MSCI All Country Venture-Backed Company Top 50 Index MSCI World Small Cap Index MSCI World Index USA Information Technology Index
msci.com 13 © 2025 MSCI Inc. All rights reserved. Please refer to the disclaimer at the end of this document.
Capturing the Growth of Venture -Backed Companies | August 2025
20-year performance of VC index compared to listed equity indexes
Performance in USD from December 31, 2004, to December 31, 2024 . For public indexes, the returns are gross total returns ; for the MSCI Global Venture Capital Fund Index, the returns are net of fee s. Conclusion
If private companies remain prime innovation incubators and if these companies continue to remain private longer and amass substantial valuations , then public -market investors risk missing out on capturing the full growth -opportunity set provided by these companies . The MSCI All Country Venture - Backed Private Company Indexes are designed to help address this investment challenge by offering a transparent and structured representation of such opportunities , shaped by a focus on liquidity and investability. Tools, such as these, that bridge the public -private divide are likely to be increasingly important . 12.7%8.2%8.2%8.5%7.8%10.3%8.8%15.0% 0% 2% 4% 6% 8% 10% 12% 14% 16%MSCI Global Venture Capital Fund IndexMSCI ACWI IMI IndexMSCI ACWI IndexMSCI World IndexMSCI World Small Cap IndexMSCI USA IndexMSCI USA Small Cap IndexMSCI USA Information Technology Index Annualized return
msci.com 14 © 2025 MSCI Inc. All rights reserved. Please refer to the disclaimer at the end of this document.
Capturing the Growth of Venture -Backed Companies | August 2025
Contact Us
About MSCI
MSCI is a leading provider of critical decision support tools and services for the global investment community. With over 50 years of expertise in research, data and technology, we power better investment decisions by enabling clients to understand and analyze key drivers of risk and return and confidently build more effective portfolios. We create industry- leading research -enhanced solutions that clients use to gain insight into and improve transparency across the investment process.
To learn more, please visit www.msci.com . msci.com/contact -us AMERICA United States Canada Brazil Mexico + 1 888 588 4567 *
- 1 416 687 6270
- 55 11 4040 7830 + 52 81 1253 4020 EUROPE, MIDDLE EAST & AFRICA South Africa Germany Switzerland United Kingdom Italy France + 27 21 673 0103
- 49 69 133 859 00
- 41 22 817 9777
- 44 20 7618 2222
- 39 02 5849 0415
- 33 17 6769 810 ASIA PACIFIC China Hong Kong India Malaysia South Korea Singapore Australia Taiwan Thailand Japan
- toll -free + 86 21 61326611
- 852 2844 9333
- 91 22 6784 9160 1800818185 *
- 82 70 4769 4231
- 65 67011177
- 612 9033 9333 008 0112 7513 * 0018 0015 6207 7181 *
- 81 3 4579 0333
msci.com 15 © 2025 MSCI Inc. All rights reserved. Please refer to the disclaimer at the end of this document.
Capturing the Growth of Venture -Backed Companies | August 2025
Notice and Disclaimer
This document and all of the information contained in it, including without limitation all text, data, graphs, charts (collec tively, the “Information”) is the property of MSCI Inc. or its subsidiaries (collectively, “MSCI”), or MSCI’s licensors, direct or indirect suppliers or any third party involved in making or compiling any Information (collectively, with MSCI, the “Information Providers”) and is provided for informational purposes only. The Infor mation may not be modified, reverse -engineered, reproduce d or redisseminated in whole or in part without prior written permission from MSCI. All rights in the Information are reserve d by MSCI and/or its Information Providers. The Information may not be used to create derivative works or to verify or correct other data or information. For example (bu t without limitation), the Information may not be used to create indexes, databases, risk models, analytics, software, or in connec tion with the issuing, offering, sponsoring, managing or marketing of any securities, portfolios, financial products or other investment vehicles utilizing or based on, linked to, tracking or otherwise derived from the Information or any other MSCI data, i nformation, products or services. The user of the Information assumes the entire risk of any use it may make or permit to be made of the Information. NONE OF THE INFORMATION PROVIDERS MAKES ANY EXPRESS OR IMPLIED WARRANTIES OR REPRESENTATIONS WITH RESPECT TO THE INFORMATION (OR THE RESULTS TO BE OBTAINED BY THE USE THEREOF), AND TO THE MAXIMUM EXTENT PERMITTED BY APPLICABLE LAW, EACH INFORMATION PROVIDER EXPRESSLY DISCLAIMS ALL IMPLIED WARRANTIES (INCLUDING, WITHOUT LIMITATION, ANY IMPLIED WARRANTIES OF ORIGINALITY, ACCURACY, TIMELINESS, NON-INFRINGEMENT, COMPLETENESS, MERCHANTABILITY AND FITNESS FOR A PARTICULAR PURPOSE) WITH RESPECT TO ANY OF THE INFORMATION. Without limiting any of the foregoing and to the maximum extent permitted by applicable law, in no event shall any Informatio n Provider have any liability regarding any of the Information for any direct, indirect, special, punitive, consequential (includin g lost profits) or any other damages even if notified of the possibility of such damages. The foregoing shall not exclude or limit any liability that may not by applicable law be exclude d or limited, including without limitation (as applicable), any liability for death or personal injury to the extent that such injury results from the negligence or willful default of itself, its servants, agents or sub -contractors. Information containing any historical information, data or analysis should not be taken as an indication or guarantee of any future performance, analysis, forecast or prediction. Past performance does not guarantee future results. The Information may include “Signals,” defined as quantitative attributes or the product of methods or formulas that describe or are derived from calculations using historical data. Neither these Signals nor any description of historical data are intended to provide investment advice or a recommendation to make (or refrain from making) any investment decision or asset allocation and should not be relied upon as such. Signals are inherently backward -looking because of their use of historical data, and they a re not intended to predict the future. The relevance, correlations and accuracy of Signals frequently will change materially. The Information should not be relied on and is not a substitute for the skill, judgment and experience of the user, its manag ement, employees, advisors and/or clients when making investment and other business decisions. All Information is impersonal and no t tailored to the needs of any person, entity or group of persons. None of the Information constitutes an offer to sell (or a solicitation of an offer to buy), any security, financial product or other investment vehicle or any trading strategy. It is not possible to invest directly in an index. Exposure to an asset class or trading strategy or other category represen ted by an index is only available through third party investable instruments (if any) based on that index. MSCI does not issue, spo nsor, endorse, market, offer, review or otherwise express any opinion regarding any fund, ETF, derivative or other security, investment, financial product or trading strategy that is base d on, linked to or seeks to provide an investment return related to t he performance of any MSCI index (collectively, “Index Linked Investments”). MSCI makes no assurance that any Index Linked Investments will accurately track index performance or provide positive investment returns. MSCI Inc. is not an invest ment adviser or fiduciary and MSCI makes no representation regarding the advisability of investing in any Index Linked Investments. Index returns do not represent the results of actual trading of investible assets/securities. MSCI maintains and calculates indexes, but does not manage actual assets. The calculation of indexes and index returns may deviate from the stated methodology. In dex returns do not reflect payment of any sales charges or fees an investor may pay to purchase the securities underlying the index or Index Linked Investments. The impositi on of these fees and charges would cause the performance of an Index Linked Investm ent to be different than the MSCI index performance. The Information may contain back tested data. Back -tested performance is not actual performance, but is hypothetical. There are frequently material differences between back tested performance results and actual results subsequently achieved by any investment strategy. Constituents of MSCI equity indexes are listed companies, which are included in or excluded from the indexes according to the application of the relevant index methodologies. Accordingly, constituents in MSCI equity indexes may include MSCI Inc., clients o f MSCI or suppliers to MSCI. Inclusion of a security within an MSCI index is not a recommendation by MSCI to buy, sell, or hold such security, nor is it considered to be investme nt advice. Data and information produced by various affiliates of MSCI Inc., including MSCI ESG Research LLC and Barra LLC, may be used in calculating certain MSCI indexes. More information can be found in the relevant index methodologies on www.msci.com. MSCI receives compensation in connection with licensing its indexes to third parties. MSCI Inc.’s revenue includes fees based on assets in Index Linked Investments. Information can be found in MSCI Inc.’s company filings on the Investor Relations section o f msci.com. MSCI ESG Research LLC is a Registered Investment Adviser under the Investment Advisers Act of 1940 and a subsidiary of MSCI I nc. Neither MSCI nor any of its products or services recommends, endorses, approves or otherwise expresses any opinion regarding an y issuer, securities, financial products or instruments or trading strategies and MSCI’s products or services are not a recommendation to make (or refrain from making) a ny kind of investment decision and may not be relied on as such, provided that applicable products or services from MSCI ESG Research may constitute investment advice. MSCI ESG Research materials, including materials utilized in any MSCI ESG Indexes or other products, have not been submitted to, n or received approval from, the United States Securities and Exchange Commission or any other regulatory body. MSCI ESG and climate ratings, research and data are produced by MSCI ESG Research LLC, a subsidiary of MSCI Inc. MSCI ESG Indexes, Analytics and Real Estate are products of MSCI Inc. that uti lize information from MSCI ESG Research LLC. MSCI Indexes are administered by MSCI Limited (UK) and MSCI Deutschland GmbH. Please note that the issuers mentioned in MSCI ESG Research materials sometimes have commercial relationships with MSCI ESG R esearch and/or MSCI Inc. (collectively, “MSCI”) and that these relationships create potential conflicts of interest. In some cases, the issuers or their affiliates purchase research or other products or services from one or more MSCI affiliates. In other cases, MSCI ESG Research rates financial products such as mut ual funds or ETFs that are managed by MSCI’s clients or their affiliates, or are based on MSCI Inc. Indexes. In addition, constituents in MSCI Inc. equity indexes include companies that subscribe to MSCI products or services. In some cases, MSCI clients pay fees based in whole or part on the assets they manage . MSCI ESG Resea rch has taken a number of steps to mitigate potential conflicts of interest and safeguard the integrity and independence of its resea rch and ratings. More information about these conflict mitigation measures is available in our Form ADV, available at https://adviserinfo.sec.gov/firm/summary/169222. Any use of or access to products, services or information of MSCI requires a license from MSCI. MSCI, Barra, RiskMetrics, IPD and other MSCI brands and product names are the trademarks, service marks, or registered trademarks of MSCI or its subsidiaries in the United States and other jurisdictions. The Global Industry Classification Standard (GICS) was developed by and is the exclusive property of MSCI and S&P Dow Jones Indices. “Global Industry Classification Standard (GICS)” is a service mark of MSCI and S&P Dow Jones Indices.
msci.com 16 © 2025 MSCI Inc. All rights reserved. Please refer to the disclaimer at the end of this document.
Capturing the Growth of Venture -Backed Companies | August 2025
MIFID2/MIFIR notice: MSCI ESG Research LLC does not distribute or act as an intermediary for financial instruments or structu red deposits, nor does it deal on its own account, provide execution services for others or manage client accounts. No MSCI ESG Res earch product or service supports, promotes or is intended to support or promote any such activity. MSCI ESG Research is an independent provider of ESG data. Privacy notice: For information about how MSCI collects and uses personal data, please refer to our Privacy Notice at https://www.msci.com/privacy -pledge.