KSTR UCITS: China STAR Market ETF | KraneShares
by Kraneshares
info@kraneshares.comKSTR 1Capturing China’s Brightest Science & Technology STARs Overview of the KraneShares ICBCUBS China Technology & Semiconductor STAR 50 Index UCITS ETF (Ticker: KSTR)30/June/2026 This is a marketing communication. Please refer to the prospectus of the UCITS, the KIID, and the PRIIP before making any fin al investment decisions. The tax treatment depends on the individual circumstances of each client and may be subject to change in the future.
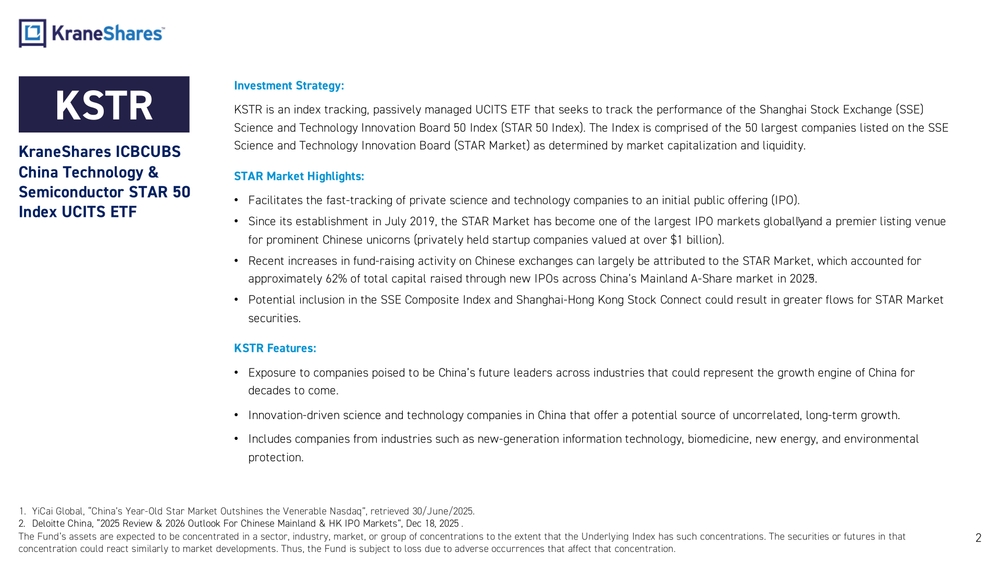
Investment Strategy:
KSTR is an index tracking, passively managed UCITS ETF that seeks to track the performance of the Shanghai Stock Exchange (SS E)
Science and Technology Innovation Board 50 Index (STAR 50 Index). The Index is comprised of the 50 largest companies listed on t he SSE
Science and Technology Innovation Board (STAR Market) as determined by market capitalization and liquidity.
STAR Market Highlights:
•Facilitates the fast -tracking of private science and technology companies to an initial public offering (IPO).
•Since its establishment in July 2019, the STAR Market has become one of the largest IPO markets globally1 and a premier listing venue
for prominent Chinese unicorns (privately held startup companies valued at over $1 billion).
•Recent increases in fund- raising activity on Chinese exchanges can largely be attributed to the STAR Market, which accounted for
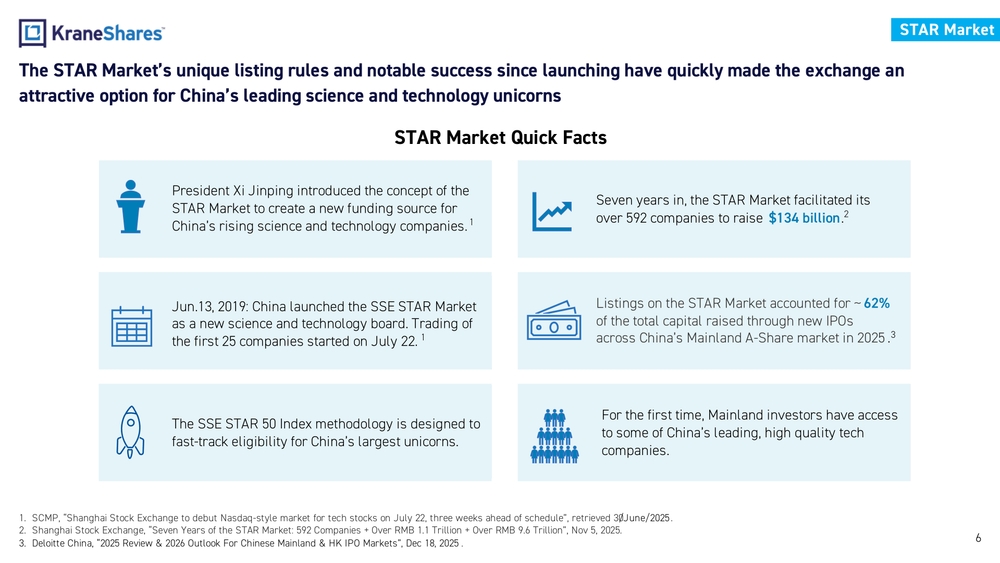
approximately 62% of total capital raised through new IPOs across China’s Mainland A -Share market in 2025.2
•Potential inclusion in the SSE Composite Index and Shanghai -Hong Kong Stock Connect could result in greater flows for STAR Marke t
securities.
KSTR Features:
•Exposure to companies poised to be China’s future leaders across industries that could represent the growth engine of China f or
decades to come.
•Innovation- driven science and technology companies in China that offer a potential source of uncorrelated, long- term growth.
•Includes companies from industries such as new -generation information technology, biomedicine, new energy, and environmental
protection.
21.YiCai Global, “China’s Year -Old Star Market Outshines the Venerable Nasdaq”, retrieved 30/June/2025.
2.Deloitte China, “2025 Review & 2026 Outlook For Chinese Mainland & HK IPO Markets”, Dec 18, 2025.
The Fund’s assets are expected to be concentrated in a sector, industry, market, or group of concentrations to the extent tha t the Underlying Index has such concentrations. The securities or futures in that
concentration could react similarly to market developments. Thus, the Fund is subject to loss due to adverse occurrences that affect that concentration.KSTR
KraneShares ICBCUBS
China Technology & Semiconductor STAR 50
Index UCITS ETF
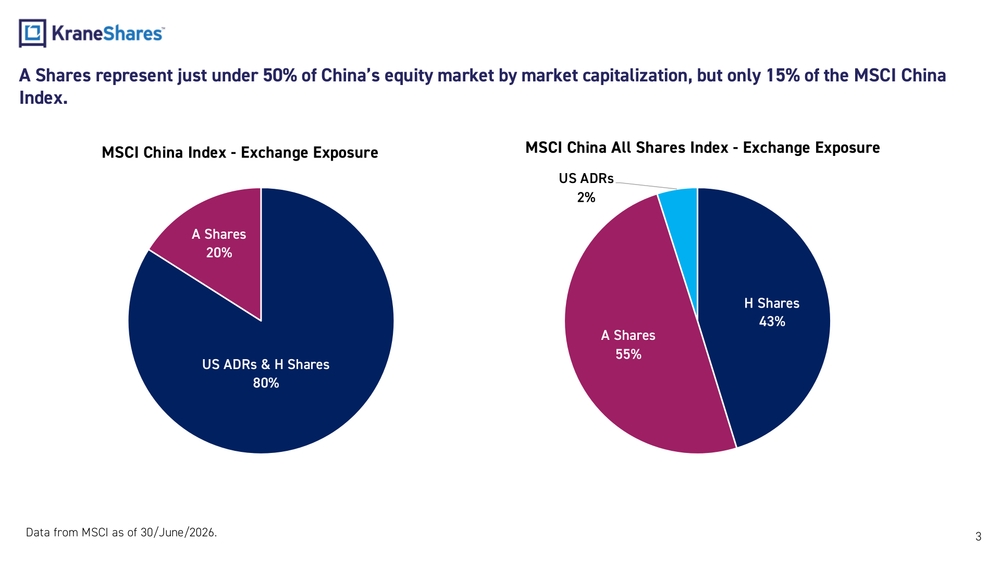
3Data from MSCI as of 30/June/2026.A Shares represent just under 50% of China’s equity market by market capitalization, but only 15% of the MSCI China Index. US ADRs & H Shares 80%A Shares 20%MSCI China Index - Exchange Exposure H Shares 43% A Shares 55%US ADRs 2%MSCI China All Shares Index - Exchange Exposure
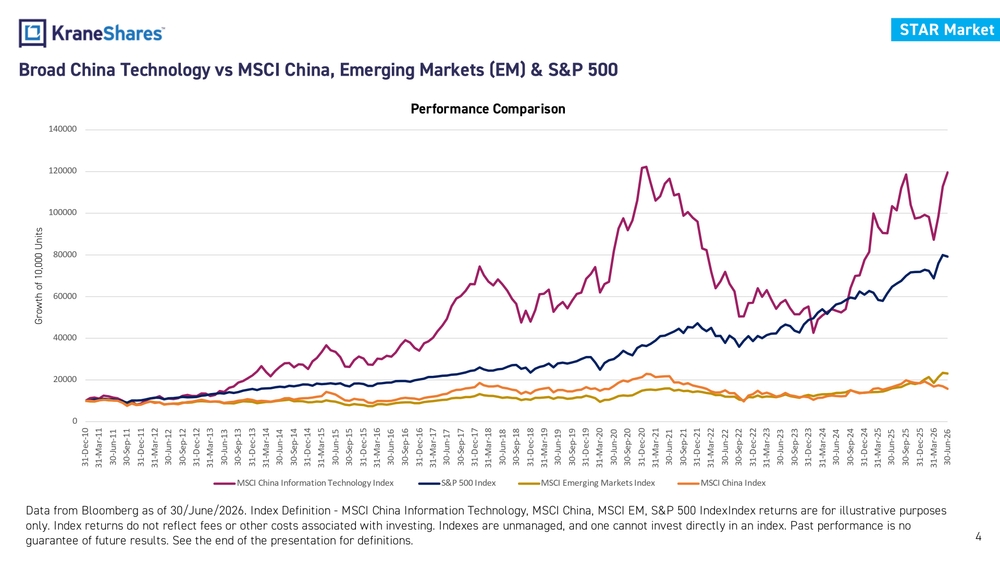
Broad China Technology vs MSCI China, Emerging Markets (EM) & S&P 500 Data from Bloomberg as of 30/June/2026. Index Definition - MSCI China Information Technology, MSCI China, MSCI EM, S&P 500 Index Index returns are for illustrative purposes only. Index returns do not reflect fees or other costs associated with investing. Indexes are unmanaged, and one cannot invest directly in an index. Past performance is no guarantee of future results. See the end of the presentation for definitions. 4STAR Market 020000400006000080000100000120000140000 31-Dec-10 31-Mar-11 30-Jun-11 30-Sep-11 31-Dec-11 31-Mar-12 30-Jun-12 30-Sep-12 31-Dec-12 31-Mar-13 30-Jun-13 30-Sep-13 31-Dec-13 31-Mar-14 30-Jun-14 30-Sep-14 31-Dec-14 31-Mar-15 30-Jun-15 30-Sep-15 31-Dec-15 31-Mar-16 30-Jun-16 30-Sep-16 31-Dec-16 31-Mar-17 30-Jun-17 30-Sep-17 31-Dec-17 31-Mar-18 30-Jun-18 30-Sep-18 31-Dec-18 31-Mar-19 30-Jun-19 30-Sep-19 31-Dec-19 31-Mar-20 30-Jun-20 30-Sep-20 31-Dec-20 31-Mar-21 30-Jun-21 30-Sep-21 31-Dec-21 31-Mar-22 30-Jun-22 30-Sep-22 31-Dec-22 31-Mar-23 30-Jun-23 30-Sep-23 31-Dec-23 31-Mar-24 30-Jun-24 30-Sep-24 31-Dec-24 31-Mar-25 30-Jun-25 30-Sep-25 31-Dec-25 31-Mar-26 30-Jun-26Growth of 10,000 UnitsPerformance Comparison MSCI China Information Technology Index S&P 500 Index MSCI Emerging Markets Index MSCI China Index
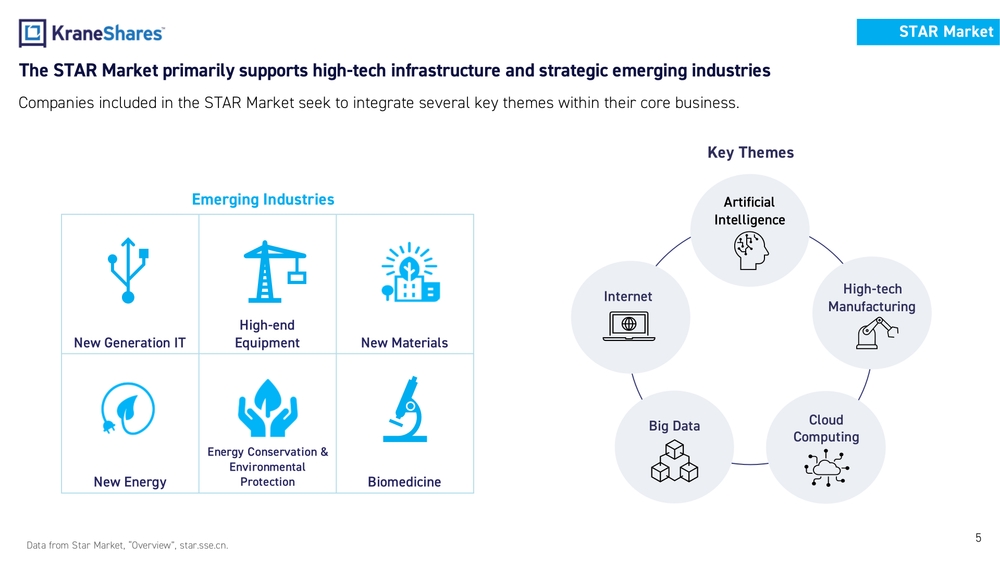
5Cloud ComputingInternetArtificial Intelligence Big DataHigh -tech Manufacturing New Generation ITHigh -end Equipment New Materials New EnergyEnergy Conservation & Environmental Protection Biomedicine Emerging IndustriesSTAR Market Companies included in the STAR Market seek to integrate several key themes within their core business. Data from Star Market, “Overview”, star.sse.cn. Key ThemesThe STAR Market primarily supports high- tech infrastructure and strategic emerging industries
6The STAR Market’s unique listing rules and notable success since launching have quickly made the exchange an attractive option for China’s leading science and technology unicorns STAR Market Quick Facts President Xi Jinping introduced the concept of the STAR Market to create a new funding source for China’s rising science and technology companies. 1 Listings on the STAR Market accounted for ~ 62% of the total capital raised through new IPOs across China’s Mainland A -Share market in 2025. 3Jun.13, 2019: China launched the SSE STAR Market as a new science and technology board. Trading of the first 25 companies started on July 22. 1Seven years in, the STAR Market facilitated its over 592 companies to raise $134 billion . 2 For the first time, Mainland investors have access to some of China’s leading, high quality tech companies.The SSE STAR 50 Index methodology is designed to fast-track eligibility for China’s largest unicorns. 1.SCMP, “Shanghai Stock Exchange to debut Nasdaq -style market for tech stocks on July 22, three weeks ahead of schedule”, retrieved 30 /June/2025 . 2.Shanghai Stock Exchange, “Seven Years of the STAR Market: 592 Companies + Over RMB 1.1 Trillion + Over RMB 9.6 Trillion”, Nov 5, 2025. 3.Deloitte China, “2025 Review & 2026 Outlook For Chinese Mainland & HK IPO Markets”, Dec 18, 2025.STAR Market
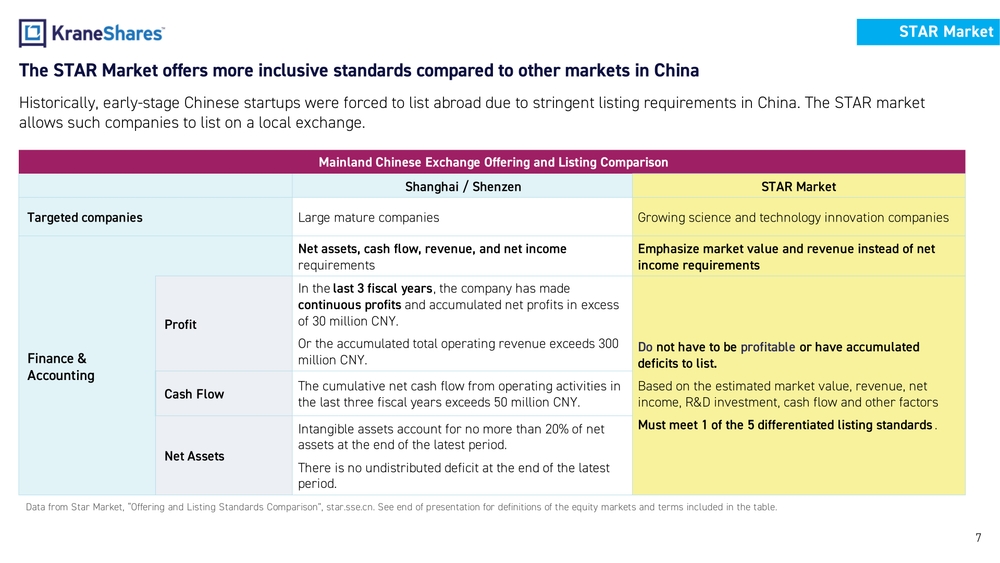
7Data from Star Market, “Offering and Listing Standards Comparison”, star.sse.cn. See end of presentation for definitions of t he equity markets and terms included in the table.STAR Market The STAR Market offers more inclusive standards compared to other markets in China Mainland Chinese Exchange Offering and Listing Comparison Shanghai / Shenzen STAR Market Targeted companies Large mature companies Growing science and technology innovation companies Finance & AccountingNet assets, cash flow, revenue, and net income requirementsEmphasize market value and revenue instead of net income requirements ProfitIn the last 3 fiscal years , the company has made continuous profits and accumulated net profits in excess of 30 million CNY. Or the accumulated total operating revenue exceeds 300 million CNY.Do not have to be profitable or have accumulated deficits to list. Based on the estimated market value, revenue, net income, R&D investment, cash flow and other factors Must meet 1 of the 5 differentiated listing standards .Cash FlowThe cumulative net cash flow from operating activities in the last three fiscal years exceeds 50 million CNY. Net AssetsIntangible assets account for no more than 20% of net assets at the end of the latest period. There is no undistributed deficit at the end of the latest period.Historically, early -stage Chinese startups were forced to list abroad due to stringent listing requirements in China. The STAR market allows such companies to list on a local exchange.
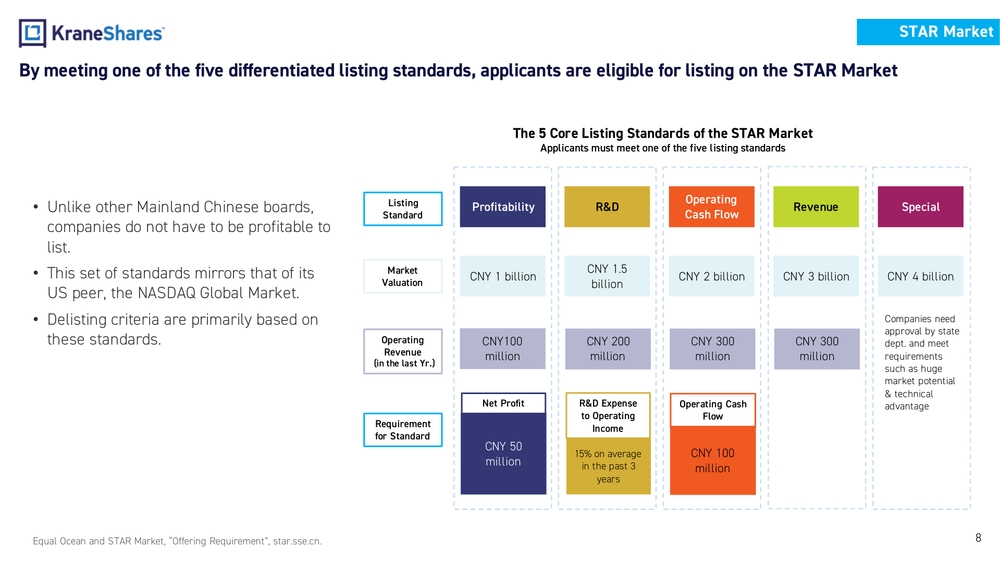
8The 5 Core Listing Standards of the STAR Market Applicants must meet one of the five listing standards •Unlike other Mainland Chinese boards, companies do not have to be profitable to list. •This set of standards mirrors that of its US peer, the NASDAQ Global Market. •Delisting criteria are primarily based on these standards. Equal Ocean and STAR Market, “Offering Requirement”, star.sse.cn.STAR Market Market Valuation Operating Revenue (in the last Yr.) Requirement for StandardProfitability R&DOperating Cash FlowRevenue Special CNY 1 billionCNY 1.5 billionCNY 2 billion CNY 3 billion CNY 4 billion CNY100 millionCNY 200 millionCNY 300 millionCNY 300 millionCompanies need approval by state dept. and meet requirements such as huge market potential & technical advantage CNY 50 millionNet Profit 15% on average in the past 3 yearsR&D Expense to Operating Income CNY 100 millionOperating Cash FlowListing StandardBy meeting one of the five differentiated listing standards, applicants are eligible for listing on the STAR Market
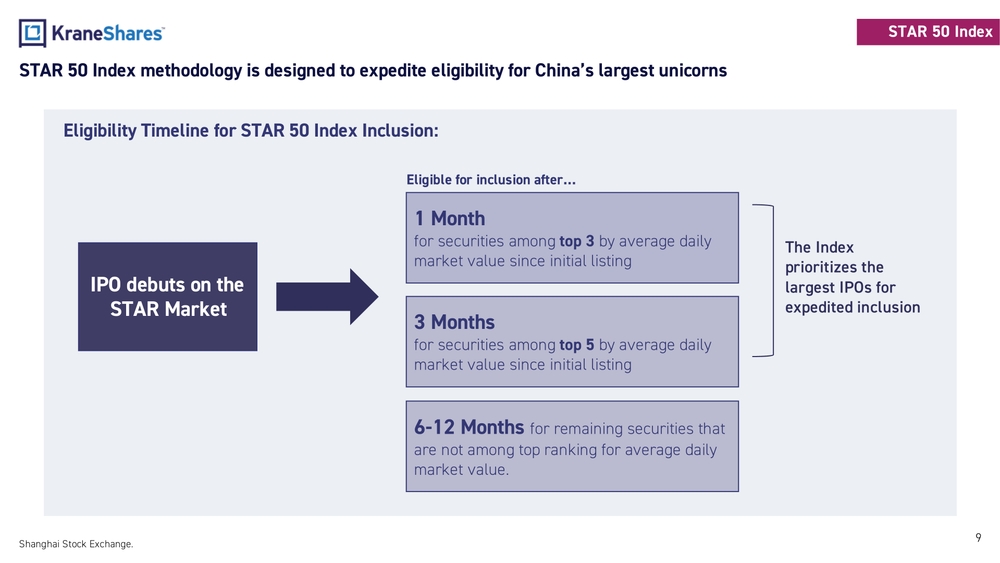
9Shanghai Stock Exchange.3 Months for securities among top 5 by average daily market value since initial listing1 Month for securities among top 3 by average daily market value since initial listing 6-12 Months for remaining securities that are not among top ranking for average daily market value.STAR 50 Index methodology is designed to expedite eligibility for China’s largest unicorns The Index prioritizes the largest IPOs for expedited inclusionEligibility Timeline for STAR 50 Index Inclusion: IPO debuts on the STAR MarketEligible for inclusion after…STAR 50 Index
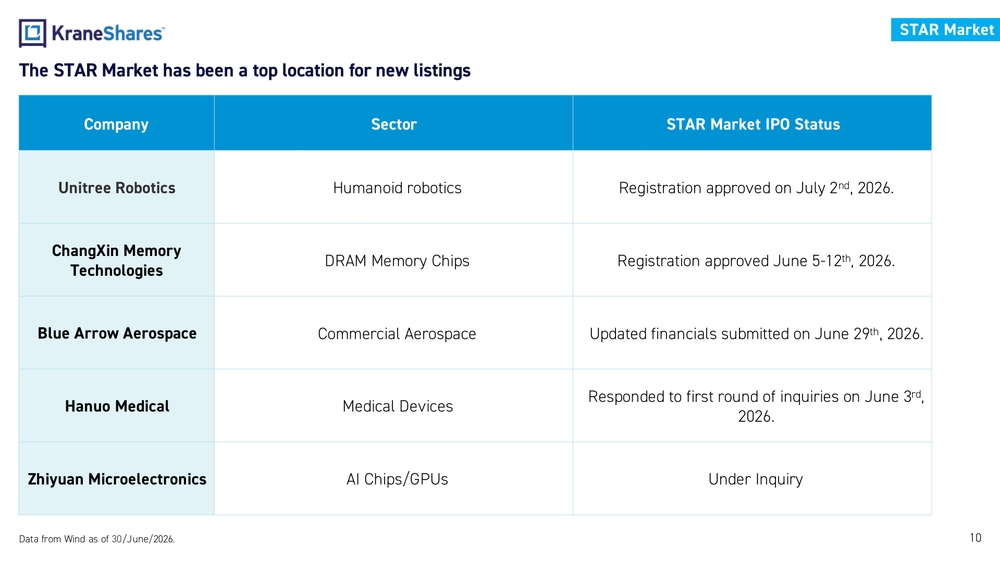
10The STAR Market has been a top location for new listings Data from Wind as of 30/June/2026.Company Sector STAR Market IPO Status Unitree Robotics Humanoid robotics Registration approved on July 2nd, 2026. ChangXin Memory TechnologiesDRAM Memory Chips Registration approved June 5 -12th, 2026. Blue Arrow Aerospace Commercial Aerospace Updated financials submitted on June 29th, 2026. Hanuo Medical Medical DevicesResponded to first round of inquiries on June 3rd, 2026. Zhiyuan Microelectronics AI Chips/GPUs Under InquirySTAR Market
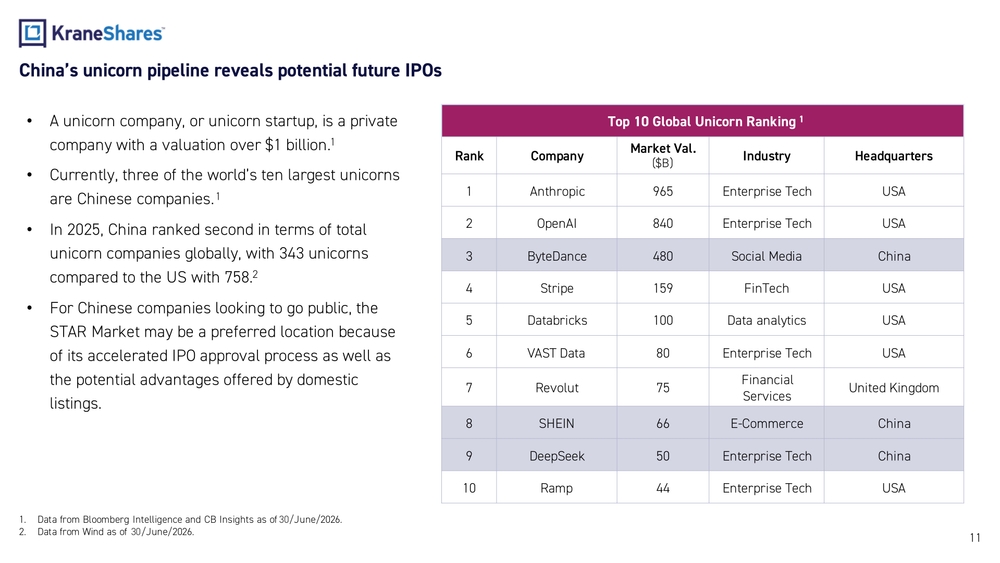
111.Data from Bloomberg Intelligence and CB Insights as of 30/June/2026. 2.Data from Wind as of 30/June/2026.•A unicorn company, or unicorn startup, is a private company with a valuation over $1 billion.1 •Currently, three of the world’s ten largest unicorns are Chinese companies. 1 •In 2025, China ranked second in terms of total unicorn companies globally, with 343 unicorns compared to the US with 758. 2 •For Chinese companies looking to go public, the STAR Market may be a preferred location because of its accelerated IPO approval process as well as the potential advantages offered by domestic listings. Top 10 Global Unicorn Ranking1 Rank CompanyMarket Val. ($B)Industry Headquarters 1 Anthropic 965 Enterprise Tech USA 2 OpenAI 840 Enterprise Tech USA 3 ByteDance 480 Social Media China 4 Stripe 159 FinTech USA 5 Databricks 100 Data analytics USA 6 VAST Data 80 Enterprise Tech USA 7 Revolut 75Financial ServicesUnited Kingdom 8 SHEIN 66 E-Commerce China 9 DeepSeek 50 Enterprise Tech China 10 Ramp 44 Enterprise Tech USAChina’s unicorn pipeline reveals potential future IPOs
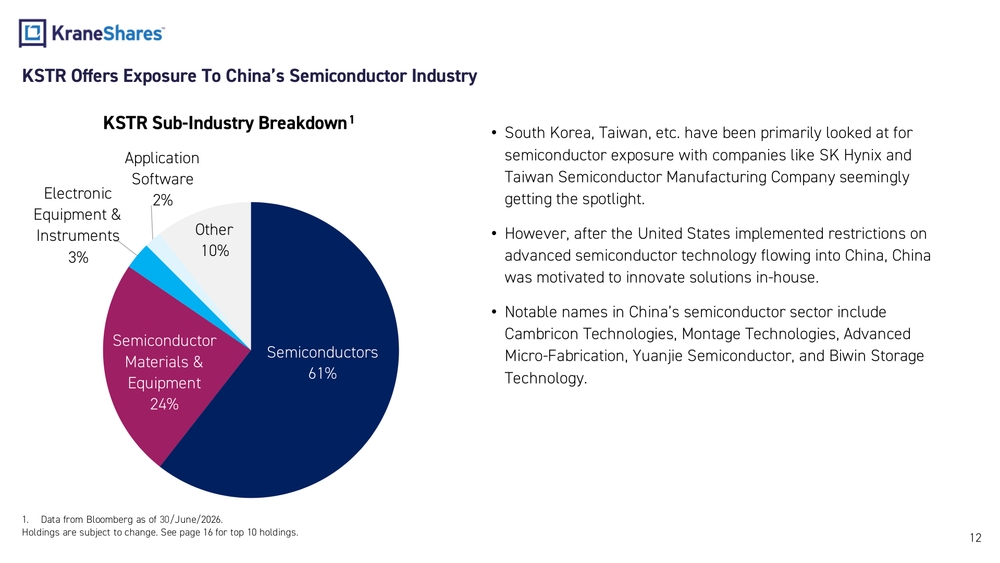
KSTR Offers Exposure To China’s Semiconductor Industry 12•South Korea, Taiwan, etc. have been primarily looked at for semiconductor exposure with companies like SK Hynix and Taiwan Semiconductor Manufacturing Company seemingly getting the spotlight. •However, after the United States implemented restrictions on advanced semiconductor technology flowing into China, China was motivated to innovate solutions in- house. •Notable names in China’s semiconductor sector include Cambricon Technologies, Montage Technologies, Advanced Micro -Fabrication, Yuanjie Semiconductor, and Biwin Storage Technology. 1.Data from Bloomberg as of 30/June/2026. Holdings are subject to change. See page 16 for top 10 holdings.Semiconductors 61%Semiconductor Materials & Equipment 24%Electronic Equipment & Instruments 3%Application Software 2% Other 10%KSTR Sub -Industry Breakdown1
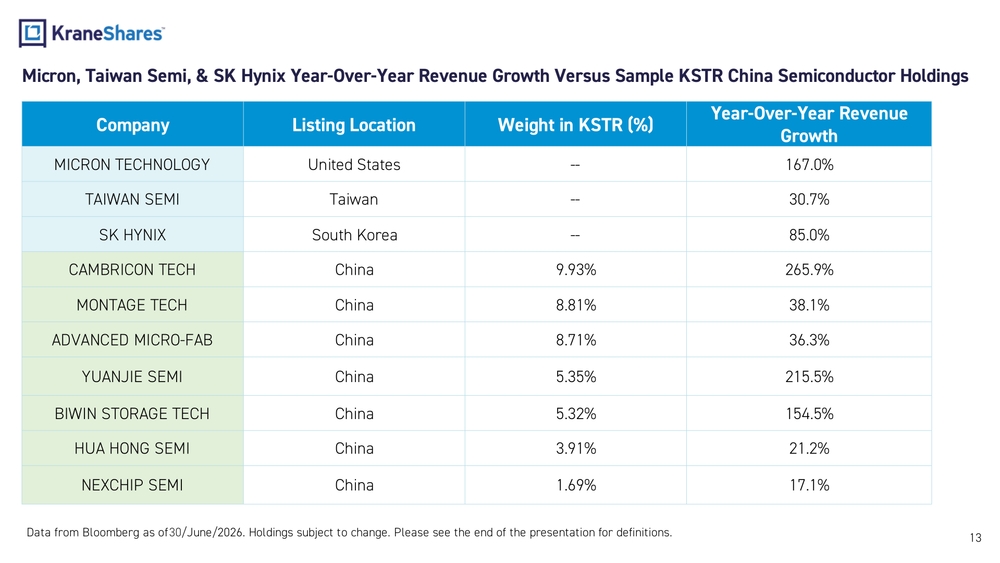
Micron, Taiwan Semi, & SK Hynix Year -Over- Year Revenue Growth Versus Sample KSTR China Semiconductor Holdings 13Company Listing Location Weight in KSTR (%)Year -Over- Year Revenue Growth MICRON TECHNOLOGY United States -- 167.0% TAIWAN SEMI Taiwan -- 30.7% SK HYNIX South Korea -- 85.0% CAMBRICON TECH China 9.93% 265.9% MONTAGE TECH China 8.81% 38.1% ADVANCED MICRO -FAB China 8.71% 36.3% YUANJIE SEMI China 5.35% 215.5% BIWIN STORAGE TECH China 5.32% 154.5% HUA HONG SEMI China 3.91% 21.2% NEXCHIP SEMI China 1.69% 17.1% Data from Bloomberg as of 30/June/2026 . Holdings subject to change. Please see the end of the presentation for definitions.
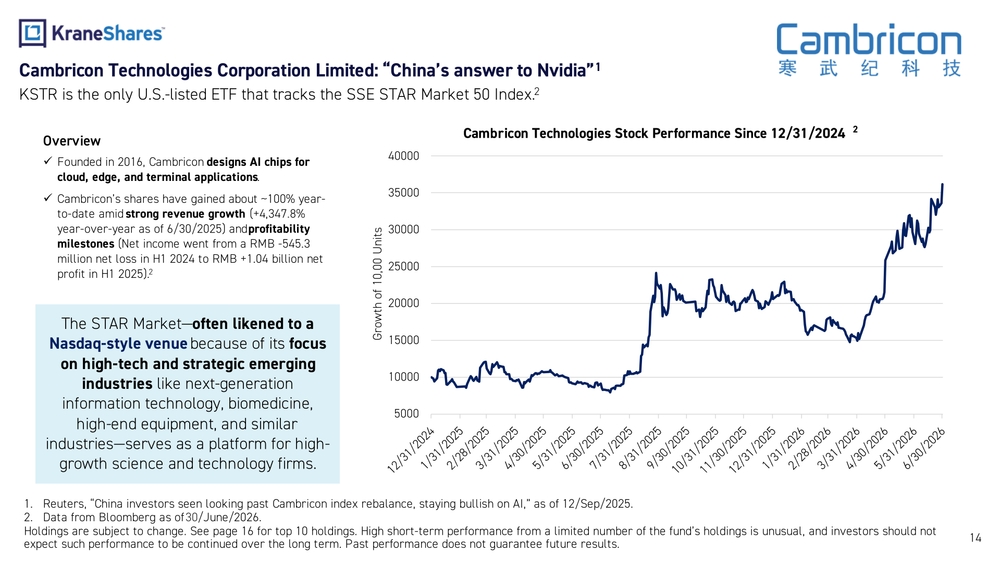
141.Reuters, “China investors seen looking past Cambricon index rebalance, staying bullish on AI,” as of 12/Sep/2025. 2.Data from Bloomberg as of 30/June/2026 . Holdings are subject to change. See page 16 for top 10 holdings. High short -term performance from a limited number of the fund’s holdings is unusual, and investors should not expect such performance to be continued over the long term. Past performance does not guarantee future results.Overview Founded in 2016, Cambricon designs AI chips for cloud, edge, and terminal applications . Cambricon’s shares have gained about ~100% year - to-date amid strong revenue growth (+4,347.8% year-over-year as of 6/30/2025) and profitability milestones (Net income went from a RMB - 545.3 million net loss in H1 2024 to RMB +1.04 billion net profit in H1 2025).2Cambricon Technologies Corporation Limited: “China’s answer to Nvidia”1 KSTR is the only U.S. -listed ETF that tracks the SSE STAR Market 50 Index.2 The STAR Market —often likened to a Nasdaq- style venue because of its focus on high- tech and strategic emerging industries like next -generation information technology, biomedicine, high- end equipment, and similar industries —serves as a platform for high - growth science and technology firms. 500010000150002000025000300003500040000Growth of 10,00 UnitsCambricon Technologies Stock Performance Since 12/31/20242
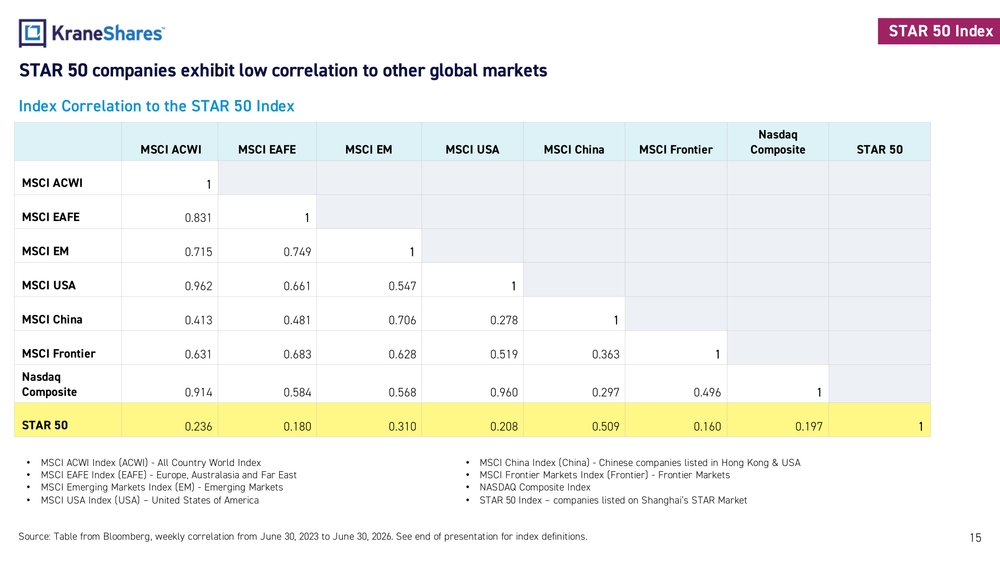
15STAR 50 companies exhibit low correlation to other global markets
MSCI ACWI MSCI EAFE MSCI EM MSCI USA MSCI China MSCI FrontierNasdaq
Composite STAR 50
MSCI ACWI 1
MSCI EAFE 0.831 1
MSCI EM 0.715 0.749 1
MSCI USA 0.962 0.661 0.547 1
MSCI China 0.413 0.481 0.706 0.278 1
MSCI Frontier 0.631 0.683 0.628 0.519 0.363 1
Nasdaq
Composite 0.914 0.584 0.568 0.960 0.297 0.496 1
STAR 50 0.236 0.180 0.310 0.208 0.509 0.160 0.197 1Index Correlation to the STAR 50 Index
•MSCI ACWI Index (ACWI) - All Country World Index
•MSCI EAFE Index (EAFE) - Europe, Australasia and Far East
•MSCI Emerging Markets Index (EM) - Emerging Markets
•MSCI USA Index (USA) – United States of America
Source: Table from Bloomberg, weekly correlation from June 30, 2023 to June 30, 2026. See end of presentation for index definitions.•MSCI China Index (China) - Chinese companies listed in Hong Kong & USA
•MSCI Frontier Markets Index (Frontier) - Frontier Markets
•NASDAQ Composite Index
•STAR 50 Index – companies listed on Shanghai’s STAR MarketSTAR 50 Index
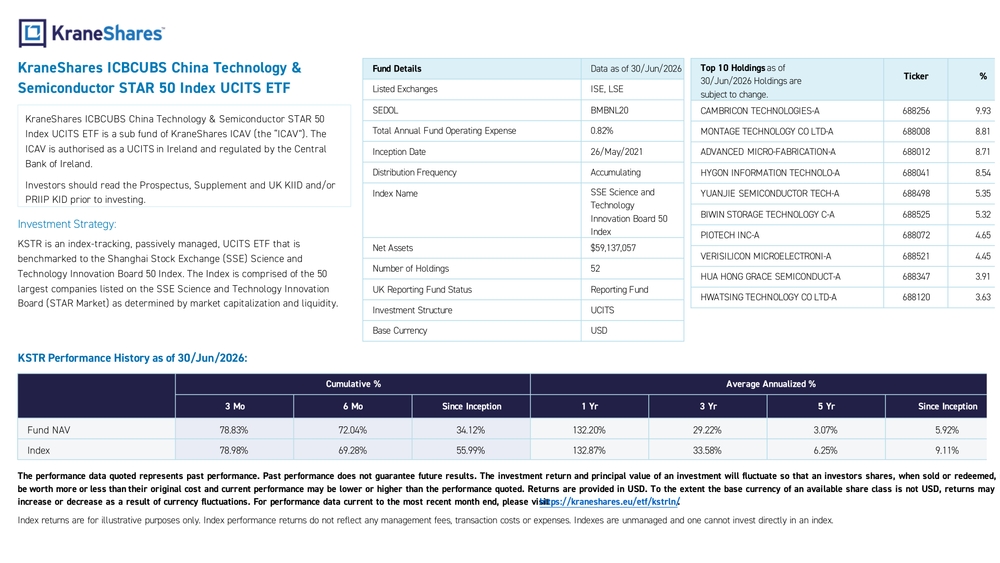
KraneShares ICBCUBS China Technology & Semiconductor STAR 50 Index UCITS ETF KraneShares ICBCUBS China Technology & Semiconductor STAR 50 Index UCITS ETF isasub fund ofKraneShares ICAV (the“ICAV”). The ICAV isauthorised asa UCITS inIreland andregulated bytheCentral Bank ofIreland. Investors should read theProspectus, Supplement andUKKIID and/or PRIIP KIDprior toinvesting. Investment Strategy: KSTR isanindex -tracking, passively managed, UCITS ETFthat is benchmarked totheShanghai Stock Exchange (SSE) Science and Technology Innovation Board 50Index. TheIndex iscomprised ofthe50 largest companies listed ontheSSE Science andTechnology Innovation Board (STAR Market) asdetermined bymarket capitalization andliquidity.Fund Details Data as of 30/Jun/2026 Listed Exchanges ISE,LSE SEDOL BMBNL20 Total Annual Fund Operating Expense 0.82% Inception Date 26/May/2021 Distribution Frequency Accumulating Index Name SSE Science and Technology Innovation Board 50 Index Net Assets $59,137,057 Number ofHoldings 52 UKReporting Fund Status Reporting Fund Investment Structure UCITS Base Currency USDTop10Holdings asof 30/Jun/2026 Holdings are subject tochange.Ticker % CAMBRICON TECHNOLOGIES -A 688256 9.93 MONTAGE TECHNOLOGY COLTD-A 688008 8.81 ADVANCED MICRO -FABRICATION -A 688012 8.71 HYGON INFORMATION TECHNOLO -A 688041 8.54 YUANJIE SEMICONDUCTOR TECH -A 688498 5.35 BIWIN STORAGE TECHNOLOGY C-A 688525 5.32 PIOTECH INC-A 688072 4.65 VERISILICON MICROELECTRONI -A 688521 4.45 HUA HONG GRACE SEMICONDUCT -A 688347 3.91 HWATSING TECHNOLOGY COLTD-A 688120 3.63 KSTR Performance History asof30/Jun/2026: Cumulative % Average Annualized % 3Mo 6Mo Since Inception 1Yr 3Yr 5Yr Since Inception Fund NAV 78.83% 72.04% 34.12% 132.20% 29.22% 3.07% 5.92% Index 78.98% 69.28% 55.99% 132.87% 33.58% 6.25% 9.11% Theperformance data quoted represents past performance. Past performance does notguarantee future results. Theinvestment return andprincipal value ofaninvestment willfluctuate sothat aninvestors shares, when sold orredeemed, may beworth more orless than their original cost andcurrent performance may belower orhigher than theperformance quoted. Returns areprovided inUSD. Totheextent thebase currency ofanavailable share class isnotUSD, returns may increase ordecrease asaresult ofcurrency fluctuations. Forperformance data current tothemost recent month end, please visit https://kraneshares.eu/etf/kstrln/ . Index returns are for illustrative purposes only. Index performance returns do not reflect any management fees, transaction costs or expenses. Indexes are unmanaged and one cannot invest directly in an index.
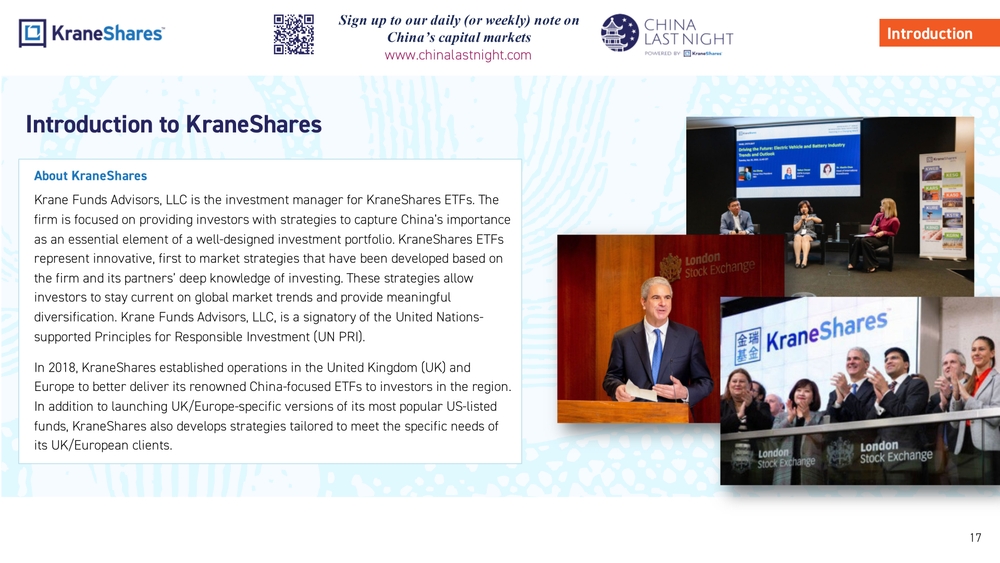
Introduction to KraneShares About KraneShares Krane Funds Advisors, LLC is the investment manager for KraneShares ETFs. The firm is focused on providing investors with strategies to capture China’s importance as an essential element of a well -designed investment portfolio. KraneShares ETFs represent innovative, first to market strategies that have been developed based on the firm and its partners’ deep knowledge of investing. These strategies allow investors to stay current on global market trends and provide meaningful diversification. Krane Funds Advisors, LLC, is a signatory of the United Nations- supported Principles for Responsible Investment (UN PRI). In 2018, KraneShares established operations in the United Kingdom (UK) and Europe to better deliver its renowned China -focused ETFs to investors in the region. In addition to launching UK/Europe -specific versions of its most popular US -listed funds, KraneShares also develops strategies tailored to meet the specific needs of its UK/European clients. Introduction Sign up to our daily (or weekly) note on China’s capital markets www.chinalastnight.com 17
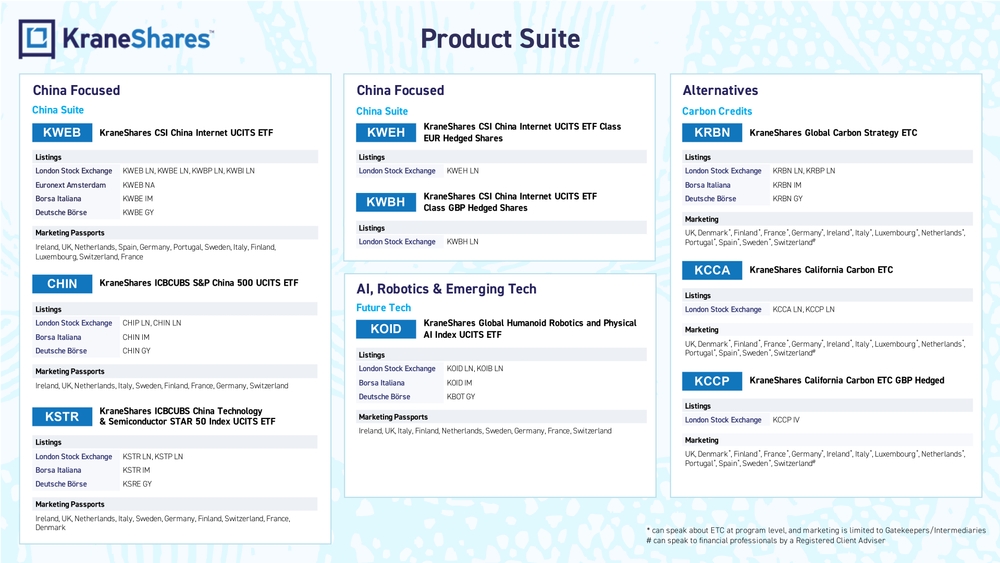
China Focused Alternatives AI, Robotics & Emerging TechChina Suite Future TechCarbon CreditsProduct Suite KraneShares Global Carbon Strategy ETC KRBN KCCA KraneShares California Carbon ETC KCCP KraneShares California Carbon ETC GBP HedgedChina Focused China Suite Listings London Stock Exchange KWEB LN, KWBE LN, KWBP LN, KWBI LN Euronext Amsterdam KWEB NA Borsa Italiana KWBE IM Deutsche Börse KWBE GY Marketing Passports Ireland, UK, Netherlands, Spain, Germany, Portugal, Sweden, Italy, Finland, Luxembourg, Switzerland, France Listings London Stock Exchange CHIP LN, CHIN LN Borsa Italiana CHIN IM Deutsche Börse CHIN GY Marketing PassportsIreland, UK, Netherlands, Italy, Sweden, Finland, France, Germany, Switzerland Listings London Stock Exchange KSTR LN, KSTP LN Borsa Italiana KSTR IM Deutsche Börse KSRE GY Marketing PassportsIreland, UK, Netherlands, Italy, Sweden, Germany, Finland, Switzerland, France, DenmarkKWEHKraneShares CSI China Internet UCITS ETF Class EUR Hedged Shares Listings London Stock Exchange KWEH LN KWBHKraneShares CSI China Internet UCITS ETF Class GBP Hedged Shares Listings London Stock Exchange KWBH LN KOIDKraneShares Global Humanoid Robotics and Physical AI Index UCITS ETF Listings London Stock Exchange KOID LN, KOIB LN Borsa Italiana KOID IM Deutsche Börse KBOT GY Marketing Passports Ireland, UK, Italy, Finland, Netherlands, Sweden, Germany, France, SwitzerlandListingsLondon Stock Exchange KRBN LN, KRBP LN Borsa Italiana KRBN IM Deutsche Börse KRBN GY Marketing UK, Denmark , Finland, France*, Germany*, Ireland*, Italy*, Luxembourg*, Netherlands*, Portugal*, Spain*, Sweden*, Switzerland# ListingsLondon Stock Exchange KCCA LN, KCCP LN Marketing UK, Denmark , Finland, France*, Germany*, Ireland*, Italy*, Luxembourg*, Netherlands*, Portugal*, Spain*, Sweden*, Switzerland# Listings London Stock Exchange KCCP IV Marketing UK, Denmark*, Finland*, France*, Germany*, Ireland*, Italy*, Luxembourg*, Netherlands*, Portugal*, Spain*, Sweden*, Switzerland#KSTRKraneShares ICBCUBS China Technology & Semiconductor STAR 50 Index UCITS ETFKraneShares ICBCUBS S&P China 500 UCITS ETF CHINKWEB KraneShares CSI China Internet UCITS ETF
- can speak about ETC at program level, and marketing is limited to Gatekeepers/Intermediaries
can speak to financial professionals by a Registered Client Adviser
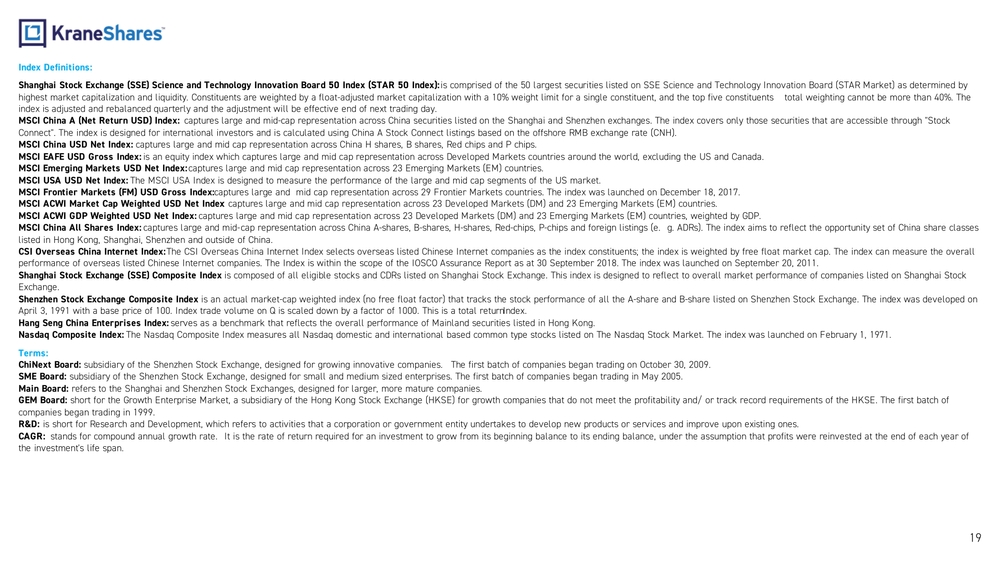
19Index Definitions:
Shanghai Stock Exchange (SSE) Science and Technology Innovation Board 50 Index (STAR 50 Index): is comprised of the 50 largest securities listed on SSE Science and Technology Innovation Board (STAR Market) as determined by
highest market capitalization and liquidity. Constituents are weighted by a float -adjusted market capitalization with a 10% weig ht limit for a single constituent, and the top five constituents total weighting cannot be more than 40%. The
index is adjusted and rebalanced quarterly and the adjustment will be effective end of next trading day.
MSCI China A (Net Return USD) Index: captures large and mid -cap representation across China securities listed on the Shanghai and Shenzhen exchanges. The index cover s only those securities that are accessible through "Stock
Connect". The index is designed for international investors and is calculated using China A Stock Connect listings based on t he offshore RMB exchange rate (CNH).
MSCI China USD Net Index: captures large and mid cap representation across China H shares, B shares, Red chips and P chips.
MSCI EAFE USD Gross Index: is an equity index which captures large and mid cap representation across Developed Markets countries around the world, exclu ding the US and Canada.
MSCI Emerging Markets USD Net Index: captures large and mid cap representation across 23 Emerging Markets (EM) countries.
MSCI USA USD Net Index: The MSCI USA Index is designed to measure the performance of the large and mid cap segments of the US market.
MSCI Frontier Markets (FM) USD Gross Index: captures large and mid cap representation across 29 Frontier Markets countries. The index was launched on December 18, 2017.
MSCI ACWI Market Cap Weighted USD Net Index : captures large and mid cap representation across 23 Developed Markets (DM) and 23 Emerging Markets (EM) countries.
MSCI ACWI GDP Weighted USD Net Index : captures large and mid cap representation across 23 Developed Markets (DM) and 23 Emerging Markets (EM) countries, weighted by G DP.
MSCI China All Shares Index : captures large and mid -cap representation across China A‐shares, B‐shares, H‐shares, Red‐chips, P‐chips and foreign listings (e. g. ADRs). The index aims to reflect the opportunity set of China share classes
listed in Hong Kong, Shanghai, Shenzhen and outside of China.CSI Overseas China Internet Index: The CSI Overseas China Internet Index selects overseas listed Chinese Internet companies as the index constituents; the index is weighted by free float market cap. The index can measure the overall
performance of overseas listed Chinese Internet companies. The Index is within the scope of the IOSCO Assurance Report as at 30 September 2018. The index was launched on September 20, 2011.
Shanghai Stock Exchange (SSE) Composite Index is composed of all eligible stocks and CDRs listed on Shanghai Stock Exchange. This index is designed to reflect to overall m arket performance of companies listed on Shanghai Stock
Exchange.
Shenzhen Stock Exchange Composite Index is an actual market -cap weighted index (no free float factor) that tracks the stock performance of all the A- share and B -share l isted on Shenzhen Stock Exchange. The index was developed on
April 3, 1991 with a base price of 100. Index trade volume on Q is scaled down by a factor of 1000. This is a total return Index.
Hang Seng China Enterprises Index : serves as a benchmark that reflects the overall performance of Mainland securities listed in Hong Kong.
Nasdaq Composite Index: The Nasdaq Composite Index measures all Nasdaq domestic and international based common type stocks listed on The Nasdaq Stock Market. The index was launched on February 1, 1971.
Terms:
ChiNext Board: subsidiary of the Shenzhen Stock Exchange, designed for growing innovative companies. The first batch of companies began tra ding on October 30, 2009.
SME Board: subsidiary of the Shenzhen Stock Exchange, designed for small and medium sized enterprises. The first batch of companies bega n trading in May 2005.
Main Board: refers to the Shanghai and Shenzhen Stock Exchanges, designed for larger, more mature companies.
GEM Board: short for the Growth Enterprise Market, a subsidiary of the Hong Kong Stock Exchange (HKSE) for growth companies that do not meet the profitability and/ or track record requirements of the HKSE. The first batch of
companies began trading in 1999.R&D: is short for Research and Development, which refers to activities that a corporation or government entity undertakes to devel op new products or services and improve upon existing ones.
CAGR: stands for compound annual growth rate. It is the rate of return required for an investment to grow from its beginning balance to its ending balance, under the assumption that profits were reinvested at the end of each year of
the investment's life span.
Important Notes Carefully consider the Funds’ investment objectives, risk factors, charges and expenses before investing. This and additional information can be found in the Funds‘ full and summary prospectus, which may be obtained by visiting www.kraneshares.eu. Read the prospectus carefully before investing.Risk DisclosuresThe views and opinions expressed in this material are those of authors of the Krane Fund Advisors. These opinions have been g iven in faith, but are subject to change without notice. It is the responsibility of the investor to evaluate the accuracy, completeness and usefulness of any opinions, advice or other information provided. Instead, investors must buy and sell UCITS shares in the secondary market with the assistance of a stockbroker.UCITS ETF’s units / shares purchased on the secondary market cannot usually be sold directly back to UCITS ETF. Investors mus t buy and sell units / shares on a secondary market with the assistance of an intermediary (e.g. a stockbroker) and may incur fees for doing so. In addition, investors may pay more than the current net asset value when buying units / shares and may receive less than the current net asset value when selling them.UCITS shares are not individually redeemable with the issuing fund other than in large Creation Unit aggregations. In doing so, the investor may incur brokerage commissions and may pay more than net asset value (NAV) when buying and receive less than net asset value (NAV) when selling. The Net Asset Value per share is calc ulated in accordance with the “Determination of Net Asset Value” section of the prospectus, using the official closing price published by the relevant exchange. Shares are bought and sold at market pri ce which may or may not be consistent with NAV. Investing involves risk, including possible loss of principal. There can be no assurance that a Fund will achieve its stated obj ectives. The Funds are subject to political, social or economic instability within China which may cause decline in value. Fluctuations in currency of foreign countries may have an adverse effect to domestic currency values. Emerging markets involve heightened risk related to the same factors as well as increase volatility and lower trading volume. The ability of the Fund to achieve its respective investment objectives is dependent, in part, on the continuous availability of A Shares and the ability to obtain, if necessary, additional A Shares quota. If the Fund is unable to obtain sufficient exposure to limited availability of A Share quota, the Fund could seek exposure to the co mponent securities of the Underlying Index by investment in other types of securities. The Fund is subject to political, social or economic instability within China which may cause decline in value. E merging markets involve heightened risk related to the same factors as well as increase volatility and lower trading volume. Fluctuations in currency of foreign countries may have an adverse effect to domestic currency values. The Fund may invest in Initial Public Offerings (IPOs). Securities issued in IPOs have no trading history, and information about the companies may be available for very limited peri ods. In addition, the prices of securities sold in IPOs may be highly volatile. In addition, as the Fund increases in size, the impact of IPOs on the Fund’s performance will generally decrease. Narrowly focused investments typically exhibit higher volatility. The Fund’s assets are expected to be concentrated in a sector, industry, market, or group of concentrations to the extent that the Underlying Index has such concentrations. The securities or futures in that concentration could react similarly to market dev elopments. Thus, the Fund is subject to loss due to adverse occurrences that affect that concentration. In addition to the normal risks associated with investing, investments in smaller companies typica lly exhibit higher volatility. This material is for information only and does not constitute an offer or recommendation to buy or sell any investment, or subsc ribe to any investment management or advisory service. It is not, under any circumstances, intended for distribution to the general public. You are accessing information which constitutes a financial p romotion under section 21 of the Financial Services and Markets Act 2000 ("FSMA"). In relation to the United Kingdom, this information is only directed at, and may only be distributed to, persons who a re “Investment Professionals” (being persons having professional experience in matters relating to investments) within the meaning of article 19(5) of the FSMA (Financial Promotion) Order 2005 (the “Fi nancial Promotion Order ”), persons to whom any of paragraphs (2)(a) to (d) of article 49 (high net worth companies, unincorporated associations etc.) of the financial promotion order apply, or persons to whom distribution may otherwise lawfully be made. 20
Risk Disclosures Continued: Any investment, and investment activity or controlled activity, to which this information relates is available only to such p ersons and will be engaged in only with such persons. Persons that do not have professional experience should not rely or act upon this information unless they are persons to whom any of paragraphs (2)(a) to (d) of article 49 apply to whom distribution of this information may otherwise lawfully be made. In Switzerland, the Fund has appointed as Swiss Representative Waystone Fund Services (Switzerland) SA, Av. Villamont 17, 1005 Lausanne, Switzerland, Tel: +41 21 311 17 77, email: switzerland@waystone.com. The Fund’s paying agent is Helvetische Bank AG. In respect of the Shares distributed in or from Switzerland, the place of performance and jurisdiction is Lausanne (Switzerland). Although the information provided in this document has been obtained from sources which Krane Funds Advisors, LLC believes to be reliable, it does not guarantee accuracy of such information and such information may be incomplete or condensed. Krane Fund Advisors, LLC is appointed to act as investment manager in accordance with the requirements of the Central Bank. The Management Company may decide to terminate the agreements made for the marketing of the Fund in accordance with Article 93a of Directive 2009/65 /EC. The Fund’s indicative net asset value ( iNAV ) can be obtained during trading hours at https://www.londonstockexchange.com/stock/KSTR/kraneshares -icav/company -page . KIID and PRIIP documents are available in the language of any Member State where such fund is distributed and the prospectus is available only in English. For additional fund documentation, please visit www.waystone.com or www.kraneshares.eu . To view our Summary of Investor Rights, available only in English, please visit www.kraneshares.eu or click here . R_EU_KS 21