BUYO ETF: Private Equity ETF | KraneShares
by Kraneshares
Harnessing The Key Drivers Powering Private Equity Buyout Funds Through Public Equities
Overview of the KraneShares Man Buyout Beta Index ETF (Ticker: BUYO)
Date: 3/31/2026
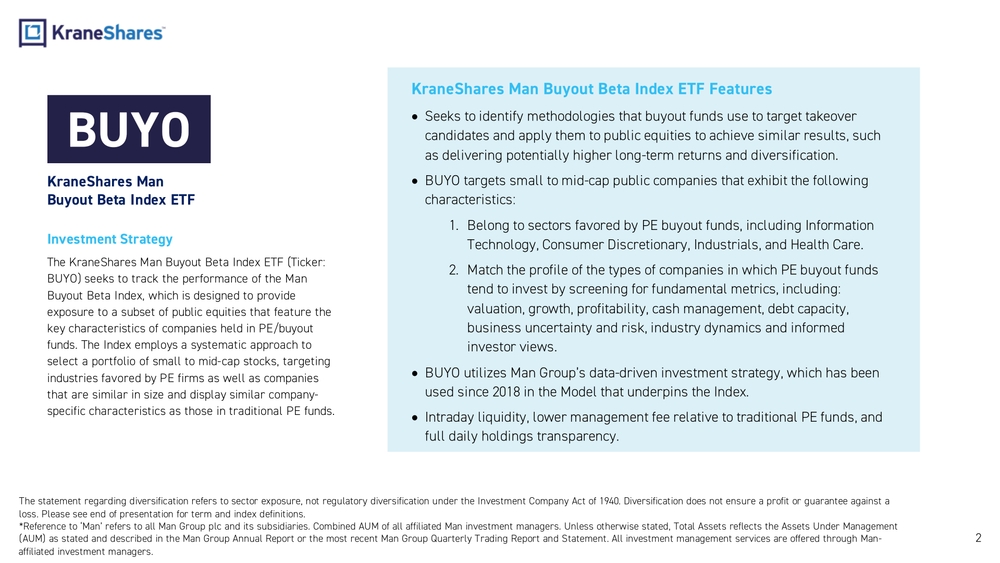
KraneShares Man Buyout Beta Index ETF
Investment Strategy
The KraneShares Man Buyout Beta Index ETF (Ticker: BUYO) seeks to track the performance of the Man Buyout Beta Index, which is designed to provide exposure to a subset of public equities that feature the key characteristics of companies held in PE/buyout funds. The Index employs a systematic approach to select a portfolio of small to mid-cap stocks, targeting industries favored by PE firms as well as companies that are similar in size and display similar company-specific characteristics as those in traditional PE funds.
KraneShares Man Buyout Beta Index ETF Features
- Seeks to identify methodologies that buyout funds use to target takeover candidates and apply them to public equities to achieve similar results, such as delivering potentially higher long-term returns and diversification.
- BUYO targets small to mid-cap public companies that exhibit the following characteristics:
- Belong to sectors favored by PE buyout funds, including Information Technology, Consumer Discretionary, Industrials, and Health Care.
- Match the profile of the types of companies in which PE buyout funds tend to invest by screening for fundamental metrics, including: valuation, growth, profitability, cash management, debt capacity, business uncertainty and risk, industry dynamics and informed investor views.
- BUYO utilizes Man Group's data-driven investment strategy, which has been used since 2018 in the Model that underpins the Index.
- Intraday liquidity, lower management fee relative to traditional PE funds, and full daily holdings transparency.
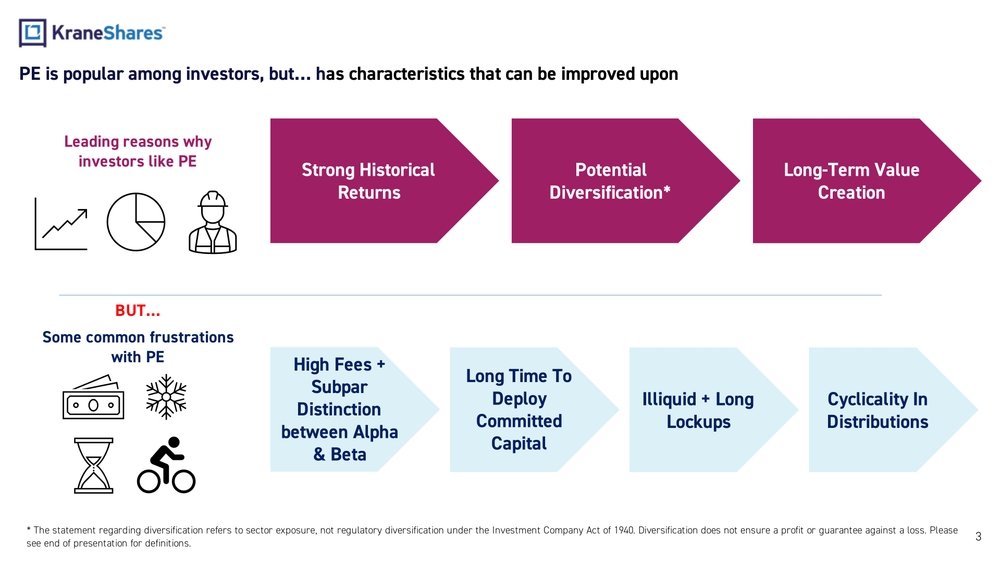
PE is popular among investors, but… has characteristics that can be improved upon
Leading reasons why investors like PE
- Strong Historical Returns
- Potential Diversification*
- Long-Term Value Creation
BUT… Some common frustrations with PE
- High Fees + Subpar Distinction between Alpha & Beta
- Long Time To Deploy Committed Capital
- Illiquid + Long Lockups
- Cyclicality In Distributions
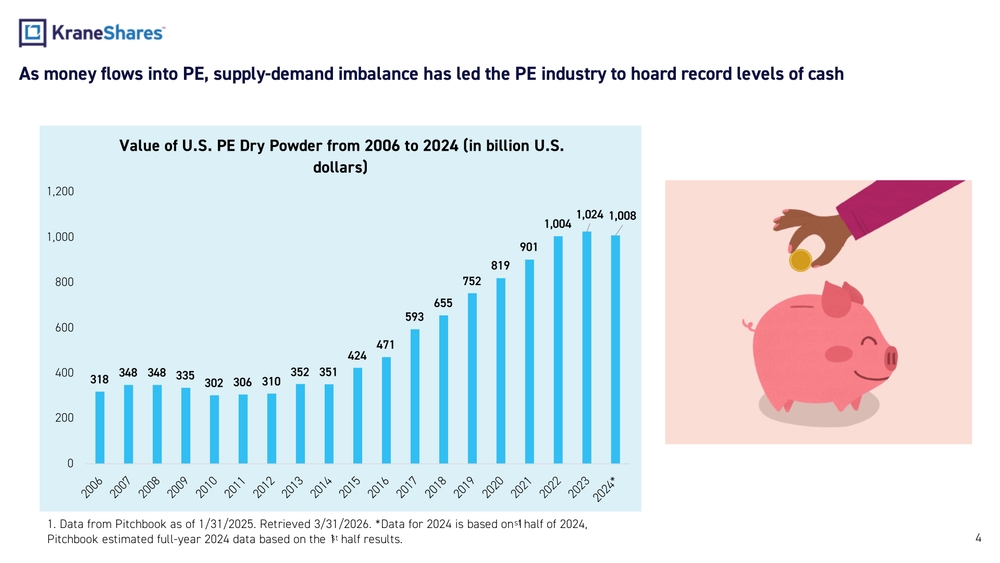
As money flows into PE, supply-demand imbalance has led the PE industry to hoard record levels of cash
Value of U.S. PE Dry Powder from 2006 to 2024 (in billion U.S. dollars)
| Year | Value ($ Billion) |
|---|---|
| 2006 | 318 |
| 2007 | 348 |
| 2008 | 348 |
| 2009 | 335 |
| 2010 | 302 |
| 2011 | 306 |
| 2012 | 310 |
| 2013 | 352 |
| 2014 | 351 |
| 2015 | 424 |
| 2016 | 471 |
| 2017 | 593 |
| 2018 | 655 |
| 2019 | 752 |
| 2020 | 819 |
| 2021 | 901 |
| 2022 | 1,004 |
| 2023 | 1,024 |
| 2024* | 1,008 |
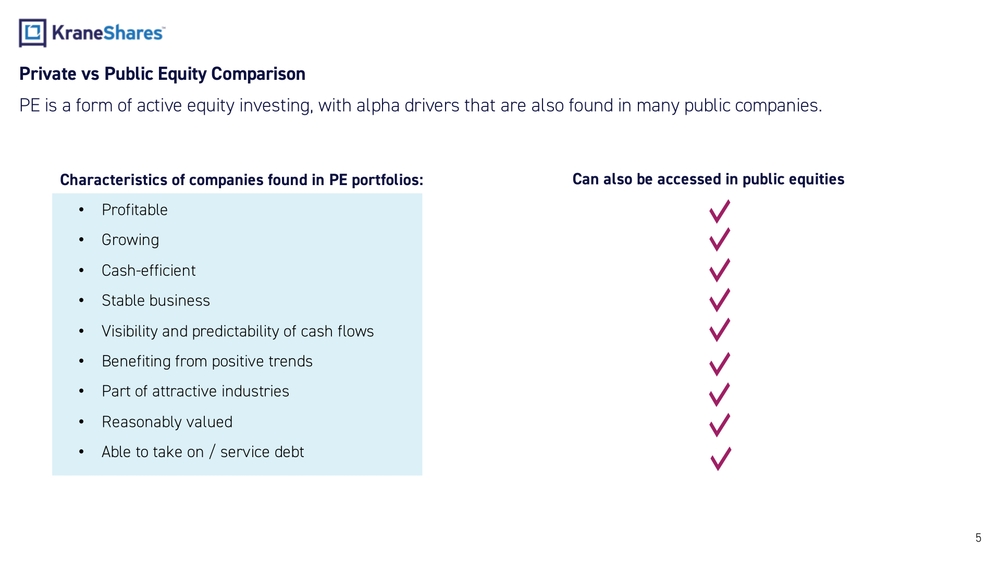
Private vs Public Equity Comparison
PE is a form of active equity investing, with alpha drivers that are also found in many public companies.
Characteristics of companies found in PE portfolios (Can also be accessed in public equities):
- Profitable
- Growing
- Cash-efficient
- Stable business
- Visibility and predictability of cash flows
- Benefiting from positive trends
- Part of attractive industries
- Reasonably valued
- Able to take on / service debt
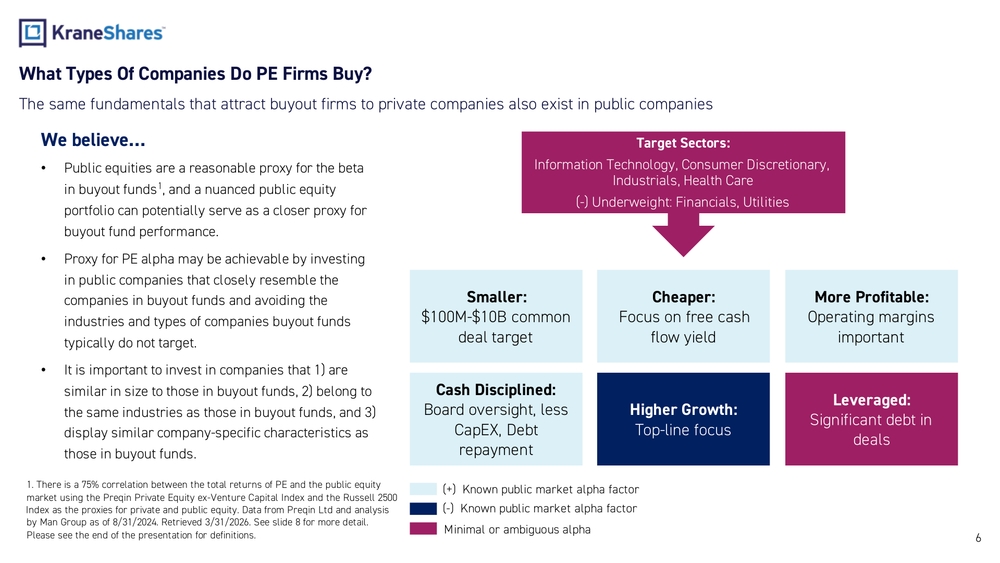
What Types Of Companies Do PE Firms Buy?
The same fundamentals that attract buyout firms to private companies also exist in public companies
We believe…
- Public equities are a reasonable proxy for the beta in buyout funds, and a nuanced public equity portfolio can potentially serve as a closer proxy for buyout fund performance.
- Proxy for PE alpha may be achievable by investing in public companies that closely resemble the companies in buyout funds and avoiding the industries and types of companies buyout funds typically do not target.
- It is important to invest in companies that 1) are similar in size to those in buyout funds, 2) belong to the same industries as those in buyout funds, and 3) display similar company-specific characteristics as those in buyout funds.
Target Sectors:
Information Technology, Consumer Discretionary, Industrials, Health Care (-) Underweight: Financials, Utilities
Company Characteristics Targeted:
- Smaller: $100M-$10B common deal target
- Cheaper: Focus on free cash flow yield
- More Profitable: Operating margins important
- Cash Disciplined: Board oversight, less CapEx, Debt repayment
- Higher Growth: Top-line focus
- Leveraged: Significant debt in deals
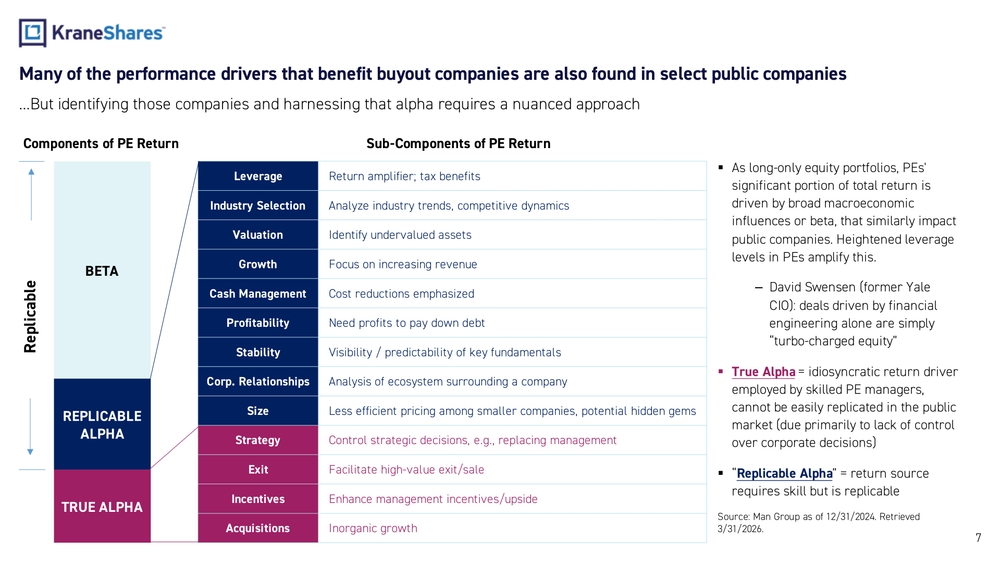
Many of the performance drivers that benefit buyout companies are also found in select public companies
…But identifying those companies and harnessing that alpha requires a nuanced approach
Components of PE Return
| Component | Sub-Component Description |
|---|---|
| Leverage | Return amplifier; tax benefits |
| Industry Selection | Analyze industry trends, competitive dynamics |
| Valuation | Identify undervalued assets |
| Growth | Focus on increasing revenue |
| Cash Management | Cost reductions emphasized |
| Profitability | Need profits to pay down debt |
| Stability | Visibility / predictability of key fundamentals |
| Corp. Relationships | Analysis of ecosystem surrounding a company |
| Size | Less efficient pricing among smaller companies, potential hidden gems |
| Strategy | Control strategic decisions, e.g., replacing management |
| Exit | Facilitate high-value exit/sale |
| Incentives | Enhance management incentives/upside |
| Acquisitions | Inorganic growth |
Key Definitions
- Beta: As long-only equity portfolios, PEs' significant portion of total return is driven by broad macroeconomic influences or beta, that similarly impact public companies. Heightened leverage levels in PEs amplify this. David Swensen (former Yale CIO): deals driven by financial engineering alone are simply "turbo-charged equity"
- True Alpha: Idiosyncratic return driver employed by skilled PE managers, cannot be easily replicated in the public market (due primarily to lack of control over corporate decisions)
- Replicable Alpha: Return source requires skill but is replicable
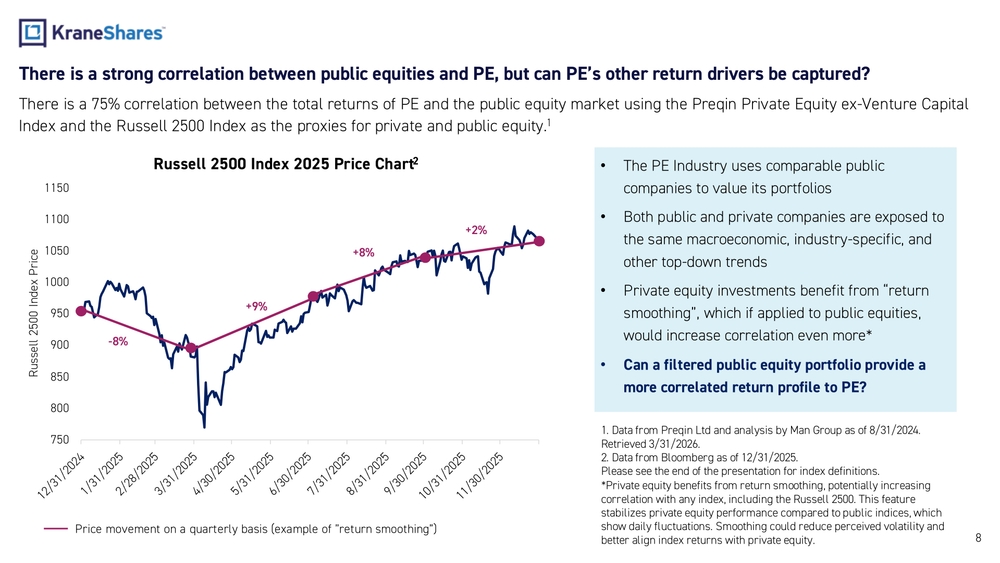
There is a strong correlation between public equities and PE, but can PE's other return drivers be captured?
There is a 75% correlation between the total returns of PE and the public equity market using the Preqin Private Equity ex-Venture Capital Index and the Russell 2500 Index as the proxies for private and public equity.
Russell 2500 Index 2025 Price Chart
Price movement on a quarterly basis (example of "return smoothing"):
- Q1: -8%
- Q2: +9%
- Q3: +8%
- Q4: +2%
Key Points
- The PE Industry uses comparable public companies to value its portfolios
- Both public and private companies are exposed to the same macroeconomic, industry-specific, and other top-down trends
- Private equity investments benefit from "return smoothing", which if applied to public equities, would increase correlation even more
- Can a filtered public equity portfolio provide a more correlated return profile to PE?
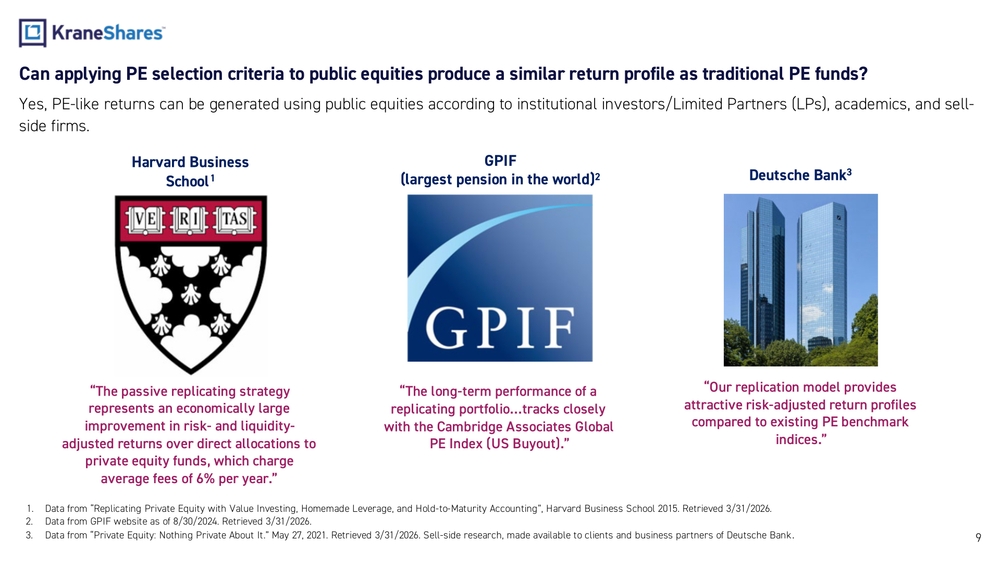
Can applying PE selection criteria to public equities produce a similar return profile as traditional PE funds?
Yes, PE-like returns can be generated using public equities according to institutional investors/Limited Partners (LPs), academics, and sell-side firms.
Harvard Business School
"The passive replicating strategy represents an economically large improvement in risk- and liquidity-adjusted returns over direct allocations to private equity funds, which charge average fees of 6% per year."
GPIF (largest pension in the world)
"The long-term performance of a replicating portfolio…tracks closely with the Cambridge Associates Global PE Index (US Buyout)."
Deutsche Bank
"Our replication model provides attractive risk-adjusted return profiles compared to existing PE benchmark indices."
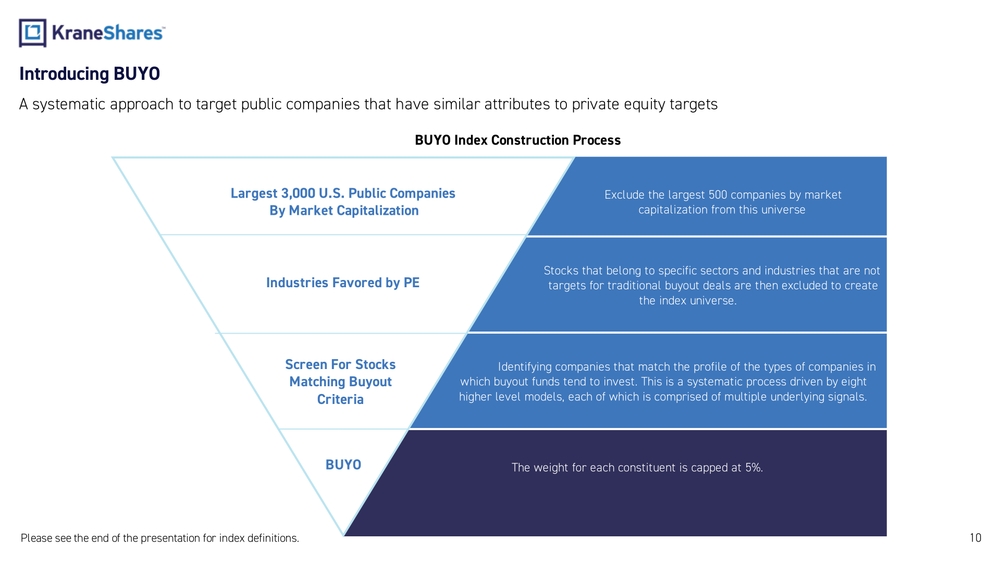
Introducing BUYO
A systematic approach to target public companies that have similar attributes to private equity targets
BUYO Index Construction Process
-
Largest 3,000 U.S. Public Companies By Market Capitalization
- Exclude the largest 500 companies by market capitalization from this universe
-
Industries Favored by PE
- Stocks that belong to specific sectors and industries that are not targets for traditional buyout deals are then excluded to create the index universe.
-
Screen For Stocks Matching Buyout Criteria
- Identifying companies that match the profile of the types of companies in which buyout funds tend to invest. This is a systematic process driven by eight higher level models, each of which is comprised of multiple underlying signals.
-
BUYO
- The weight for each constituent is capped at 5%.
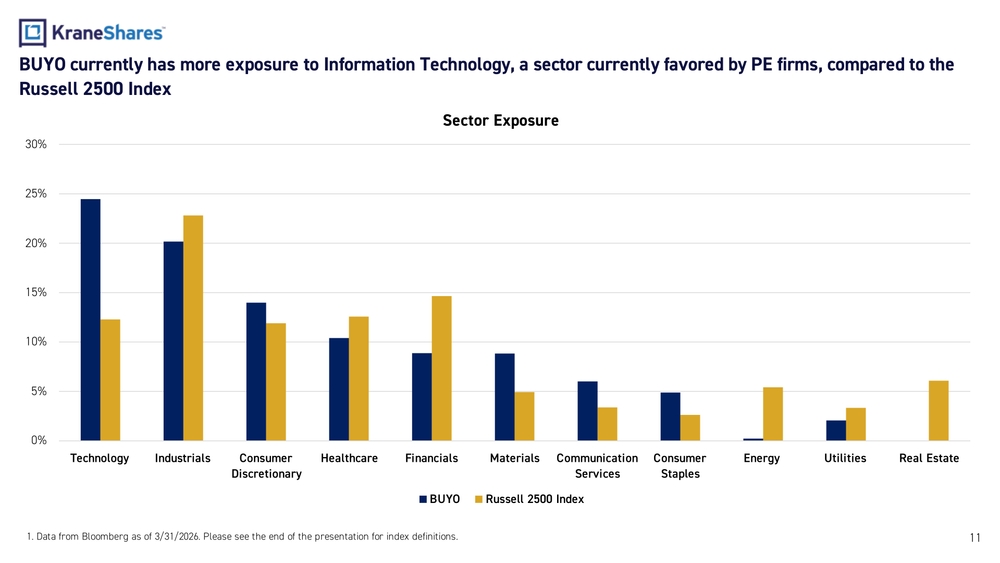
BUYO currently has more exposure to Information Technology, a sector currently favored by PE firms, compared to the Russell 2500 Index
Sector Exposure
| Sector | BUYO | Russell 2500 Index |
|---|---|---|
| Technology | ~25% | ~12% |
| Industrials | ~20% | ~23% |
| Consumer Discretionary | ~14% | ~12% |
| Healthcare | ~11% | ~13% |
| Financials | ~9% | ~15% |
| Materials | ~9% | ~5% |
| Communication Services | ~6% | ~3% |
| Consumer Staples | ~5% | ~3% |
| Energy | ~1% | ~5% |
| Utilities | ~2% | ~3% |
| Real Estate | ~0% | ~6% |
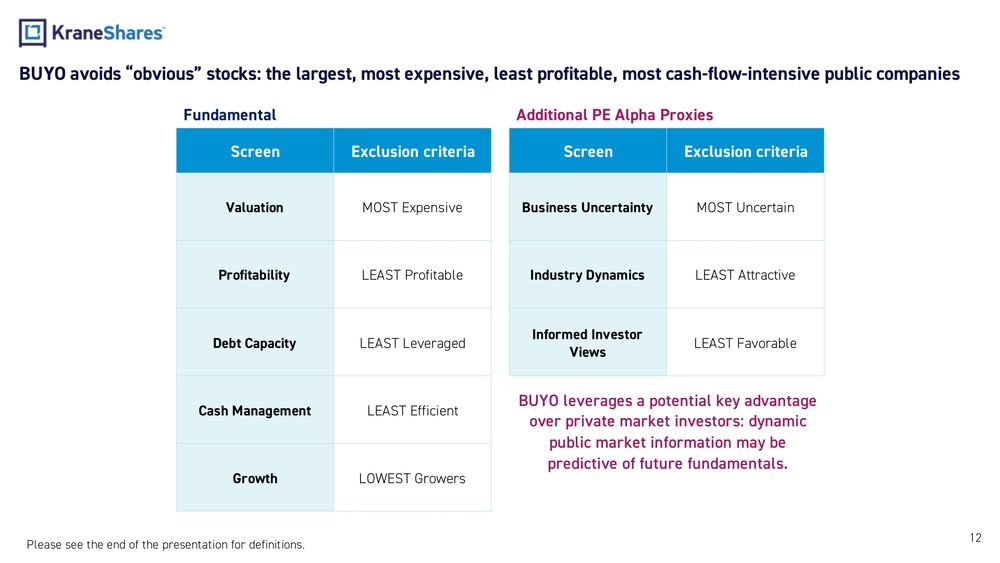
BUYO avoids "obvious" stocks: the largest, most expensive, least profitable, most cash-flow-intensive public companies
Fundamental
| Screen | Exclusion Criteria |
|---|---|
| Valuation | MOST Expensive |
| Profitability | LEAST Profitable |
| Debt Capacity | LEAST Leveraged |
| Cash Management | LEAST Efficient |
| Growth | LOWEST Growers |
Additional PE Alpha Proxies
| Screen | Exclusion Criteria |
|---|---|
| Business Uncertainty | MOST Uncertain |
| Industry Dynamics | LEAST Attractive |
| Informed Investor Views | LEAST Favorable |
BUYO leverages a potential key advantage over private market investors: dynamic public market information may be predictive of future fundamentals.
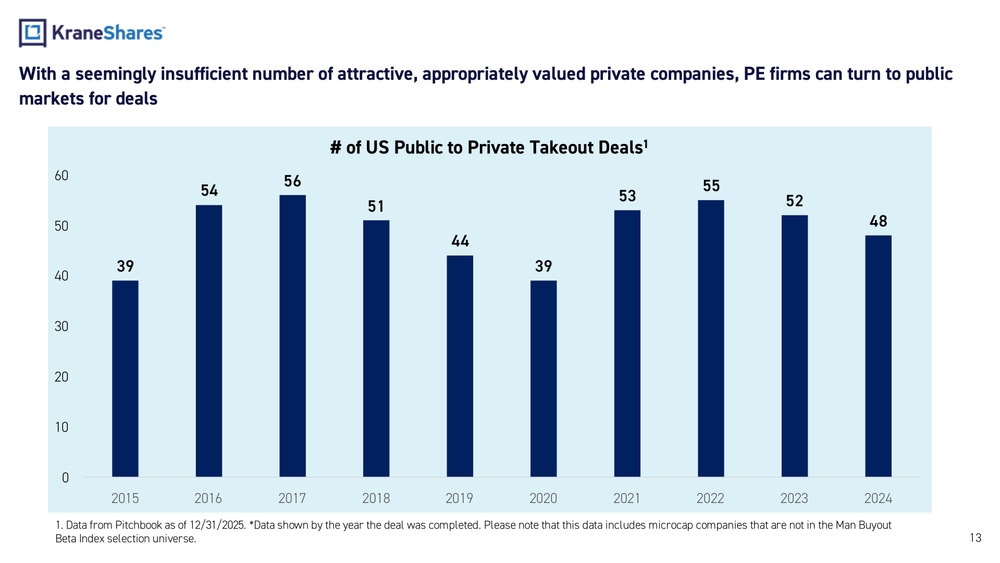
With a seemingly insufficient number of attractive, appropriately valued private companies, PE firms can turn to public markets for deals
# of US Public to Private Takeout Deals
| Year | Number of Deals |
|---|---|
| 2015 | 39 |
| 2016 | 54 |
| 2017 | 56 |
| 2018 | 51 |
| 2019 | 44 |
| 2020 | 39 |
| 2021 | 53 |
| 2022 | 55 |
| 2023 | 52 |
| 2024 | 48 |
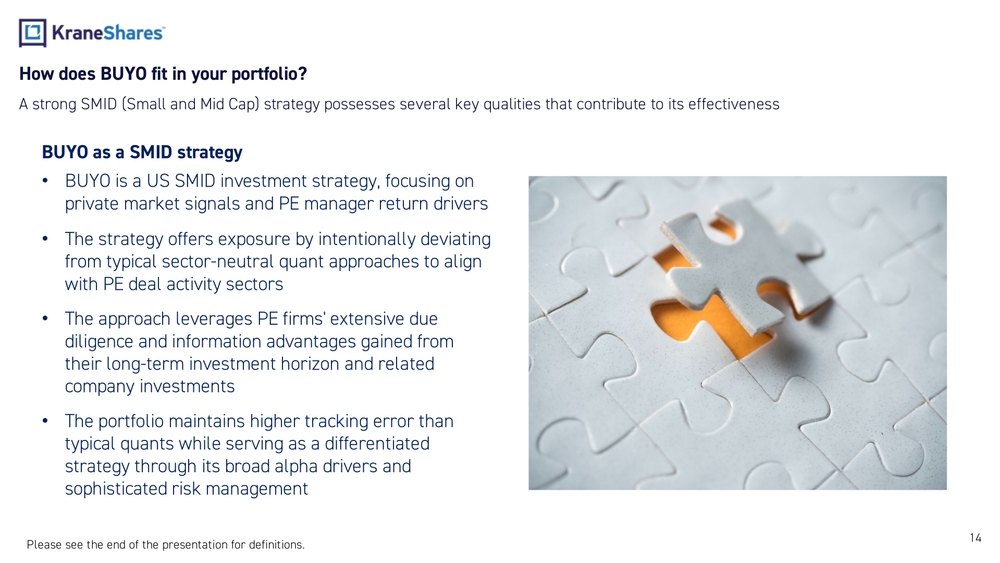
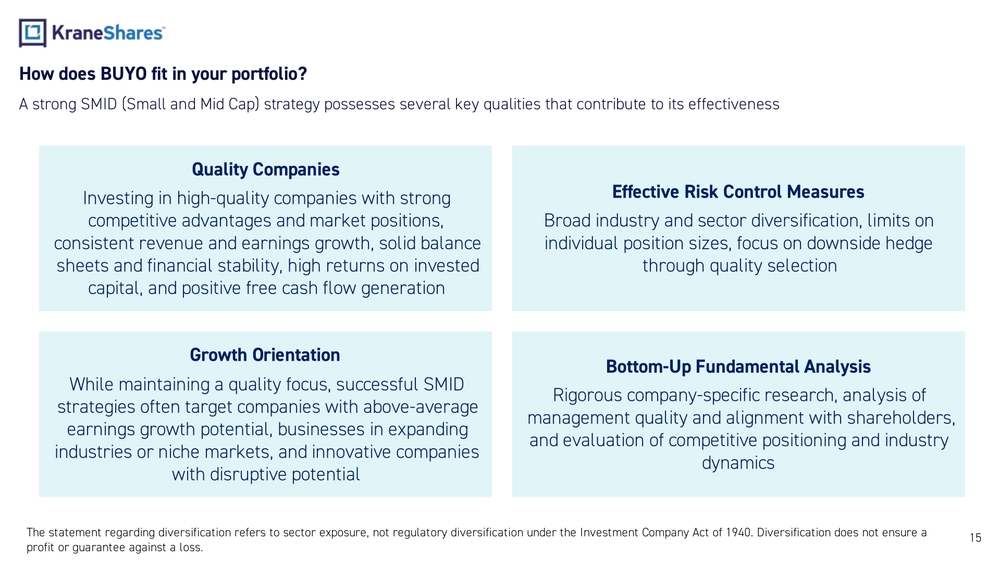
How does BUYO fit in your portfolio?
A strong SMID (Small and Mid Cap) strategy possesses several key qualities that contribute to its effectiveness
BUYO as a SMID strategy
- BUYO is a US SMID investment strategy, focusing on private market signals and PE manager return drivers
- The strategy offers exposure by intentionally deviating from typical sector-neutral quant approaches to align with PE deal activity sectors
- The approach leverages PE firms' extensive due diligence and information advantages gained from their long-term investment horizon and related company investments
- The portfolio maintains higher tracking error than typical quants while serving as a differentiated strategy through its broad alpha drivers and sophisticated risk management
How does BUYO fit in your portfolio?
A strong SMID (Small and Mid Cap) strategy possesses several key qualities that contribute to its effectiveness
Quality Companies
Investing in high-quality companies with strong competitive advantages and market positions, consistent revenue and earnings growth, solid balance sheets and financial stability, high returns on invested capital, and positive free cash flow generation
Effective Risk Control Measures
Broad industry and sector diversification, limits on individual position sizes, focus on downside hedge through quality selection
Growth Orientation
While maintaining a quality focus, successful SMID strategies often target companies with above-average earnings growth potential, businesses in expanding industries or niche markets, and innovative companies with disruptive potential
Bottom-Up Fundamental Analysis
Rigorous company-specific research, analysis of management quality and alignment with shareholders, and evaluation of competitive positioning and industry dynamics
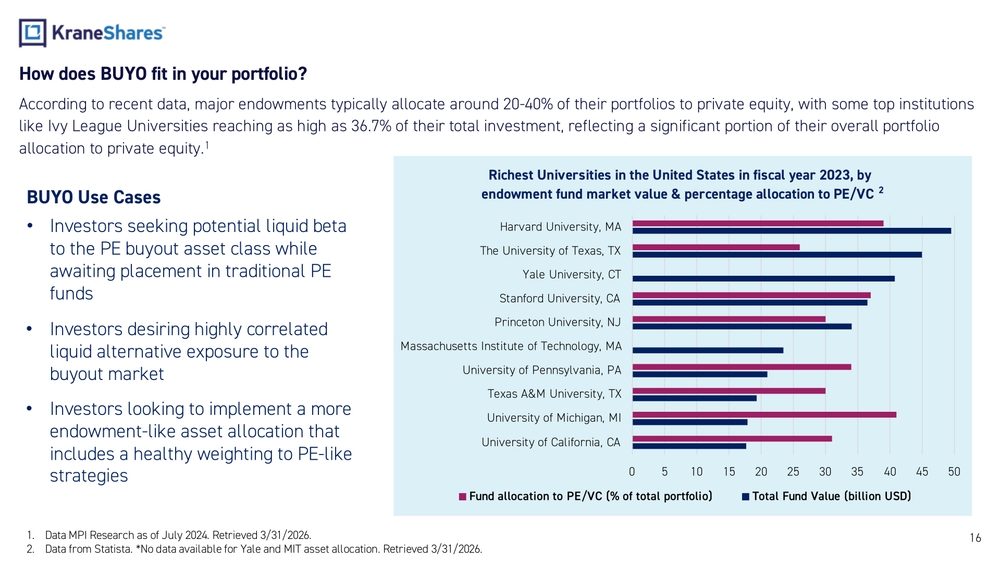
How does BUYO fit in your portfolio?
According to recent data, major endowments typically allocate around 20-40% of their portfolios to private equity, with some top institutions like Ivy League Universities reaching as high as 36.7% of their total investment, reflecting a significant portion of their overall portfolio allocation to private equity.
BUYO Use Cases
- Investors seeking potential liquid beta to the PE buyout asset class while awaiting placement in traditional PE funds
- Investors desiring highly correlated liquid alternative exposure to the buyout market
- Investors looking to implement a more endowment-like asset allocation that includes a healthy weighting to PE-like strategies
Richest Universities in the United States in fiscal year 2023, by endowment fund market value & percentage allocation to PE/VC
(Chart showing Harvard, University of Texas, Yale, Stanford, Princeton, MIT, University of Pennsylvania, Texas A&M, University of Michigan, University of California — ranked by total fund value and PE/VC allocation percentage)
Why BUYO?
- Multi-faceted approach to creating an investable beta for buyouts, targeting the actual drivers of buyout fund performance
- Not statistical replication or indirect exposure to PE performance drivers, like some peers
- Sub-advisor has 6+ year live Liquid PE track record & 35+ years of experience in systematic investing
- Fundamentally-based, disciplined, systematic approach
- Broad diversification across sectors, industries, and companies; sophisticated risk management
- Leverages data science and research capabilities, and broader infrastructure and resources of Man Group, a $174.9B investment manager
- Automated vintage diversification and exposure to PE return drivers without the PE fees
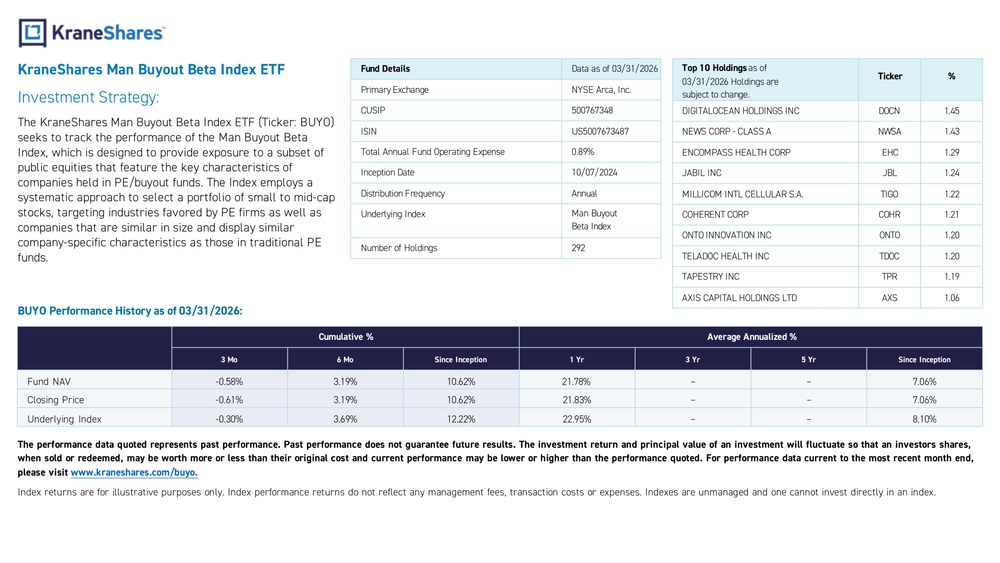
KraneShares Man Buyout Beta Index ETF
Investment Strategy
The KraneShares Man Buyout Beta Index ETF (Ticker: BUYO) seeks to track the performance of the Man Buyout Beta Index, which is designed to provide exposure to a subset of public equities that feature the key characteristics of companies held in PE/buyout funds. The Index employs a systematic approach to select a portfolio of small to mid-cap stocks, targeting industries favored by PE firms as well as companies that are similar in size and display similar company-specific characteristics as those in traditional PE funds.
Fund Details (Data as of 03/31/2026)
| Field | Value |
|---|---|
| Primary Exchange | NYSE Arca, Inc. |
| CUSIP | 500767348 |
| ISIN | US5007673487 |
| Total Annual Fund Operating Expense | 0.89% |
| Inception Date | 10/07/2024 |
| Distribution Frequency | Annual |
| Underlying Index | Man Buyout Beta Index |
| Number of Holdings | 292 |
Top 10 Holdings as of 03/31/2026
| Holding | Ticker | % |
|---|---|---|
| DIGITALOCEAN HOLDINGS INC | DOCN | 1.45 |
| NEWS CORP - CLASS A | NWSA | 1.43 |
| ENCOMPASS HEALTH CORP | EHC | 1.29 |
| JABIL INC | JBL | 1.24 |
| MILLICOM INTL CELLULAR S.A. | TIGO | 1.22 |
| COHERENT CORP | COHR | 1.21 |
| ONTO INNOVATION INC | ONTO | 1.20 |
| TELADOC HEALTH INC | TDOC | 1.20 |
| TAPESTRY INC | TPR | 1.19 |
| AXIS CAPITAL HOLDINGS LTD | AXS | 1.06 |
BUYO Performance History as of 03/31/2026
| 3 Mo | 6 Mo | Since Inception (Cumulative) | 1 Yr | 3 Yr | 5 Yr | Since Inception (Annualized) | |
|---|---|---|---|---|---|---|---|
| Fund NAV | -0.58% | 3.19% | 10.62% | 21.78% | – | – | 7.06% |
| Closing Price | -0.61% | 3.19% | 10.62% | 21.83% | – | – | 7.06% |
| Underlying Index | -0.30% | 3.69% | 12.22% | 22.95% | – | – | 8.10% |
KraneShares
Empowering investors with access to the world's most powerful growth themes through ETFs, private strategies, and innovative investment solutions.
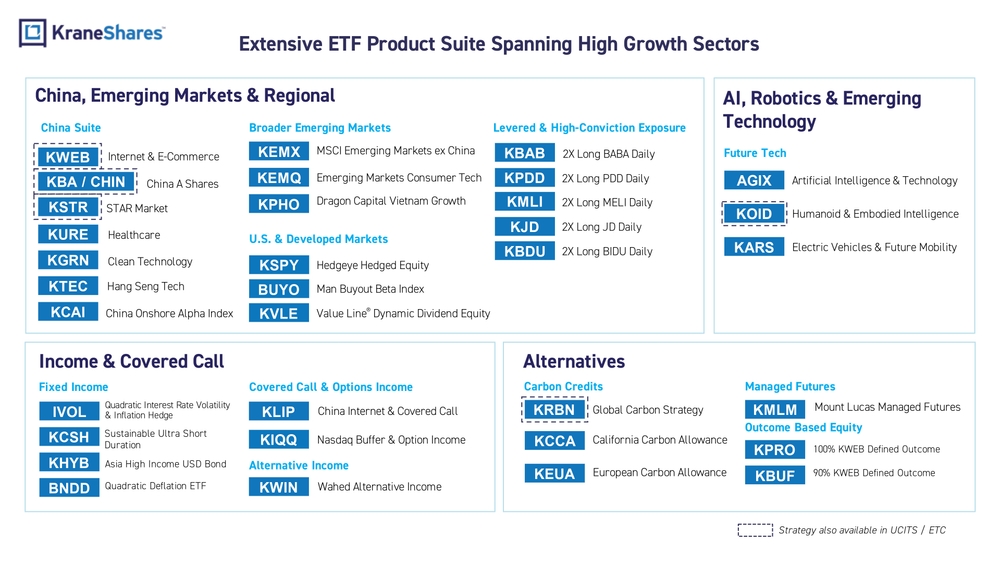
Extensive ETF Product Suite Spanning High Growth Sectors
China, Emerging Markets & Regional
China Suite
- KWEB – Internet & E-Commerce
- KBA / CHIN – China A Shares
- KSTR – STAR Market
- KURE – Healthcare
- KGRN – Clean Technology
- KTEC – Hang Seng Tech
- KCAI – China Onshore Alpha Index
Broader Emerging Markets
- KEMQ – Emerging Markets Consumer Tech
- KPHO – Dragon Capital Vietnam Growth
- KEMX – MSCI Emerging Markets ex China
U.S. & Developed Markets
- KVLE – Value Line® Dynamic Dividend Equity
- KSPY – Hedgeye Hedged Equity
- BUYO – Man Buyout Beta Index
Levered & High-Conviction Exposure
- KBAB – 2X Long BABA Daily
- KPDD – 2X Long PDD Daily
- KMLI – 2X Long MELI Daily
- KJD – 2X Long JD Daily
- KBDU – 2X Long BIDU Daily
AI, Robotics & Emerging Technology
Future Tech
- AGIX – Artificial Intelligence & Technology
- KOID – Humanoid & Embodied Intelligence
- KARS – Electric Vehicles & Future Mobility
Income & Covered Call
Fixed Income
- IVOL – Quadratic Interest Rate Volatility & Inflation Hedge
- KCSH – Sustainable Ultra Short Duration
- KHYB – Asia High Income USD Bond
- BNDD – Quadratic Deflation ETF
Covered Call & Options Income
- KLIP – China Internet & Covered Call
- KIQQ – Nasdaq Buffer & Option Income
Alternative Income
- KWIN – Wahed Alternative Income
Alternatives
Carbon Credits
- KRBN – Global Carbon Strategy
- KCCA – California Carbon Allowance
- KEUA – European Carbon Allowance
Managed Futures
- KMLM – Mount Lucas Managed Futures
Outcome Based Equity
- KPRO – 100% KWEB Defined Outcome
- KBUF – 90% KWEB Defined Outcome
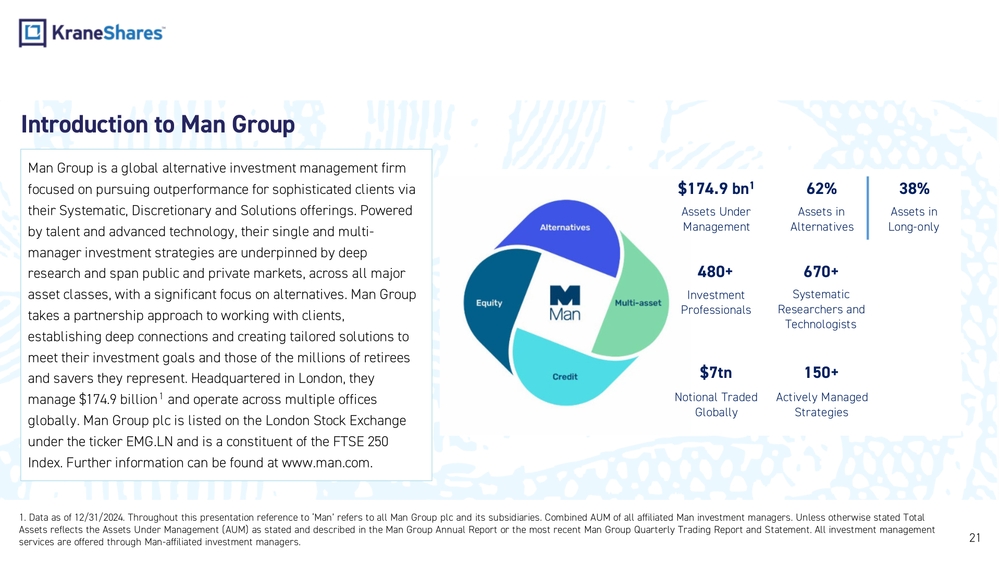
Introduction to Man Group
Man Group is a global alternative investment management firm focused on pursuing outperformance for sophisticated clients via their Systematic, Discretionary and Solutions offerings. Powered by talent and advanced technology, their single and multi-manager investment strategies are underpinned by deep research and span public and private markets, across all major asset classes, with a significant focus on alternatives. Man Group takes a partnership approach to working with clients, establishing deep connections and creating tailored solutions to meet their investment goals and those of the millions of retirees and savers they represent. Headquartered in London, they manage $174.9 billion and operate across multiple offices globally. Man Group plc is listed on the London Stock Exchange under the ticker EMG.LN and is a constituent of the FTSE 250 Index. Further information can be found at www.man.com.
Key Statistics
- $174.9 bn — Assets Under Management
- 62% — Assets in Alternatives
- 38% — Assets in Long-only
- 480+ — Investment Professionals
- 670+ — Systematic Researchers and Technologists
- $7tn — Notional Traded Globally
- 150+ — Actively Managed Strategies
Index Definitions
Russell 2500 Index: The Russell 2500 Index measures the performance of the 2,500 smallest companies in the Russell 3000 Index.
Preqin Private Equity ex-Venture Capital Index: The Preqin Private Equity ex-Venture Capital Index represents the returns on committed capital in private equity partnerships. It includes the amount of money invested in these partnerships and the returns that outstanding commitments would generate if invested risk-free.
Term Definitions
Free cash flow yield (FCFY): Free cash flow yield is a financial metric that compares a company's cash flow to its overall valuation. It's a key indicator of a company's financial health and performance, and is used by investors to assess how well a company can meet its financial obligations.
Operating margins: In business, operating margin—also known as operating income margin, operating profit margin, EBIT margin and return on sales—is the ratio of operating income to net sales, usually expressed in percent. Net profit measures the profitability of ventures after accounting for all costs.
Capital Expenditure (CAPEX): Capital expenditure or capital expense is the money an organization or corporate entity spends to buy, maintain, or improve its fixed assets, such as buildings, vehicles, equipment, or land.
Alpha: Alpha is a financial term that measures how well an investment strategy, portfolio manager, or trader has performed relative to a benchmark or the market. It's also known as excess return or abnormal rate of return.
Beta: Beta measures an investment's volatility relative to the market and is used to quantify its risk. It's calculated as the slope of a security's returns regressed against a benchmark market index.
Tracking error: Tracking error is the standard deviation of the difference between a portfolio's returns and its benchmark's returns, measuring how closely the portfolio follows its benchmark over time. A higher tracking error indicates greater deviation from the benchmark, often due to active management decisions, while a lower tracking error suggests the portfolio closely mimics the benchmark.
Alpha drivers: Alpha drivers are investments or strategies designed to generate returns that are independent of the overall market, aiming to produce excess returns (alpha) through active management or unique sources of value. In portfolio construction, alpha drivers are contrasted with beta drivers, which track market movements, as alpha drivers seek to outperform regardless of market direction.
Important Notes
Carefully consider the Funds' investment objectives, risk factors, charges and expenses before investing. This and additional information can be found in the Funds' full and summary prospectus, which may be obtained by visiting www.kraneshares.com/buyo. Read the prospectus carefully before investing.
Risk Disclosures
Investing involves risk, including possible loss of principal. There can be no assurance that a Fund will achieve its stated objectives. Indices are unmanaged and do not include the effect of fees. One cannot invest directly in an index.
This information should not be relied upon as research, investment advice, or a recommendation regarding any products, strategies, or any security in particular. This material is strictly for illustrative, educational, or informational purposes and is subject to change.
The Underlying Index uses Numeric models in its methodology, which depend on various data sources that may be inaccurate or incomplete, rendering the models potentially unreliable. Historical market data may not predict future price movements, and unusual market events can lead to unexpected outcomes. Models may also have hidden biases and could incur losses if actual events diverge from their assumptions. Additionally, performance may be affected by software issues or programming errors. While the Underlying Index aims to reflect private equity performance and risk like private equity buyout funds, there is no guarantee that public equities will achieve this exposure or that the models will effectively provide it.
The Fund may invest in derivatives, which are often more volatile than other investments and may magnify the Fund's gains or losses. A derivative (i.e., futures/forward contracts, swaps, and options) is a contract that derives its value from the performance of an underlying asset. The primary risk of derivatives is that changes in the asset's market value and the derivative may not be proportionate, and some derivatives can have the potential for unlimited losses. Derivatives are also subject to liquidity and counterparty risk.
The Fund is new and does not yet have a significant number of shares outstanding. If the Fund does not grow in size, it will be at greater risk than larger funds of wider bid-ask spreads for its shares, trading at a greater premium or discount to NAV, liquidation and/or a trading halt. Narrowly focused investments typically exhibit higher volatility. BUYO is non-diversified.
ETF shares are bought and sold on an exchange at market price (not NAV) and are not individually redeemed from the Fund. However, shares may be redeemed at NAV directly by certain authorized broker-dealers (Authorized Participants) in very large creation/redemption units. The KraneShares ETFs and KFA Funds ETFs are distributed by SEI Investments Distribution Company (SIDCO), 1 Freedom Valley Drive, Oaks, PA 19456, which is not affiliated with Krane Funds Advisors, LLC, the Investment Adviser for the Funds, or any sub-advisers for the Funds.