AI ETF Overview | AGIX | Artificial Intelligence ETF
by Kraneshares
New Opportunities From The Generative AI Ecosystem & Beyond
Overview of the KraneShares Artificial Intelligence & Technology ETF (Ticker: AGIX)
Introduction to KraneShares
About KraneShares
Krane Funds Advisors, LLC is a specialist investment manager focused on China, Climate, and Alternative assets. KraneShares seeks to provide innovative, high conviction, and first to market strategies. The firm was founded in 2013 and manages for institutions and individuals globally. The firm is a signatory of the United Nations-supported Principles for Responsible Investment (UN PRI).
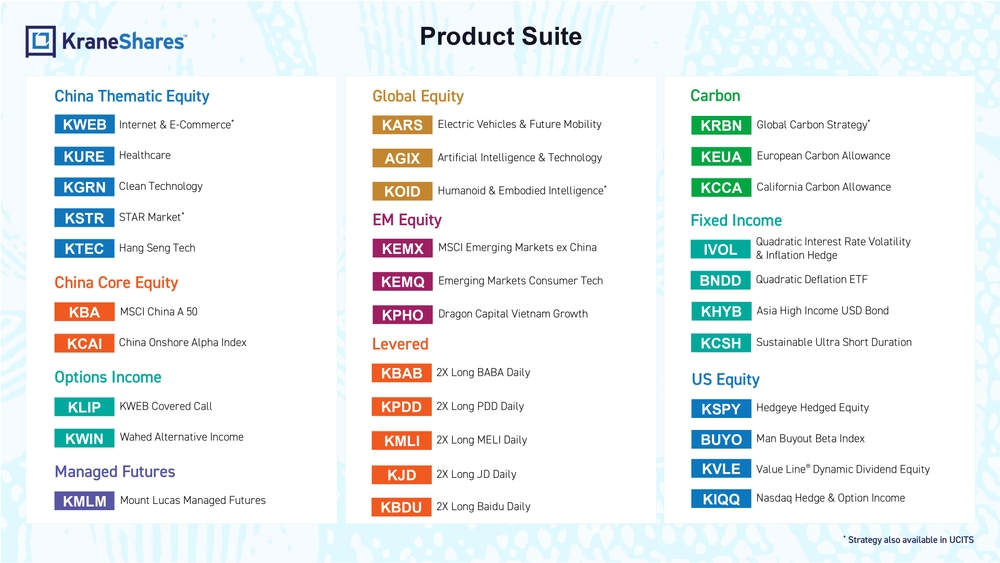
Product Suite
China Thematic Equity
- KWEB: Internet & E-Commerce*
- KURE: Healthcare
- KGRN: Clean Technology
- KSTR: STAR Market*
- KTEC: Hang Seng Tech
China Core Equity
- KBA: MSCI China A 50
- KCAI: China Onshore Alpha Index
Options Income
- KLIP: KWEB Covered Call
- KWIN: Wahed Alternative Income
Managed Futures
- KMLM: Mount Lucas Managed Futures
Global Equity
- KARS: Electric Vehicles & Future Mobility
- AGIX: Artificial Intelligence & Technology
- KOID: Humanoid & Embodied Intelligence*
EM Equity
- KEMX: MSCI Emerging Markets ex China
- KEMQ: Emerging Markets Consumer Tech
- KPHO: Dragon Capital Vietnam Growth
Carbon
- KRBN: Global Carbon Strategy*
- KEUA: European Carbon Allowance
- KCCA: California Carbon Allowance
Fixed Income
- IVOL: Quadratic Interest Rate Volatility & Inflation Hedge
- BNDD: Quadratic Deflation ETF
- KHYB: Asia High Income USD Bond
- KCSH: Sustainable Ultra Short Duration
US Equity
- KSPY: Hedgeye Hedged Equity
- BUYO: Man Buyout Beta Index
- KVLE: Value Line® Dynamic Dividend Equity
- KIQQ: Nasdaq Hedge & Option Income
Levered
- KBAB: 2X Long BABA Daily
- KPDD: 2X Long PDD Daily
- KMLI: 2X Long MELI Daily
- KJD: 2X Long JD Daily
- KBDU: 2X Long Baidu Daily
*Strategy also available in UCITS
KraneShares Artificial Intelligence & Technology ETF
Investment Strategy:
AGIX invests in both publicly listed and private pre-IPO AI and technology companies to capture the broad spectrum of the AI ecosystem.
AGIX invests at least 80% of its net assets in securities included in the Solactive Etna Artificial General Intelligence Index, designed to capture the performance of companies engaged in developing and applying artificial intelligence technologies. The underlying index focuses on three key categories within the AI sector: hardware, infrastructure, and applications. Constituents are selected based on a proprietary AI Exposure Score, which assesses each company's relevance to and readiness for artificial intelligence technology. It includes companies developing semiconductors and data centers crucial for large language models (LLM), firms providing cloud and data services for AI training & deployment, and businesses leveraging AI to enhance efficiency, reduce costs, and improve customer experiences. This approach offers comprehensive exposure to the AI value chain, from foundational technology to practical implementations across various industries.
Generative AI Sector Highlights:
- Generative AI's exponential growth has just begun, and adoption is happening at a faster rate than previous technologies, underscored by ChatGPT reaching 100 million+ active users in 2 months, a milestone that took previous technologies years to achieve.
- Advances in AI could produce a $17.1-25.6 trillion boost to the global economy annually, according to McKinsey's predictive models.
- McKinsey & Company projects that 50% of today's work activities could be automated between 2030 and 2060, with a midpoint in 2045.
AGIX Features:
- Exposure to opportunities across the entire AI value chain, categorized by three main categories: hardware, infrastructure, and applications.
- Holdings are selected based on an AI Exposure Score calculated by a proprietary formula based on 'AI relevance' and 'AI readiness'.
- Allocate to private AI companies such as xAI and Anthropic.
The AI Opportunity
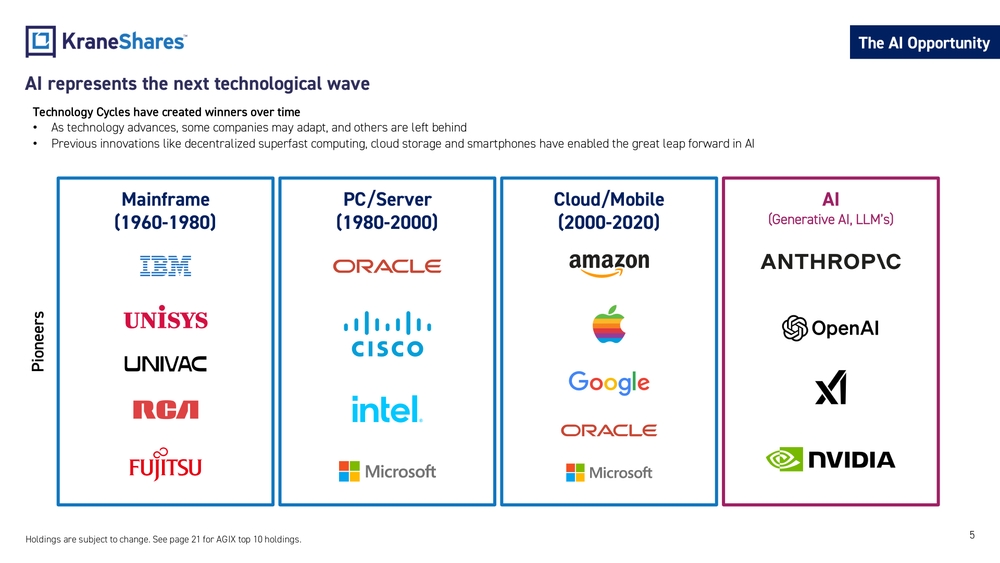
AI represents the next technological wave
Technology Cycles have created winners over time
- As technology advances, some companies may adapt, and others are left behind
- Previous innovations like decentralized superfast computing, cloud storage and smartphones have enabled the great leap forward in AI
Technology Evolution Timeline:
- Mainframe (1960-1980): IBM, UNISYS, UNIVAC, RCA, FUJITSU
- PC/Server (1980-2000): ORACLE, CISCO, intel, Microsoft
- Cloud/Mobile (2000-2020): amazon, Apple, Google, ORACLE, Microsoft
- AI (Generative AI, LLM's): ANTHROPIC, OpenAI, XI, NVIDIA
The AI Opportunity
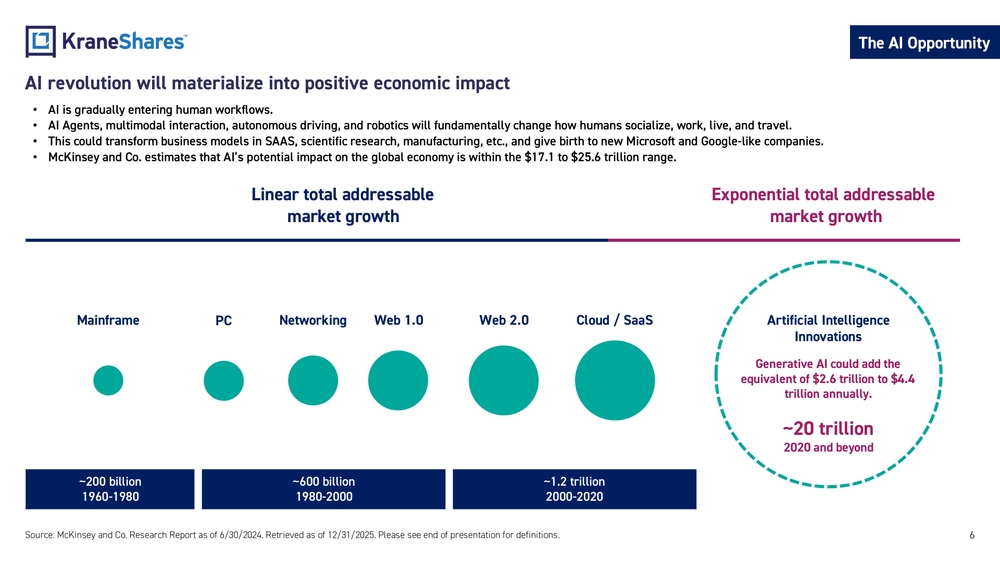
AI revolution will materialize into positive economic impact
- AI is gradually entering human workflows.
- AI Agents, multimodal interaction, autonomous driving, and robotics will fundamentally change how humans socialize, work, live, and travel.
- This could transform business models in SAAS, scientific research, manufacturing, etc., and give birth to new Microsoft and Google-like companies.
- McKinsey and Co. estimates that AI's potential impact on the global economy is within the $17.1 to $25.6 trillion range.
Market Growth Comparison:
-
Linear total addressable market growth:
- Mainframe (1960-1980): ~$200 billion
- PC/Networking (1980-2000): ~$600 billion
- Web 1.0/Web 2.0/Cloud/SaaS (2000-2020): ~$1.2 trillion
-
Exponential total addressable market growth:
- Artificial Intelligence Innovations (2020 and beyond): ~$20 trillion
- Generative AI could add the equivalent of $2.6 trillion to $4.4 trillion annually.
The AI Opportunity
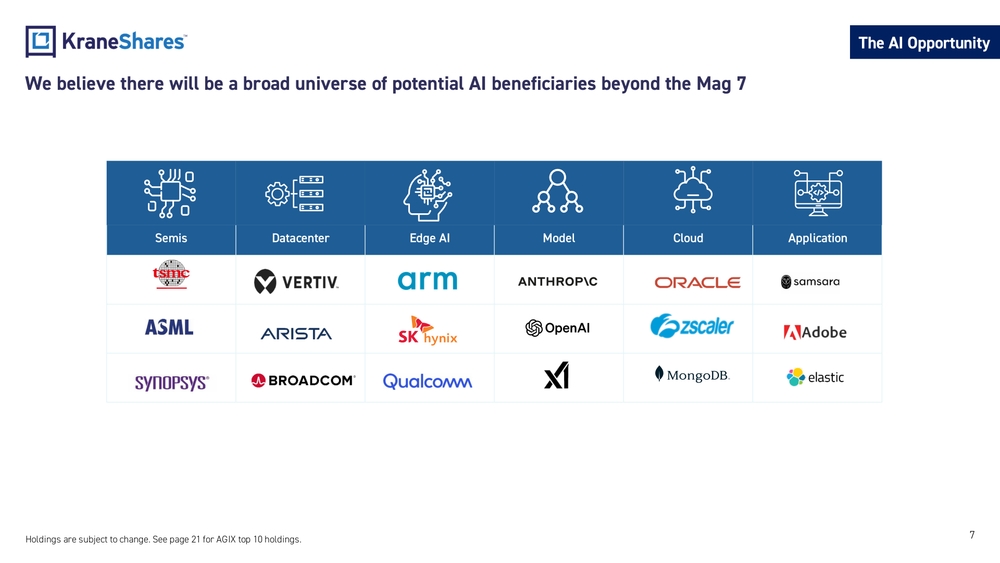
We believe there will be a broad universe of potential AI beneficiaries beyond the Mag 7
AI Value Chain Categories:
Semis
- TSMC
- ASML
- Synopsys
Datacenter
- VERTIV
- ARISTA
- BROADCOM
Edge AI
- arm
- SK hynix
- Qualcomm
Model
- ANTHROPIC
- OpenAI
- XI
Cloud
- ORACLE
- zscaler
- MongoDB
Application
- samsara
- Adobe
- elastic
Private AI Exposure
Enterprise Adoption Is Rising
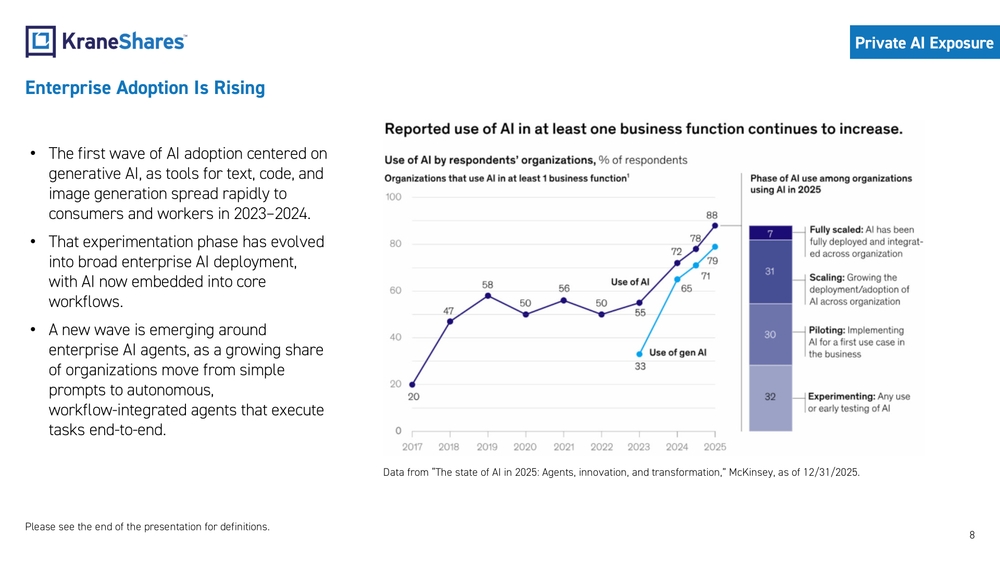
- The first wave of AI adoption centered on generative AI, as tools for text, code, and image generation spread rapidly to consumers and workers in 2023–2024.
- That experimentation phase has evolved into broad enterprise AI deployment, with AI now embedded into core workflows.
- A new wave is emerging around enterprise AI agents, as a growing share of organizations move from simple prompts to autonomous, workflow-integrated agents that execute tasks end-to-end.
Enterprise AI Adoption Trends:
- Reported use of AI in at least one business function continues to increase, reaching 88% by 2025.
- Use of generative AI specifically has grown from 33% to 79% between 2023-2025.
- In 2025, organizations using AI are at different phases:
- 7% Fully scaled (AI fully deployed and integrated across organization)
- 31% Scaling (Growing deployment/adoption of AI across organization)
- 30% Piloting (Implementing AI for a first use case in the business)
- 32% Experimenting (Any use or early testing of AI)
Private AI Exposure
Anthropic is gaining market share among enterprise customers
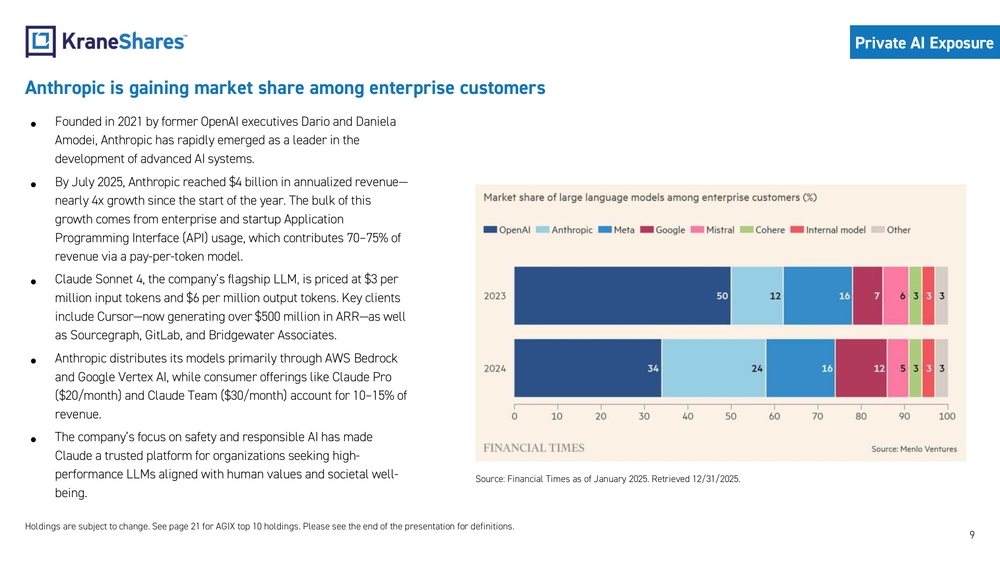
- Founded in 2021 by former OpenAI executives Dario and Daniela Amodei, Anthropic has rapidly emerged as a leader in the development of advanced AI systems.
- By July 2025, Anthropic reached $4 billion in annualized revenue—nearly 4x growth since the start of the year. The bulk of this growth comes from enterprise and startup Application Programming Interface (API) usage, which contributes 70–75% of revenue via a pay-per-token model.
- Claude Sonnet 4, the company's flagship LLM, is priced at $3 per million input tokens and $6 per million output tokens. Key clients include Cursor—now generating over $500 million in ARR—as well as Sourcegraph, GitLab, and Bridgewater Associates.
- Anthropic distributes its models primarily through AWS Bedrock and Google Vertex AI, while consumer offerings like Claude Pro ($20/month) and Claude Team ($30/month) account for 10–15% of revenue.
- The company's focus on safety and responsible AI has made Claude a trusted platform for organizations seeking high-performance LLMs aligned with human values and societal well-being.
Market Share of Large Language Models Among Enterprise Customers:
- 2023: OpenAI (50%), Anthropic (12%), Meta (16%), Google (7%), Mistral (6%), Others (9%)
- 2024: OpenAI (34%), Anthropic (24%), Meta (16%), Google (12%), Mistral (5%), Others (9%)
Private AI Exposure
x.AI Grok 4 became the most intelligent AI model
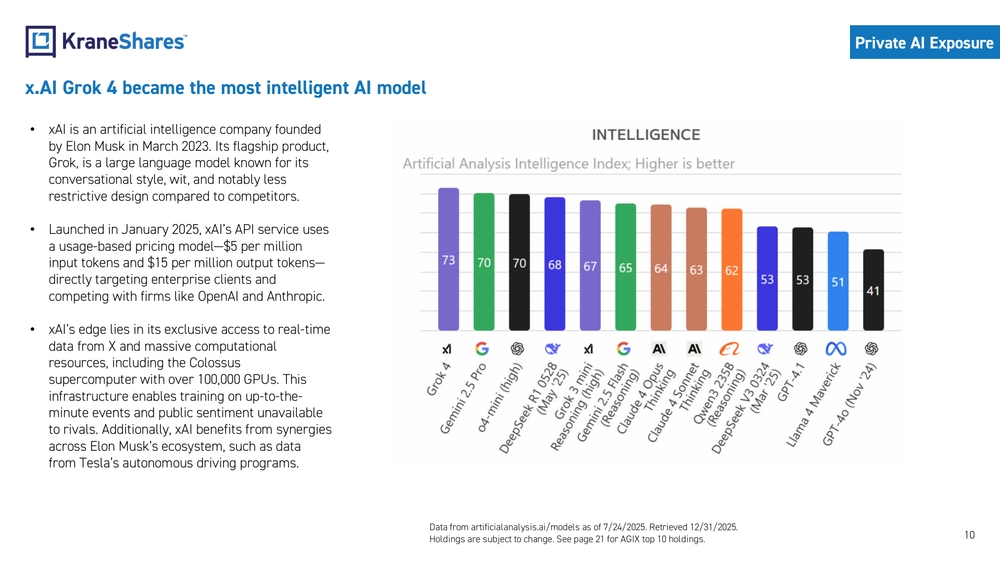
- xAI is an artificial intelligence company founded by Elon Musk in March 2023. Its flagship product, Grok, is a large language model known for its conversational style, wit, and notably less restrictive design compared to competitors.
- Launched in January 2025, xAI's API service uses a usage-based pricing model—$5 per million input tokens and $15 per million output tokens—directly targeting enterprise clients and competing with firms like OpenAI and Anthropic.
- xAI's edge lies in its exclusive access to real-time data from X and massive computational resources, including the Colossus supercomputer with over 100,000 GPUs. This infrastructure enables training on up-to-the-minute events and public sentiment unavailable to rivals. Additionally, xAI benefits from synergies across Elon Musk's ecosystem, such as data from Tesla's autonomous driving programs.
AI Model Intelligence Comparison:
- Artificial Analysis Intelligence Index (Higher is better):
- Grok 4: 73
- Gemini 2.5 Pro: 70
- Claude Opus: 64
- GPT-4o: 53
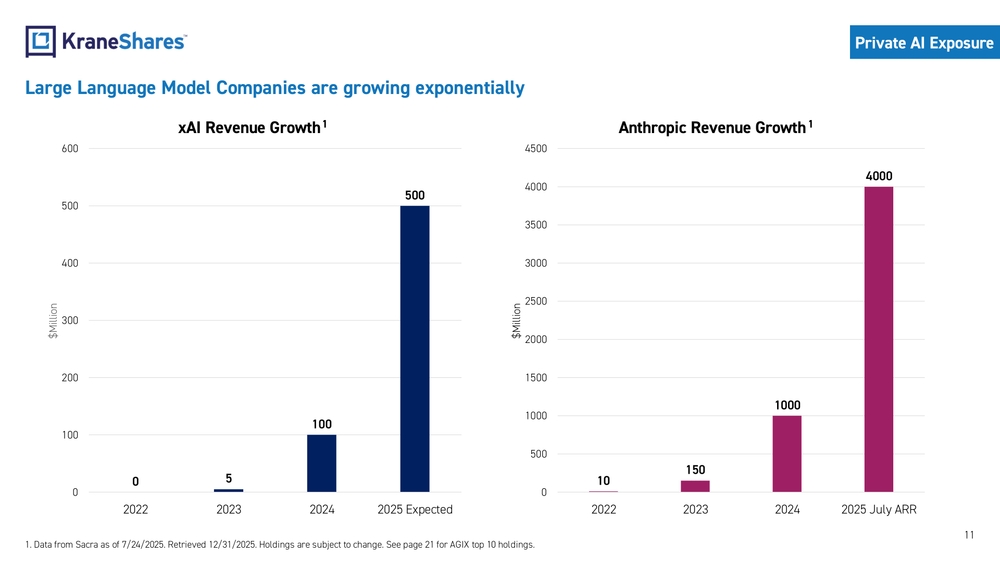
Large Language Model Companies are growing exponentially
Two charts showing revenue growth:
xAI Revenue Growth
Bar chart showing revenue in $Million:
- 2022: 0
- 2023: 5
- 2024: 100
- 2025 Expected: 500
Anthropic Revenue Growth
Bar chart showing revenue in $Million:
- 2022: 10
- 2023: 150
- 2024: 1000
- 2025 July ARR: 4000
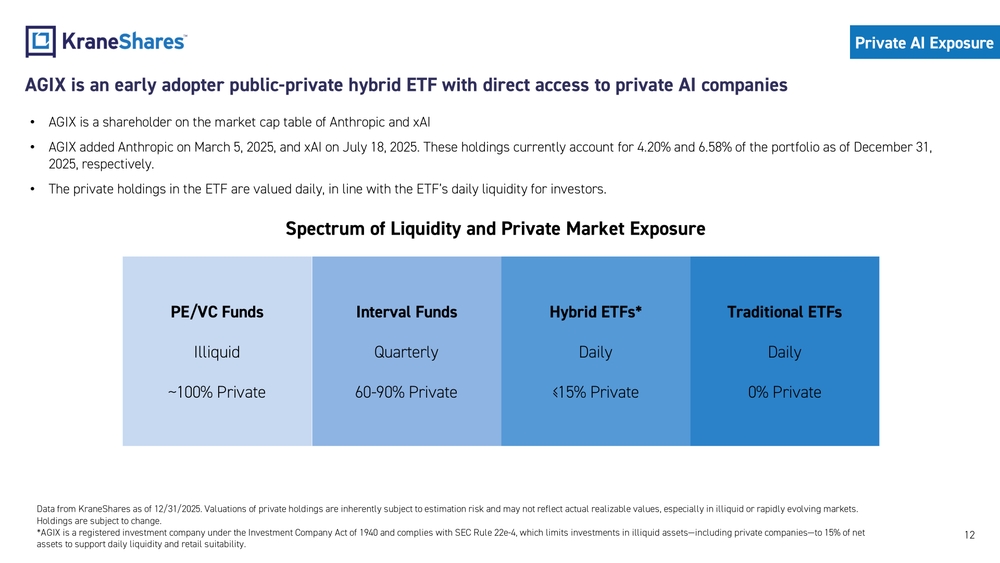
AGIX is an early adopter public-private hybrid ETF with direct access to private AI companies
- AGIX is a shareholder on the market cap table of Anthropic and xAI
- AGIX added Anthropic on March 5, 2025, and xAI on July 18, 2025. These holdings currently account for 4.20% and 6.58% of the portfolio as of December 31, 2025, respectively.
- The private holdings in the ETF are valued daily, in line with the ETF's daily liquidity for investors.
Spectrum of Liquidity and Private Market Exposure
| Fund Type | Liquidity | Private Exposure |
|---|---|---|
| PE/VC Funds | Illiquid | ~100% Private |
| Interval Funds | Quarterly | 60-90% Private |
| Hybrid ETFs* | Daily | ≤15% Private |
| Traditional ETFs | Daily | 0% Private |
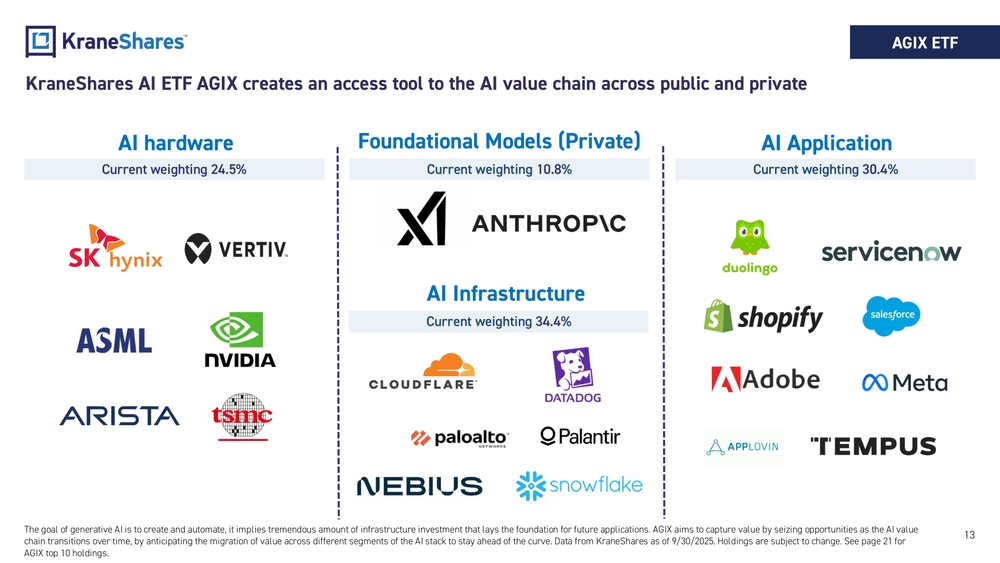
KraneShares AI ETF AGIX creates an access tool to the AI value chain across public and private
The ETF is divided into four main categories with current weightings:
AI hardware
Current weighting 24.5%
Foundational Models (Private)
Current weighting 10.8%
AI Application
Current weighting 30.4%
AI Infrastructure
Current weighting 34.4%
The goal of generative AI is to create and automate, it implies tremendous amount of infrastructure investment that lays the foundation for future applications. AGIX aims to capture value by seizing opportunities as the AI value chain transitions over time, by anticipating the migration of value across different segments of the AI stack to stay ahead of the curve.
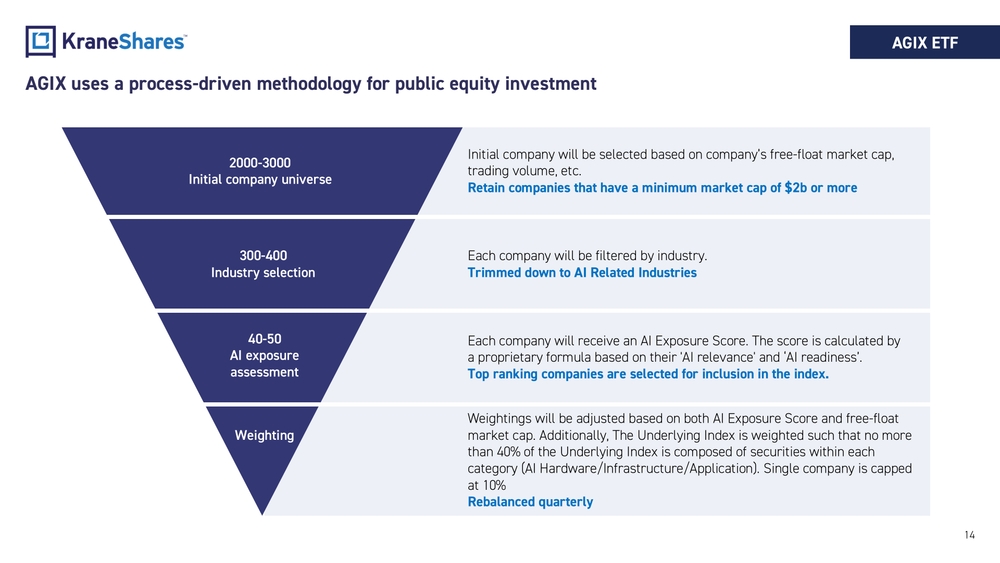
AGIX uses a process-driven methodology for public equity investment
Investment Selection Process
2000-3000 Initial company universe
Initial company will be selected based on company's free-float market cap, trading volume, etc. Retain companies that have a minimum market cap of $2b or more
300-400 Industry selection
Each company will be filtered by industry. Trimmed down to AI Related Industries
40-50 AI exposure assessment
Each company will receive an AI Exposure Score. The score is calculated by a proprietary formula based on their 'AI relevance' and 'AI readiness'. Top ranking companies are selected for inclusion in the index.
Weighting
Weightings will be adjusted based on both AI Exposure Score and free-float market cap. Additionally, The Underlying Index is weighted such that no more than 40% of the Underlying Index is composed of securities within each category (AI Hardware/Infrastructure/Application). Single company is capped at 10% Rebalanced quarterly
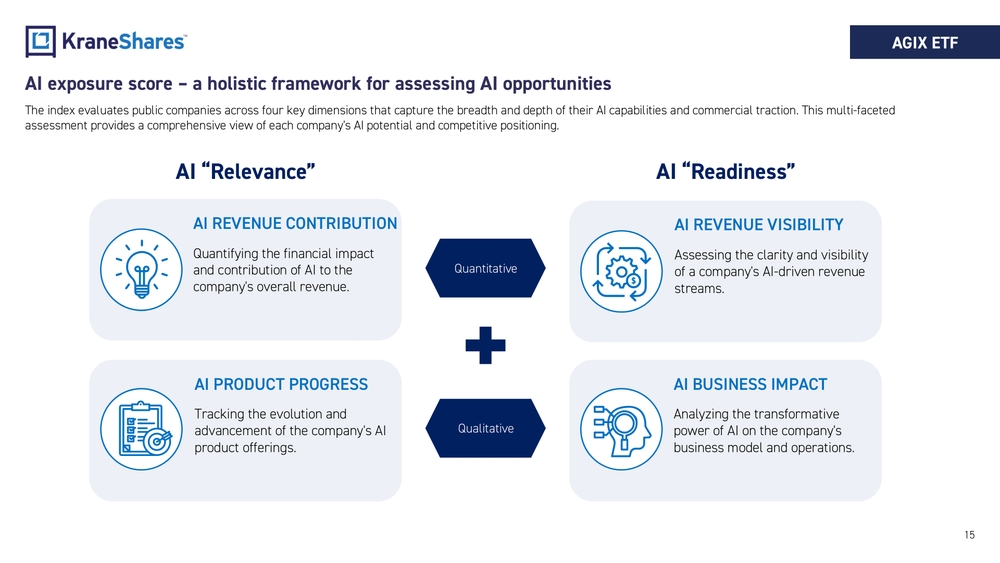
AI exposure score – a holistic framework for assessing AI opportunities
The index evaluates public companies across four key dimensions that capture the breadth and depth of their AI capabilities and commercial traction. This multi-faceted assessment provides a comprehensive view of each company's AI potential and competitive positioning.
AI "Relevance"
AI REVENUE CONTRIBUTION (Quantitative)
Quantifying the financial impact and contribution of AI to the company's overall revenue.
AI PRODUCT PROGRESS (Qualitative)
Tracking the evolution and advancement of the company's AI product offerings.
AI "Readiness"
AI REVENUE VISIBILITY (Quantitative)
Assessing the clarity and visibility of a company's AI-driven revenue streams.
AI BUSINESS IMPACT (Qualitative)
Analyzing the transformative power of AI on the company's business model and operations.
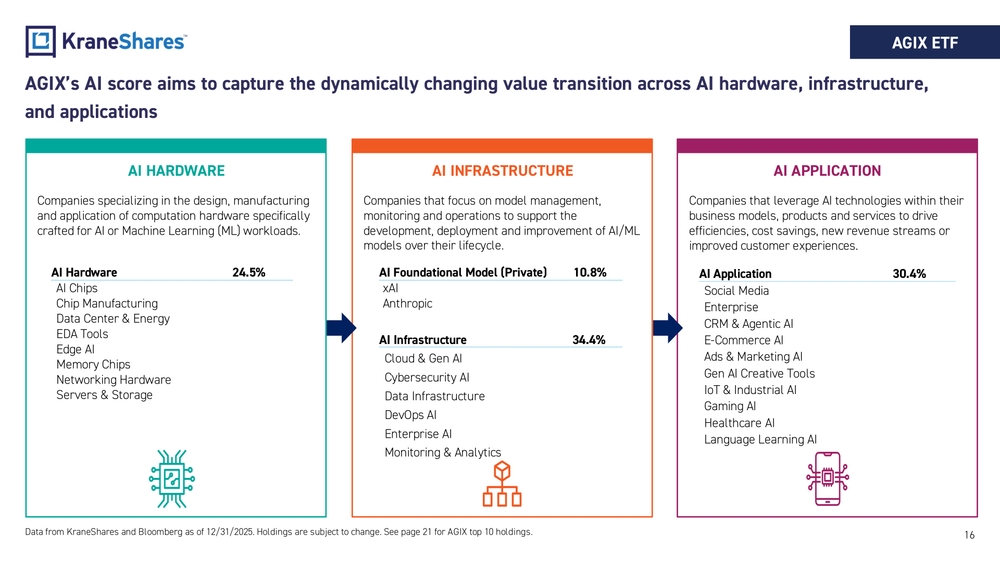
AGIX's AI score aims to capture the dynamically changing value transition across AI hardware, infrastructure, and applications
AI HARDWARE (24.5%)
Companies specializing in the design, manufacturing and application of computation hardware specifically crafted for AI or Machine Learning (ML) workloads.
Subcategories:
- AI Chips
- Chip Manufacturing
- Data Center & Energy
- EDA Tools
- Edge AI
- Memory Chips
- Networking Hardware
- Servers & Storage
AI INFRASTRUCTURE (34.4%)
Companies that focus on model management, monitoring and operations to support the development, deployment and improvement of AI/ML models over their lifecycle.
Subcategories:
- Cloud & Gen AI
- Cybersecurity AI
- Data Infrastructure
- DevOps AI
- Enterprise AI
- Monitoring & Analytics
AI Foundational Model (Private) (10.8%)
- xAI
- Anthropic
AI APPLICATION (30.4%)
Companies that leverage AI technologies within their business models, products and services to drive efficiencies, cost savings, new revenue streams or improved customer experiences.
Subcategories:
- Social Media
- Enterprise
- CRM & Agentic AI
- E-Commerce AI
- Ads & Marketing AI
- Gen AI Creative Tools
- IoT & Industrial AI
- Gaming AI
- Healthcare AI
- Language Learning AI
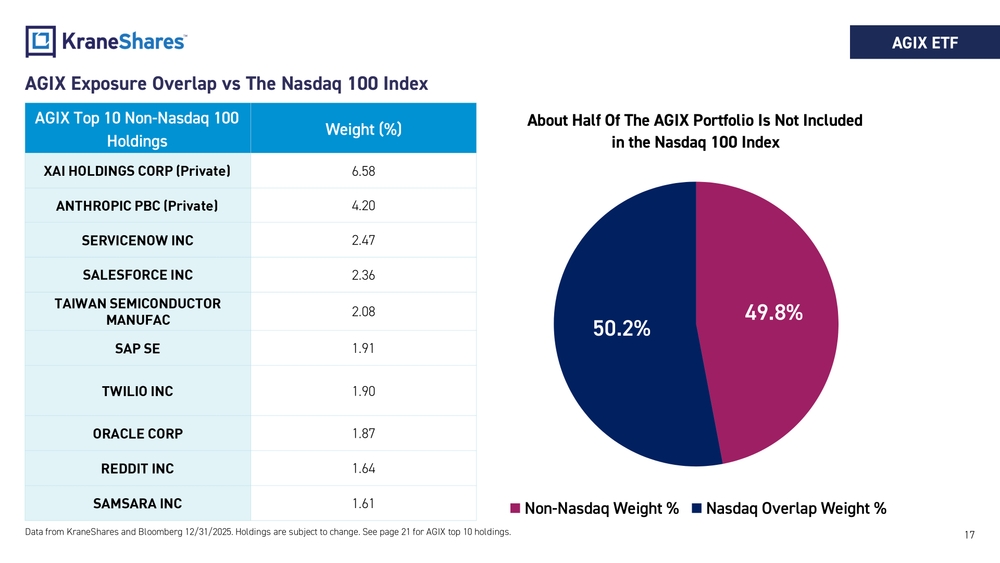
AGIX Exposure Overlap vs The Nasdaq 100 Index
AGIX Top 10 Non-Nasdaq 100 Holdings
| Company | Weight (%) |
|---|---|
| XAI HOLDINGS CORP (Private) | 6.58 |
| ANTHROPIC PBC (Private) | 4.20 |
| SERVICENOW INC | 2.47 |
| SALESFORCE INC | 2.36 |
| TAIWAN SEMICONDUCTOR MANUFAC | 2.08 |
| SAP SE | 1.91 |
| TWILIO INC | 1.90 |
| ORACLE CORP | 1.87 |
| REDDIT INC | 1.64 |
| SAMSARA INC | 1.61 |
About Half Of The AGIX Portfolio Is Not Included in the Nasdaq 100 Index
- Non-Nasdaq Weight %: 49.8%
- Nasdaq Overlap Weight %: 50.2%
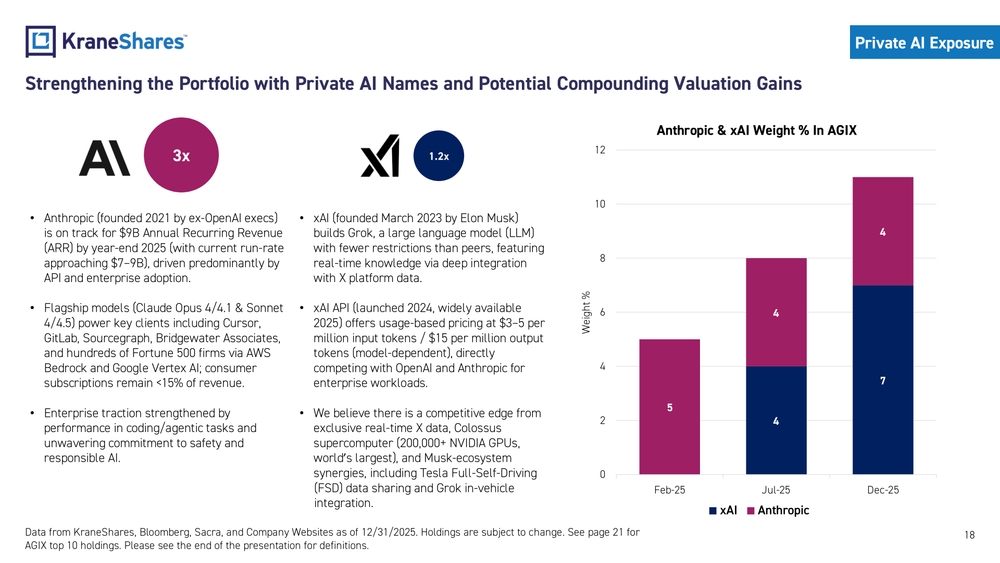
Strengthening the Portfolio with Private AI Names and Potential Compounding Valuation Gains
Anthropic (3x)
- Anthropic (founded 2021 by ex-OpenAI execs) is on track for $9B Annual Recurring Revenue (ARR) by year-end 2025 (with current run-rate approaching $7–9B), driven predominantly by API and enterprise adoption.
- Flagship models (Claude Opus 4/4.1 & Sonnet 4/4.5) power key clients including Cursor, GitLab, Sourcegraph, Bridgewater Associates, and hundreds of Fortune 500 firms via AWS Bedrock and Google Vertex AI; consumer subscriptions remain <15% of revenue.
- Enterprise traction strengthened by performance in coding/agentic tasks and unwavering commitment to safety and responsible AI.
xAI (1.2x)
- xAI (founded March 2023 by Elon Musk) builds Grok, a large language model (LLM) with fewer restrictions than peers, featuring real-time knowledge via deep integration with X platform data.
- xAI API (launched 2024, widely available 2025) offers usage-based pricing at $3–5 per million input tokens / $15 per million output tokens (model-dependent), directly competing with OpenAI and Anthropic for enterprise workloads.
- We believe there is a competitive edge from exclusive real-time X data, Colossus supercomputer (200,000+ NVIDIA GPUs, world's largest), and Musk-ecosystem synergies, including Tesla Full-Self-Driving (FSD) data sharing and Grok in-vehicle integration.
Anthropic & xAI Weight % In AGIX
Chart showing weight percentage evolution:
- Feb-25: 5% Anthropic, 4% xAI (total 9%)
- Jul-25: 4% Anthropic, 4% xAI (total 8%)
- Dec-25: 4% Anthropic, 7% xAI (total 11%)
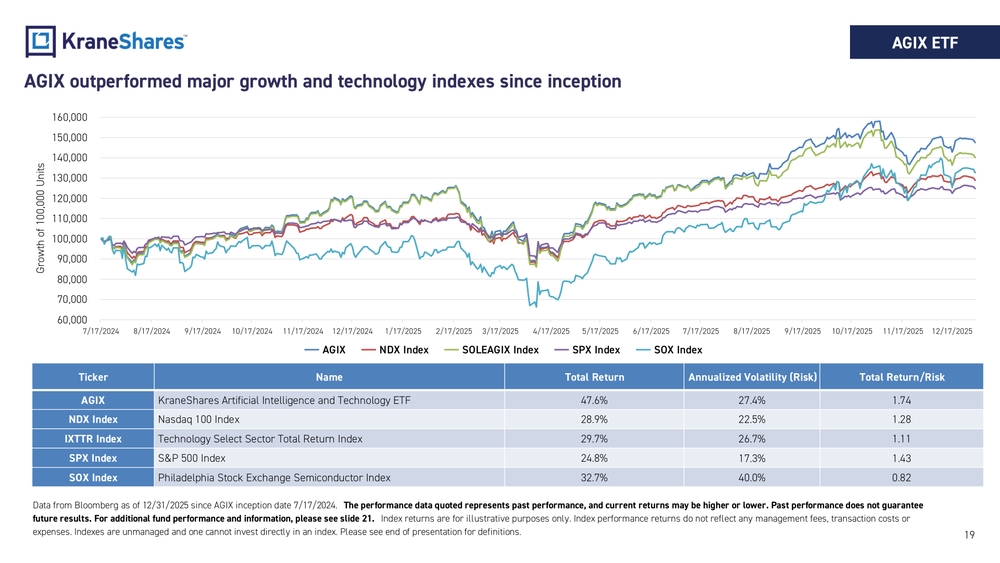
AGIX outperformed major growth and technology indexes since inception
Performance Comparison Table
| Ticker | Name | Total Return | Annualized Volatility (Risk) | Total Return/Risk |
|---|---|---|---|---|
| AGIX | KraneShares Artificial Intelligence and Technology ETF | 47.6% | 27.4% | 1.74 |
| NDX Index | Nasdaq 100 Index | 28.9% | 22.5% | 1.28 |
| IXTTR Index | Technology Select Sector Total Return Index | 29.7% | 26.7% | 1.11 |
| SPX Index | S&P 500 Index | 24.8% | 17.3% | 1.43 |
| SOX Index | Philadelphia Stock Exchange Semiconductor Index | 32.7% | 40.0% | 0.82 |
Chart showing growth of 100,000 units from 7/17/2024 to 12/17/2025 for all indexes, with AGIX showing the highest performance.
Data from Bloomberg as of 12/31/2025 since AGIX inception date 7/17/2024. The performance data quoted represents past performance, and current returns may be higher or lower. Past performance does not guarantee future results.
Conclusion
Broader Portfolio
AGIX stock count increased from 41 to 52, with top-10 concentration falling from 46.2% to 36.3%. Weight in the six large-cap U.S. tech companies declined from 33.4% to 24.9%, indicating a rotation from mega-caps toward a wider AI supply-chain and application ecosystem.
Differentiated AI Exposure
- 49.8% of the AGIX portfolio is not included in the Nasdaq 100 Index.
- AGIX holds direct ownership in private companies Anthropic (4.20%) & xAI (6.58%)
- AGIX's AI score aims to capture the dynamically changing value transition across AI hardware, infrastructure, and applications
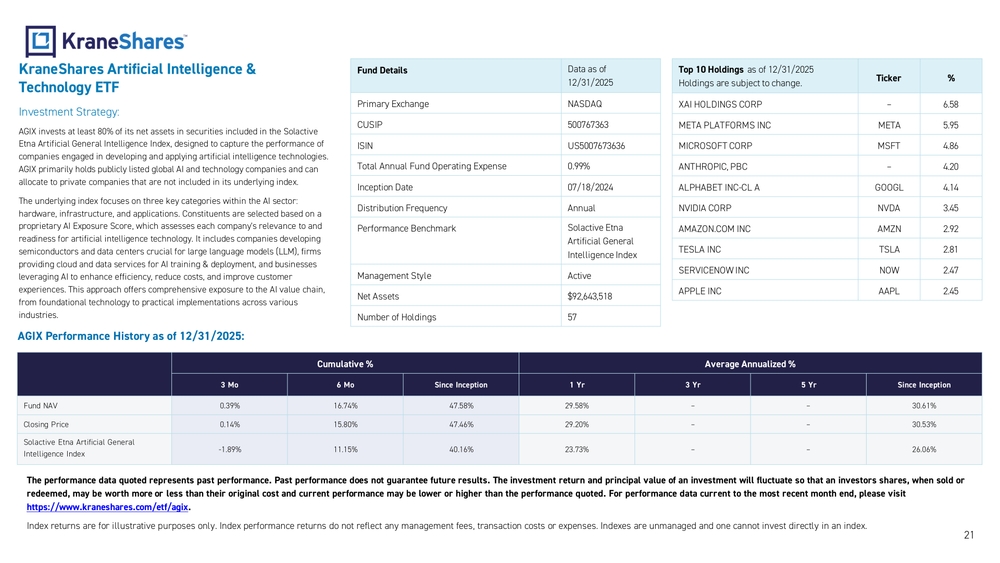
KraneShares Artificial Intelligence & Technology ETF
Investment Strategy:
AGIX invests at least 80% of its net assets in securities included in the Solactive Etna Artificial General Intelligence Index, designed to capture the performance of companies engaged in developing and applying artificial intelligence technologies. AGIX primarily holds publicly listed global AI and technology companies and can allocate to private companies that are not included in its underlying index.
The underlying index focuses on three key categories within the AI sector: hardware, infrastructure, and applications. Constituents are selected based on a proprietary AI Exposure Score, which assesses each company's relevance to and readiness for artificial intelligence technology. It includes companies developing semiconductors and data centers crucial for large language models (LLM), firms providing cloud and data services for AI training & deployment, and businesses leveraging AI to enhance efficiency, reduce costs, and improve customer experiences. This approach offers comprehensive exposure to the AI value chain, from foundational technology to practical implementations across various industries.
Fund Details Data as of 12/31/2025
| Primary Exchange | NASDAQ |
| CUSIP | 500767363 |
| ISIN | US5007673636 |
| Total Annual Fund Operating Expense | 0.99% |
| Inception Date | 07/18/2024 |
| Distribution Frequency | Annual |
| Performance Benchmark | Solactive Etna Artificial General Intelligence Index |
| Management Style | Active |
| Net Assets | $92,643,518 |
| Number of Holdings | 57 |
Top 10 Holdings as of 12/31/2025
Holdings are subject to change.
| Ticker | % |
|---|---|
| XAI HOLDINGS CORP | 6.58 |
| META PLATFORMS INC | 5.95 |
| MICROSOFT CORP | 4.86 |
| ANTHROPIC, PBC | 4.20 |
| ALPHABET INC-CL A | 4.14 |
| NVIDIA CORP | 3.45 |
| AMAZON.COM INC | 2.92 |
| TESLA INC | 2.81 |
| SERVICENOW INC | 2.47 |
| APPLE INC | 2.45 |
AGIX Performance History as of 12/31/2025:
Cumulative %
| 3 Mo | 6 Mo | Since Inception | |
|---|---|---|---|
| Fund NAV | 0.39% | 16.74% | 47.58% |
| Closing Price | 0.14% | 15.80% | 47.46% |
| Solactive Etna Artificial General Intelligence Index | -1.89% | 11.15% | 40.16% |
Average Annualized %
| 1 Yr | 3 Yr | 5 Yr | Since Inception | |
|---|---|---|---|---|
| Fund NAV | 29.58% | – | – | 30.61% |
| Closing Price | 29.20% | – | – | 30.53% |
| Solactive Etna Artificial General Intelligence Index | 23.73% | – | – | 26.06% |
Index Definitions:
Solactive Etna Artificial General Intelligence Index: captures the performance of companies engaged in developing and applying artificial intelligence technologies.
NASDAQ-100 Index: The Nasdaq 100 is an index that tracks the performance of 100 of the largest and most actively trades stocks on the Nasdaq exchange.
The S&P 500 Index: The S&P 500 Index is an American stock market index based on the market capitalization of the 500 largest companies having common stock listed on the NYSE or NASDAQ. countries in the universe prior to the removal of state-owned enterprises while also limiting sector deviations to 3% of the starting universe.
Term Definitions:
Price-to-Earnings Ratio (P/E): A company's price per share divided by the company's current earnings per share. The ratio is widely used as a valuation metric.
Total Addressable Market (TAM): The Total Addressable Market (TAM) is a measure of the total revenue opportunity available for a product or service if it achieved 100% market share.
Generative AI: Generative AI refers to artificial intelligence systems that create new content, such as text, images, or music, by learning patterns from existing data.
Neural Networks: Neural networks are computing systems inspired by the human brain's structure that consist of interconnected nodes (neurons) and are used to recognize patterns and solve complex problems through learning from data.
Deep Learning: Deep learning is a subset of machine learning that utilizes neural networks with many layers to analyze and learn from large amounts of data, enabling complex pattern recognition and decision-making.
Large Language Models (LLMs): A large language model is a type of artificial intelligence that uses deep learning techniques to understand and generate human-like text by training on vast amounts of textual data.
Artificial General Intelligence (AGI): Artificial General Intelligence (AGI) refers to a type of artificial intelligence that has the ability to understand, learn, and apply knowledge across a wide range of tasks at a level comparable to human intelligence.
Forward P/E Multiple: The Forward Price to Earnings (PE) Ratio is similar to the price to earnings ratio. The regular P/E ratio is a current stock price over its earnings per share. The forward P/E ratio is a current stock's price over its "predicted" earnings per share.
Gross Margin: The percentage of a company's revenue that's retained after direct expenses such as labor and materials have been subtracted.
Earnings Before Interest, Taxes, Depreciation, and Amortization (EBITDA): Financial metric that represents the operational profitability of a company
Compound Annual Growth Rate (CAGR): Mean annual growth rate of an investment over a period longer than one year.
Total Return: The overall gain or loss on an investment over a period, including both price change (capital appreciation) and any income such as dividends or interest, usually expressed as a percentage.
Annualized Volatility (Risk): A measure of how much an investment's returns typically fluctuate over a year, calculated by using the standard deviation of daily return times the square root of 252 to quantify the asset's risk.
Total Return/Risk: A performance metric that divides an investment's total return by its annualized volatility, indicating how much return is earned per unit of risk taken.
AI Agents: Software systems that can autonomously perceive context, decide on actions, and interact with digital or physical environments to achieve specific goals.
Application Programming Interface (API): A defined set of rules and protocols that allows different software applications to communicate with each other and exchange data or functionality.
Annual Recurring Revenue (ARR): A metric that represents the predictable yearly revenue from subscription-based or recurring contracts, normalized to a 12-month period.
Run-rate: A projection of a company's future financial performance that annualizes current revenue or earnings over a longer period, assuming present conditions continue.
Important Notes:
Carefully consider the Funds' investment objectives, risk factors, charges and expenses before investing. This and additional information can be found in the Funds' full and summary prospectus, which may be obtained by visiting www.kraneshares.com/agix. Read the prospectus carefully before investing.
Risk Disclosures:
Investing involves risk, including possible loss of principal. There can be no assurance that a Fund will achieve its stated objectives. Indices are unmanaged and do not include the effect of fees. One cannot invest directly in an index.
This information should not be relied upon as research, investment advice, or a recommendation regarding any products, strategies, or any security in particular. This material is strictly for illustrative, educational, or informational purposes and is subject to change. Certain content represents an assessment of the market environment at a specific time and is not intended to be a forecast of future events or a guarantee of future results; material is as of the dates noted and is subject to change without notice.
The Fund may invest in derivatives, which are often more volatile than other investments and may magnify the Fund's gains or losses. A derivative (i.e., futures/forward contracts, swaps, and options) is a contract that derives its value from the performance of an underlying asset. The primary risk of derivatives is that changes in the asset's market value and the derivative may not be proportionate, and some derivatives can have the potential for unlimited losses. Derivatives are also subject to liquidity risk and counterparty risk. The Fund is subject to liquidity risk, meaning that certain investments may become difficult to purchase or sell at a reasonable time and price. If a transaction for these securities is large, it may not be possible to initiate, which may cause the Fund to suffer losses. Counterparty risk is the risk of loss in the event that the counterparty to an agreement fails to make required payments or otherwise comply with the terms of the derivative.
AI-exposed companies face profitability challenges due to high research costs, competition, IP reliance, and regulatory risk. Product failures or safety concerns could be detrimental. Identifying AI companies accurately is complex. Tech firms face risks of product failure, obsolescence, regulatory impact, and uncertain profitability due to technological advancements and government policies. Certain tech investments may lack current profitability and future success is uncertain. The Fund is subject to non-U.S. issuers risk, which may be less liquid than investments in U.S. issuers, may have less governmental regulation and oversight, are typically subject to different investor protection standards than U.S. issuers, and the economic instability of the non-U.S. countries. Fluctuations in currency of foreign countries may have an adverse effect to domestic currency values. The Fund may invest in Initial Public Offerings (IPOs). Securities issued in IPOs have no trading history, and information about the companies may be available for very limited periods. In addition, the prices of securities sold in IPOs may be highly volatile. In addition, as the Fund increases in size, the impact of IPOs on the Fund's performance will generally decrease.
Large capitalization companies may struggle to adapt fast, impacting their growth compared to smaller firms, especially in expansive times. This could result in lower stock returns than investing in smaller and mid-sized companies. In addition to the normal risks associated with investing, investments in smaller companies typically exhibit higher volatility. The Fund is new and does not yet have a significant number of shares outstanding. If the Fund does not grow in size, it will be at greater risk than larger funds of wider bid-ask spreads for its shares, trading at a greater premium or discount to NAV, liquidation and/or a trading halt. Narrowly focused investments typically exhibit higher volatility. The Fund's assets are expected to be concentrated in a sector, industry, market, or group of concentrations to the extent that the Underlying Index has such concentrations. The securities or futures in that concentration could react similarly to market developments. Thus, the Fund is subject to loss due to adverse occurrences that affect that concentration.
Risk disclosures continued:
The Fund may invest in privately-issued and private company securities, which are generally not registered, may carry resale restrictions, and often lack active markets. These investments can be less liquid, harder to value, and subject to larger price swings, which may result in delays or higher costs when buying or selling. Private companies may have limited operating histories, smaller or less established businesses, fewer financial resources, and less available information. They may be more vulnerable to competition, market conditions, or economic downturns. A liquid market for their securities may never develop, and IPOs, if they occur, can be volatile and may negatively affect the Fund's investment.
A large number of shares of the Fund are held by a single shareholder or a small group of shareholders. Redemptions from these shareholders can harm Fund performance, especially in declining markets, leading to forced sales at disadvantageous prices, increased costs, and adverse tax effects for remaining shareholders. AGIX is non-diversified.
ETF shares are bought and sold on an exchange at market price (not NAV) and are not individually redeemed from the Fund. However, shares may be redeemed at NAV directly by certain authorized broker-dealers (Authorized Participants) in very large creation/redemption units. The returns shown do not represent the returns you would receive if you traded shares at other times. Shares may trade at a premium or discount to their NAV in the secondary market. Brokerage commissions will reduce returns. Beginning 12/23/2020, market price returns are based on the official closing price of an ETF share or, if the official closing price isn't available, the midpoint between the national best bid and national best offer ("NBBO") as of the time the ETF calculates the current NAV per share. Prior to that date, market price returns were based on the midpoint between the Bid and Ask price. NAVs are calculated using prices as of 4:00 PM Eastern Time.
The KraneShares ETFs and KFA Funds ETFs are distributed by SEI Investments Distribution Company (SIDCO), 1 Freedom Valley Drive, Oaks, PA 19456, which is not affiliated with Krane Funds Advisors, LLC, the Investment Adviser for the Funds, or any sub-advisers for the Funds.