2024_summer_internet_report
by Kraneshares
info@kraneshares.com +1 (212) 933 0393Summer 2024 China Internet Quarterly Earnings ReportChina’s Fintech Ecosystem Update: A New Era?
2 kraneshares.com info@kraneshares.com +1 (212) 933 0393 Back to Top ↑Table of Contents China Internet Recent Highlights 3 KWEB Performance 5 KWEB Top 10 Holdings Financials Summary 6 KWEB Key Metrics 7 Subsector Analysis 9 Theme Highlight – China’s FinTech Ecosystem Update: A New Era? 13 Top 10 KWEB Holdings: Quarterly Earnings Update 20 Tencent 20 Alibaba 21 Meituan 22 PDD Holdings 23 NetEase 24 Trip.com 24 Kanzhun 25 Tencent Music Entertainment 26 JD.com 27 Full Truck Alliance 27 Citations 28 Definitions 29 Disclosures 30
3 kraneshares.com info@kraneshares.com +1 (212) 933 0393 Back to Top ↑China Internet Recent Highlights •OpenAI has exited China’s vast market, which is a significant catalyst for homegrown artificial intelligence (AI) players such as KWEB holdings Baidu, which has already offered free services to AI startups using its Ernie Bot large language model, and Alibaba.1 •E-commerce giants Alibaba and JD.com have each issued US dollar-denominated convertible bonds. We believe these issuances will help both companies finance buybacks with US dollars, borrow at a lower interest rate thanks to expectations for the stock to rise, and indicate to the market confidence in their growth and financial situation. •Last month, Alibaba unveiled a brand new, state-of-the-art campus in Hangzhou, next door to its existing headquarters, which will have desks for 30,000 employees, implying the company intends to hire significantly more staff in China. •104 video games were approved in June,2 including multiple titles from Tencent, bringing the year-to-date total to over 600, more than half of last year’s full-year total of only 1,075.3 •Although the valuation disparity between US and China internet has narrowed recently, it remains wide as China internet stocks continue to trade at nearly 30% less than their US counterparts.⁴
4 kraneshares.com info@kraneshares.com +1 (212) 933 0393 Back to Top ↑ •Alibaba’s Hong Kong shares could be added to Southbound Stock Connect, the mutual market access program that allows Mainland investors to trade Hong Kong stocks, as soon as August, according to management. To quantify the significance of this inclusion, Tencent and Meituan have 10% and 13% of their shares currently owned by Mainland investors. Assuming a similar Mainland ownership level for Alibaba, this could lead to inflows of over $100 million.5 •In this edition’s theme highlight, we discuss a potential turnaround in China’s fintech industry, which has reinvented itself for a future of more sustainable growth, focusing on KWEB holdings Qifu Technology and Lufax, which have outperformed US fintech giant SoFi so far this year. We believe improving confidence in this crucial industry is important for the internet sector as a whole and a sign that a challenging period, which started with the postponement of Ant Group’s IPO, has ended.
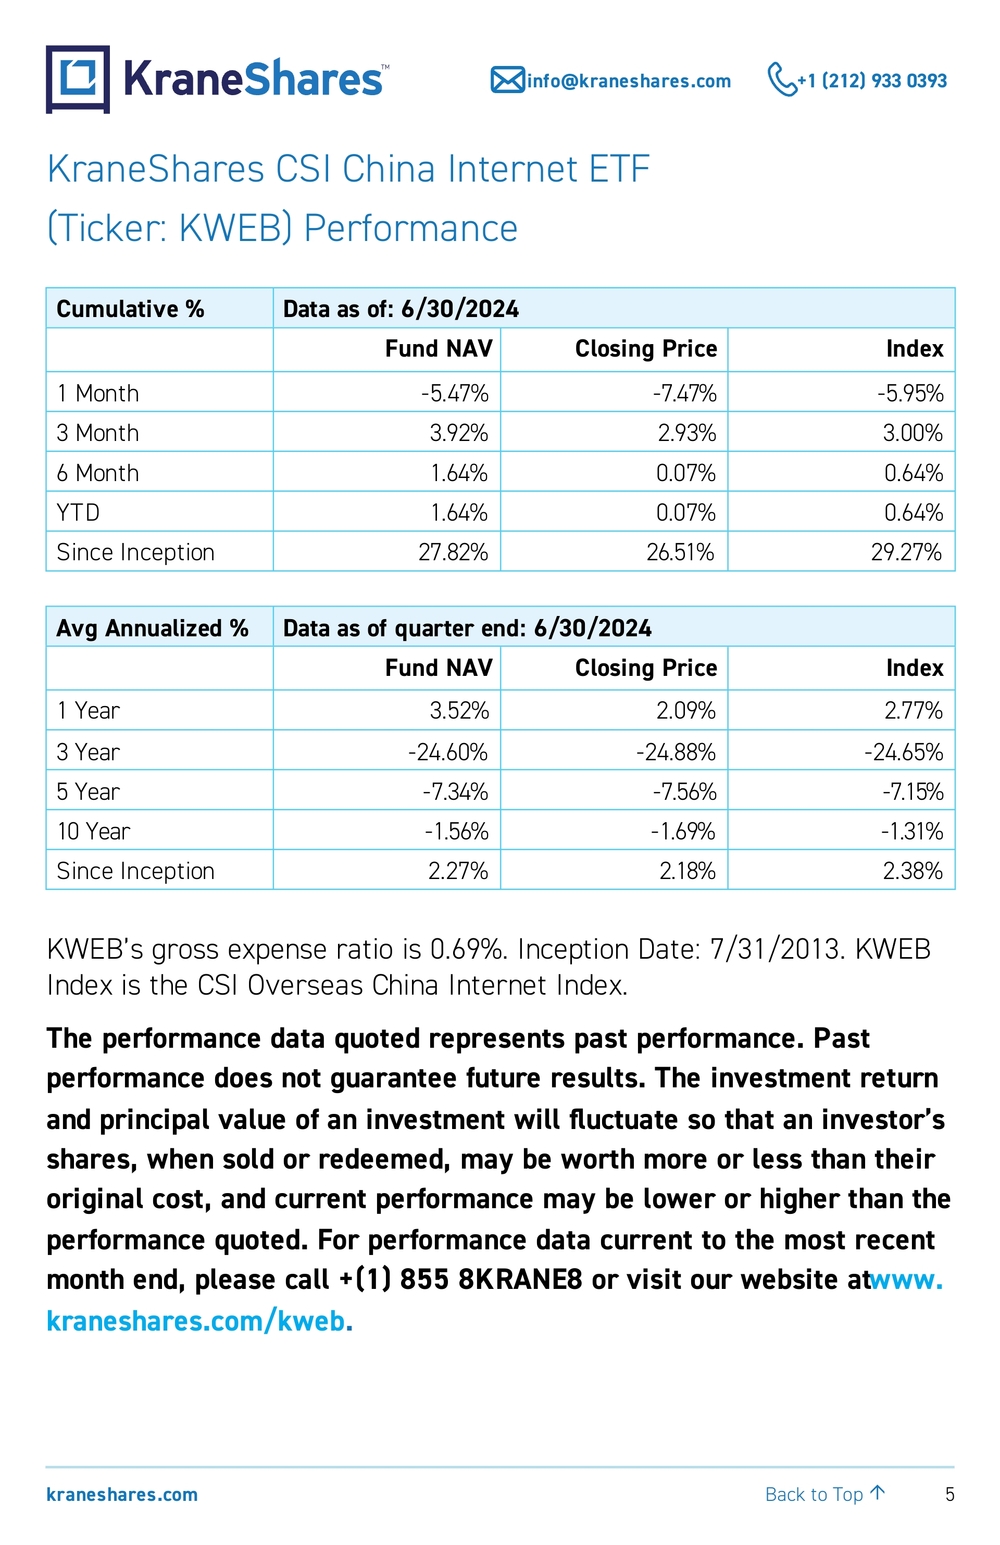
5 kraneshares.com info@kraneshares.com +1 (212) 933 0393 Back to Top ↑KraneShares CSI China Internet ETF (Ticker: KWEB) Performance Cumulative % Data as of: 6/30/2024 Fund NAV Closing Price Index 1 Month -5.47% -7.47% -5.95% 3 Month 3.92% 2.93% 3.00% 6 Month 1.64% 0.07% 0.64% YTD 1.64% 0.07% 0.64% Since Inception 27.82% 26.51% 29.27% Avg Annualized % Data as of quarter end: 6/30/2024 Fund NAV Closing Price Index 1 Year 3.52% 2.09% 2.77% 3 Year -24.60% -24.88% -24.65% 5 Year -7.34% -7.56% -7.15% 10 Year -1.56% -1.69% -1.31% Since Inception 2.27% 2.18% 2.38% KWEB’s gross expense ratio is 0.69%. Inception Date: 7/31/2013. KWEB Index is the CSI Overseas China Internet Index. The performance data quoted represents past performance. Past performance does not guarantee future results. The investment return and principal value of an investment will fluctuate so that an investor’s shares, when sold or redeemed, may be worth more or less than their original cost, and current performance may be lower or higher than the performance quoted. For performance data current to the most recent month end, please call +(1) 855 8KRANE8 or visit our website at www. kraneshares.com/kweb .
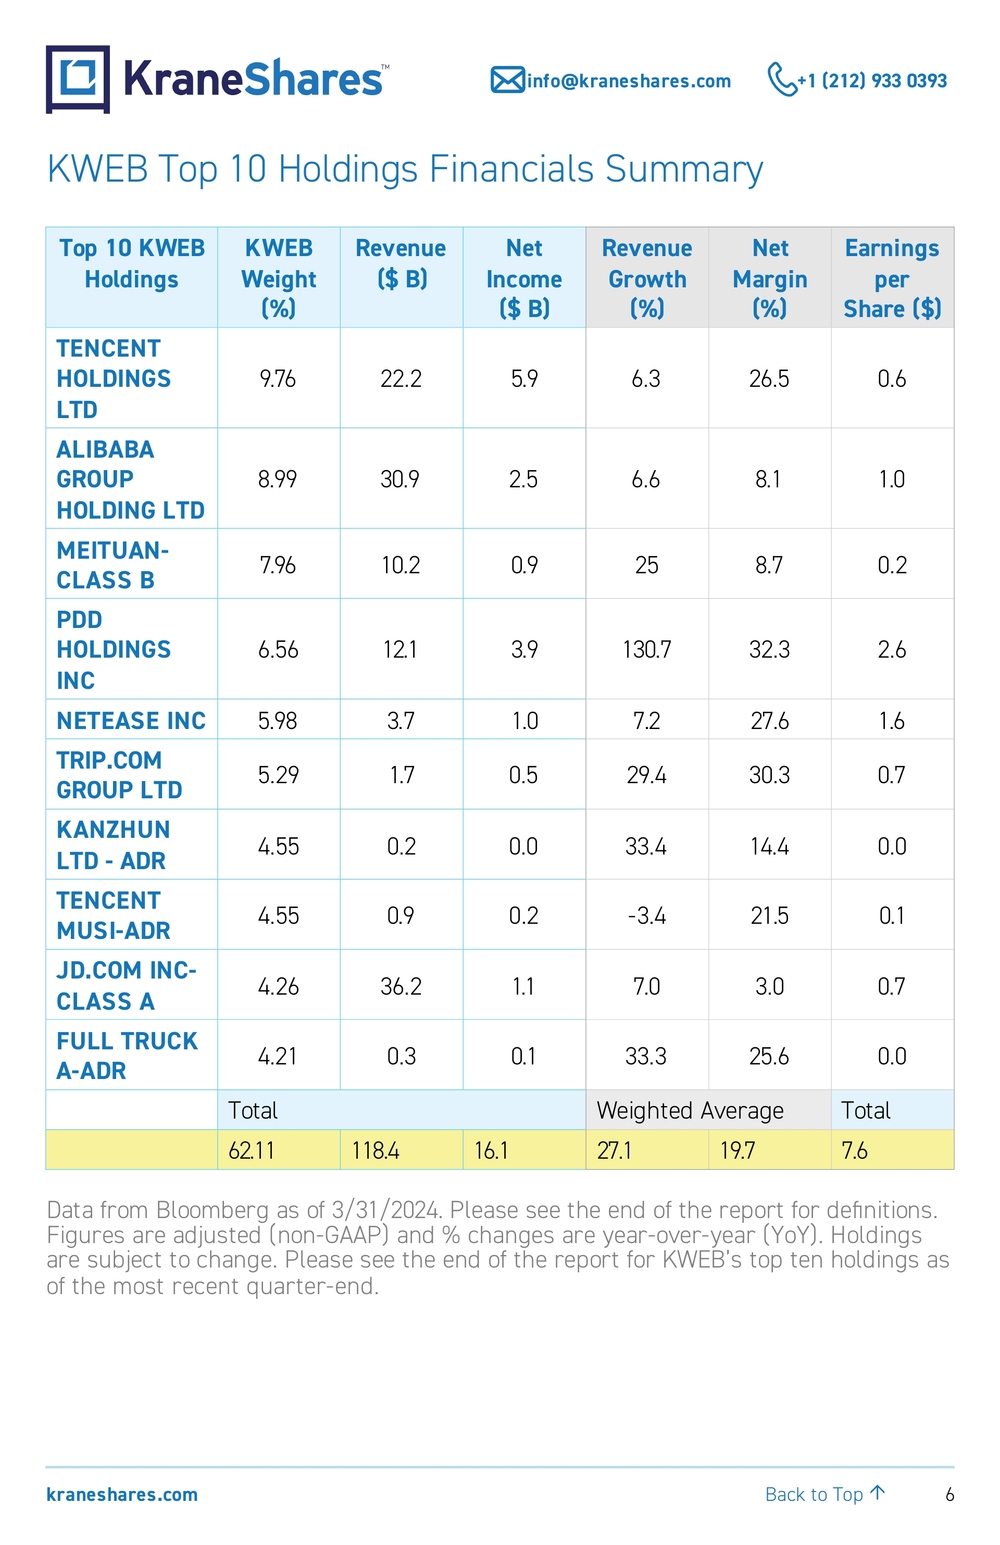
6 kraneshares.com info@kraneshares.com +1 (212) 933 0393 Back to Top ↑KWEB Top 10 Holdings Financials Summary Top 10 KWEB HoldingsKWEB Weight (%)Revenue ($ B)Net Income ($ B)Revenue Growth (%)Net Margin (%)Earnings per Share ($) TENCENT HOLDINGS LTD9.76 22.2 5.9 6.3 26.5 0.6 ALIBABA GROUP HOLDING LTD8.99 30.9 2.5 6.6 8.1 1.0 MEITUAN- CLASS B7.96 10.2 0.9 25 8.7 0.2 PDD HOLDINGS INC6.56 12.1 3.9 130.7 32.3 2.6 NETEASE INC 5.98 3.7 1.0 7.2 27.6 1.6 TRIP.COM GROUP LTD5.29 1.7 0.5 29.4 30.3 0.7 KANZHUN LTD - ADR4.55 0.2 0.0 33.4 14.4 0.0 TENCENT MUSI-ADR4.55 0.9 0.2 -3.4 21.5 0.1 JD.COM INC- CLASS A4.26 36.2 1.1 7.0 3.0 0.7 FULL TRUCK A-ADR4.21 0.3 0.1 33.3 25.6 0.0 Total Weighted Average Total 62.11 118.4 16.1 27.1 19.7 7.6 Data from Bloomberg as of 3/31/2024. Please see the end of the report for definitions. Figures are adjusted (non-GAAP) and % changes are year-over-year (YoY). Holdings are subject to change. Please see the end of the report for KWEB’s top ten holdings as of the most recent quarter-end.
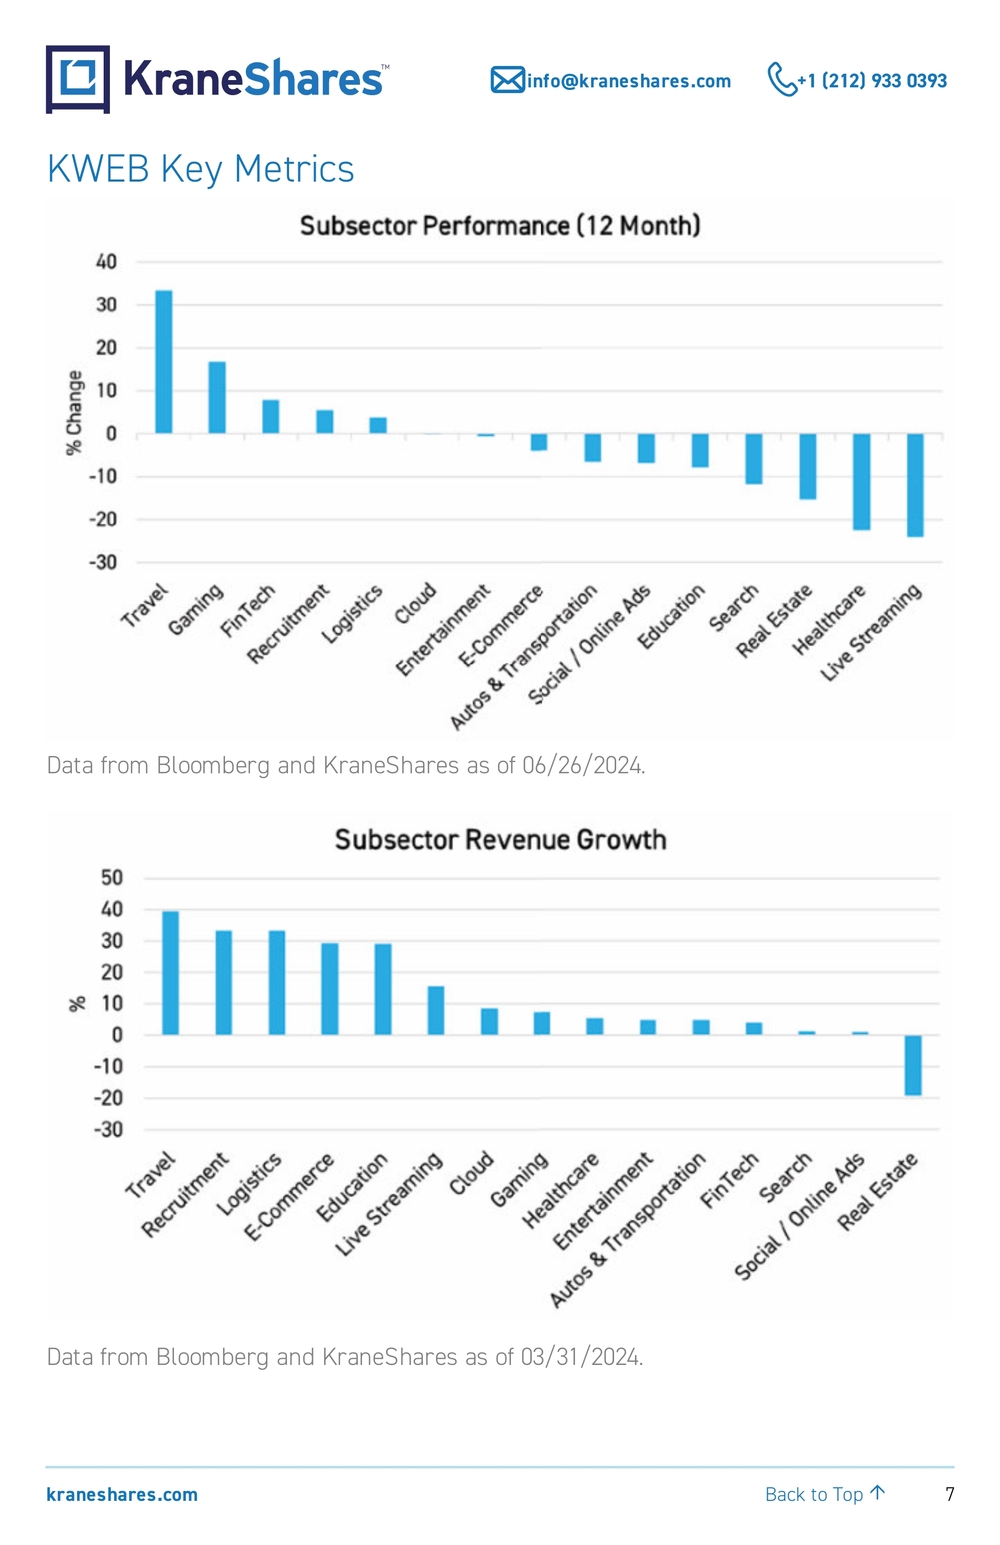
7 kraneshares.com info@kraneshares.com +1 (212) 933 0393 Back to Top ↑KWEB Key Metrics Data from Bloomberg and KraneShares as of 06/26/2024. Data from Bloomberg and KraneShares as of 03/31/2024.
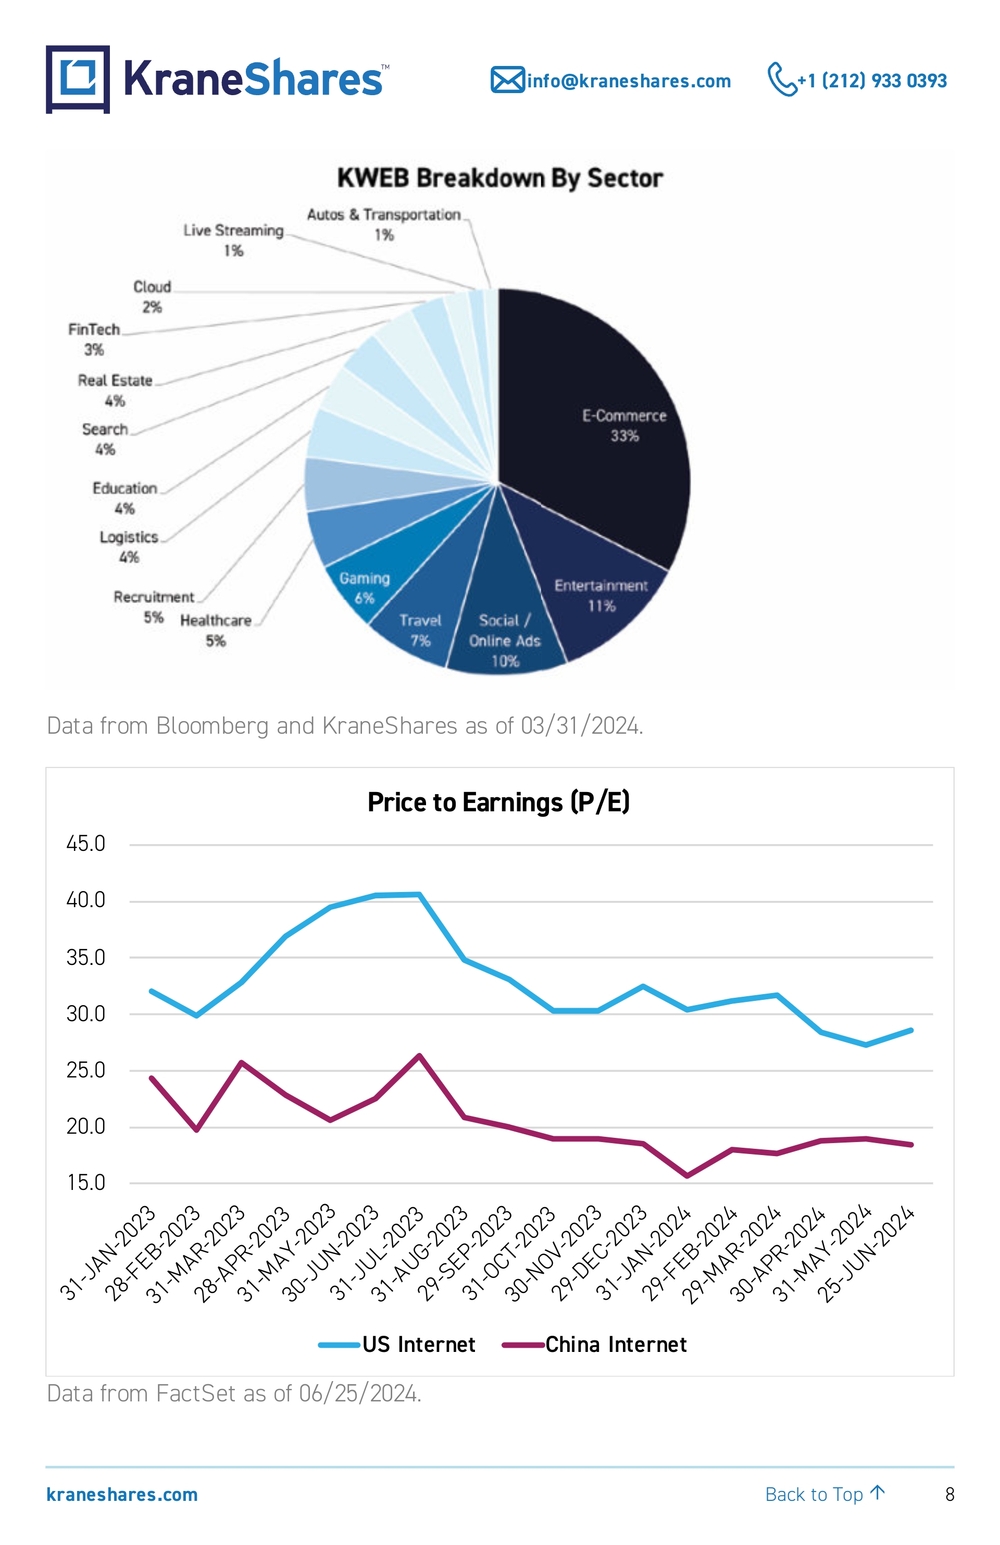
8 kraneshares.com info@kraneshares.com +1 (212) 933 0393 Back to Top ↑ Data from Bloomberg and KraneShares as of 03/31/2024. 15.020.025.030.035.040.045.0 31-JAN-2023 28-FEB-2023 31-MAR-2023 28-APR-2023 31-MAY-2023 30-JUN-2023 31-JUL-2023 31-AUG-2023 29-SEP-2023 31-OCT-2023 30-NOV-2023 29-DEC-2023 31-JAN-2024 29-FEB-2024 29-MAR-2024 30-APR-2024 31-MAY-2024 25-JUN-2024Price to Earnings (P/E) USInternet ChinaInternet Data from FactSet as of 06/25/2024.
9 kraneshares.com info@kraneshares.com +1 (212) 933 0393 Back to Top ↑Subsector Analysis Sources: Bloomberg, CICC Research, KraneShares. Travel revenues increased by +39%, driven by a resurgence in domestic tourism and outbound travel. Trip.com’s Executive Chairman, James Liang, said that industry growth primarily stemmed from a more stabilized supply and further relaxation of visa requirements. However, Tongcheng Travel led in the subsector with revenue growth of 49%, resulting from continued collaboration with Tencent and the development of a mobile application to attract young customers. Recruitment platform Kanzhun reported a robust +33% revenue increase in Q1 2024. The platform expanded its user base to reach over 44 million average monthly users, up by 17% from the same quarter in 2023. Job seekers are plentiful in China today, and Kanzhun’s BOSS Zhipin app is critical to reducing unemployment. Logistics platform Full Truck Alliance delivered a substantial +33% revenue growth, propelled by heightened demand across industrial, consumer, and imported goods sectors. Full Truck’s monthly average users reached 2.1 million in the first quarter, a 22% increase. E-Commerce revenues surged by +29% in Q1 2024, as most major E-Commerce platforms beat analyst estimates on revenue and net income. Meituan has benefitted from strong demand for its in-store deals despite slowing food delivery revenue. Meanwhile, Alibaba’s strategic plan, rooted in price competitiveness and user experience orientation, led to year-to-year gross merchandise value (GMV) growth from more purchases and greater purchase frequency.
10 kraneshares.com info@kraneshares.com +1 (212) 933 0393 Back to Top ↑Education posted a solid +29% revenue growth, led by Tal Education Group’s impressive 60% revenue growth. Growing demand for online and blended learning solutions is benefiting platforms that were able to pivot following a significant regulatory overhaul in the sector. Tal Education Group is steadily growing by increasing sales and marketing expenses to acquire a larger share of the market. Furthermore, this growth investment is showing results because, despite increased expenses, Tal Education Group had its first profitable year in 2023 since the regulatory overhaul. Meanwhile, Fenbi continued to increase its R&D investment budget to develop an AI Teacher that will offer 24/7, personalized support. Live Streaming revenues surged by +16% in the first quarter, driven by East Buy’s 34% revenue growth. The platform developed more self- branded products to diversify its revenue stream after explosive growth over the past year. JOYY Inc. saw strong user growth during the period, as its global monthly average number of users reached 277.3 million. Cloud platform Kingsoft maintained its growth trajectory with a +9% revenue increase in Q1 2024, supported by increasing adoption of local providers. Sentiment in the subsector has improved over the past six months thanks to Alibaba Cloud’s potential IPO. Kingsoft’s Chairman highlighted continued R&D investment in AI technologies to optimize its product portfolio to support intelligent office solutions. Gaming platform NetEase continued to show steady performance and enduring popularity across diverse game franchises, resulting in a modest +7% revenue growth. The gaming giant renewed a publishing agreement with Blizzard Entertainment, bringing international titles back
11 kraneshares.com info@kraneshares.com +1 (212) 933 0393 Back to Top ↑to China, and entered a broader collaboration with Microsoft Gaming.6 NetEase continues to see a loyal customer base for its flagship games and new users from diverse genre expansion. Healthcare revenues grew by +5% in Q1 2024, navigating regulatory challenges while expanding digital health solutions. YSB Inc.’s market share expansion in online pharmacy underscored growing consumer confidence in digital healthcare. Alibaba Health had the largest revenue growth in the sector, amounting to 36% year-over-year growth. Entertainment revenues grew a strong +5%. The video-sharing platform, Bilibili, and the short-video platform, Kuaishou, led the pack in terms of revenue growth. Tencent Music has unveiled a large audio model to increase music promotion accuracy and a new AI Assistant. Monthly average Bilibili users rose to a new high of 342 million in the first quarter with average daily user engagement at 105 minutes. Auto marketplace Autohome reported a modest +5% revenue growth in Q1 2024, reflecting a recovering vehicle sales market in China. Autohome saw user growth of 8%, reaching 69.4 million users in March due to their content-focused strategy. Autohome continues to expand its franchise business and rolled out “trade-in for new” initiatives in response to the national policy, which is driving revenue and user growth. Fintech revenues increased by a modest +4%, driven by new customer acquisition channels on E-Commerce, online payment, and short-video platforms. Qifu Technology Inc. and Zhong An Online led the charge with strong revenue growth. Meanwhile, Lufax saw revenue decline as the platform re-vamps its business model to focus on consumer lending. Mr. Yong Suk Cho, Lufax’s Chief Executive Officer, placed emphasis on
12 kraneshares.com info@kraneshares.com +1 (212) 933 0393 Back to Top ↑“long-term” stability and growth in their Q1 earnings call. Check out this edition’s theme highlight to learn more about Lufax and Qifu and why a turnaround in fintech is important for China’s Internet as a whole. Search platform and AI leader Baidu maintained steady growth with a modest +1% increase in revenue. Continued enhancements in AI-driven search capabilities and user experience innovations have supported Baidu’s position as the top search engine in China. Open AI, the maker of Chat GPT, has chosen to depart from China’s market, which is a significant catalyst for Baidu’s ERNIE Bot, the most used chatbot in China. Social/Online Ad revenues slightly increased by +1%. Advanced AI- driven content targeting services led some advertisers to increase their spending, helping Tencent achieve revenue growth of +6%. Real Estate company KE Holdings, which operates the popular “Beike” real estate platform, experienced a -19% revenue decline in the first quarter. However, KE Holdings has been able to partially offset the revenue downturn with net revenues from housing renovation and furnishing.
13 kraneshares.com info@kraneshares.com +1 (212) 933 0393 Back to Top ↑Theme Highlight – Revisiting China’s Fintech Ecosystem: A New Era? China’s financial technology ecosystem has been out of sight and out of mind for many investors and analysts ever since Ant Financial’s potential blockbuster IPO was postponed at the end of 2020. We believe it could be time to revisit the dynamic industry. After having grappled with regulatory changes and macroeconomic headwinds, many consumer finance and micro-lending platforms have adjusted their business models to meet the moment and capitalize on new opportunities, which we believe could ring in a new era of sustainable growth. Despite this progress, fintech platforms still trade at relatively low valuations, often the lowest among their China internet peers. Nonetheless, they often boast high cash levels, strong balance sheets, and improving growth prospects. We believe fintech could be due for a re-rating, which would benefit China’s internet sector as a whole. Two key leaders in China’s fintech space are KWEB holdings Lufax and Qifu Technology.
14 kraneshares.com info@kraneshares.com +1 (212) 933 0393 Back to Top ↑Lufax is a leading online lender in China that has traditionally focused on small business owners (SBOs), helping them meet their businesses’ finding needs. Qifu Technology, known as 360 Digitech to its customers, on the other hand, has traditionally been focused on small, subprime consumer lending. The Consumer is Key to Growth Lufax management told KraneShares that the platform would be pivoting to an increased focus on consumer lending from its original SBO business. This decision was driven by macroeconomic headwinds facing small businesses in China and expectations for a consumer rebound in China. However, this pivot is significant for the platform because they expect consumer loans to account for 40% of their portfolio, up from less than 10% previously. Before the pandemic, Lufax’s SBO lending business was immensely profitable. Management said that SBOs are important for accessing small and medium-sized enterprises (SMEs) because SMEs typically do not survive more than three years and, therefore, have often found it difficult to access bank loans or private credit in China. Moreover, according to Lufax, founders who are SBOs may have multiple businesses with funding needs and therefore a higher rate of success and longevity than individual businesses. In this manner, Lufax was able to serve a demographic of well-qualified borrowers that was underserved by the traditional banking system. However, for now SMEs are lagging their larger, often state-linked peers in China. Their recovery since pandemic restrictions were dropped in 2022 has been muted. As a result, Lufax experienced a deterioration in
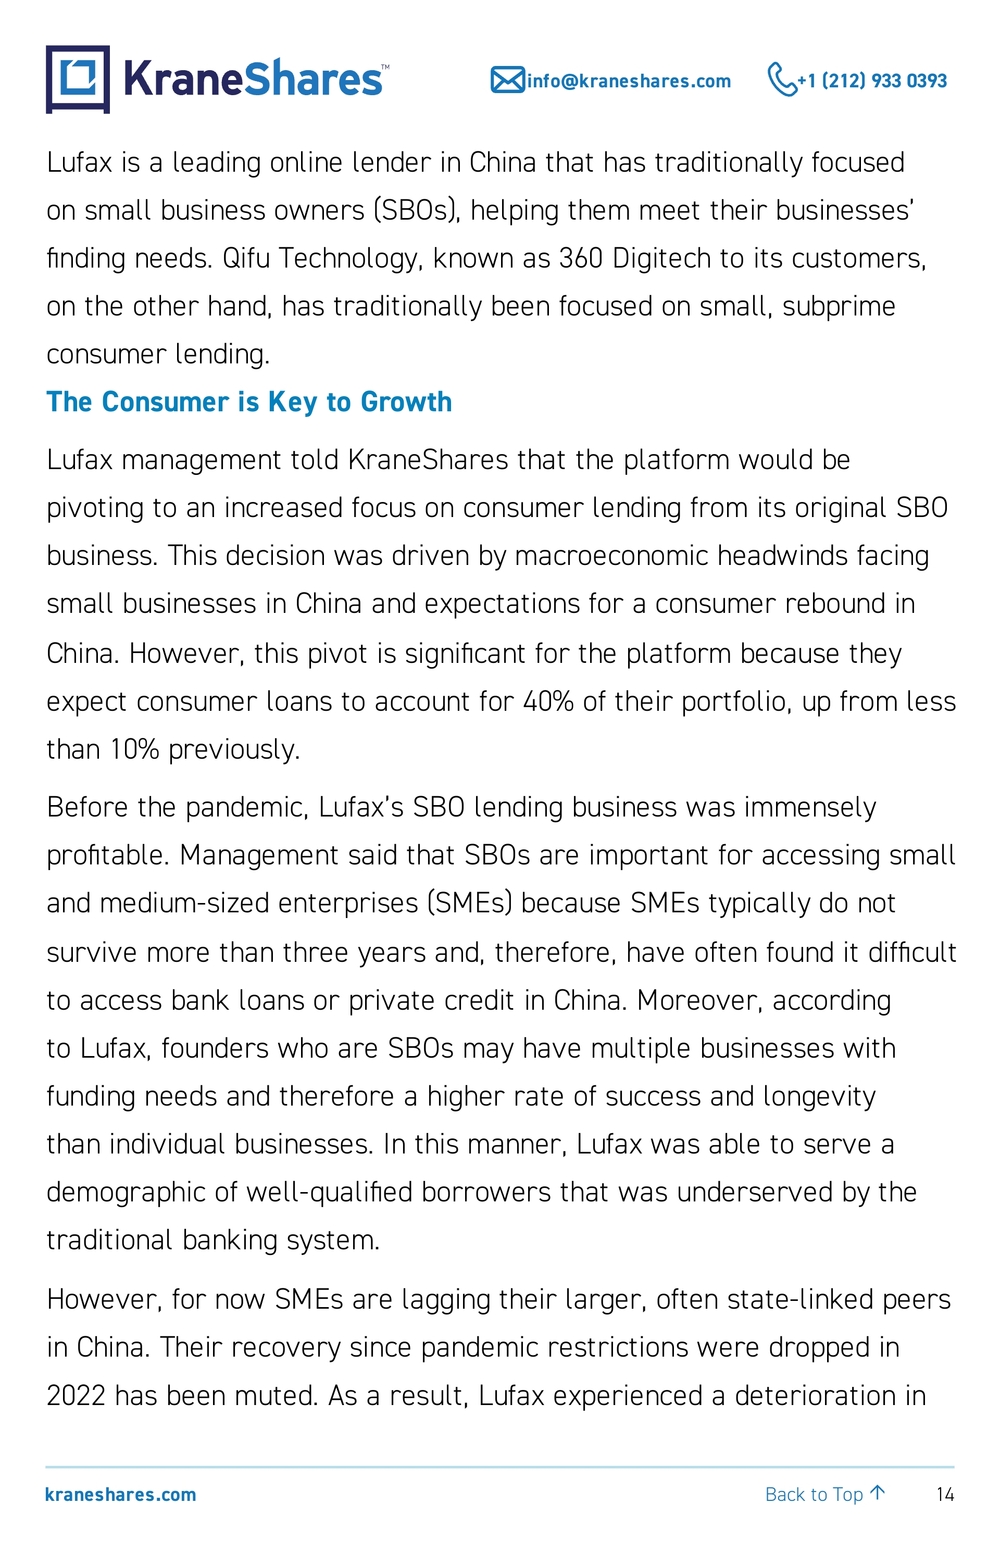
15 kraneshares.com info@kraneshares.com +1 (212) 933 0393 Back to Top ↑asset quality in the first quarter of 2022. Management believes that consumer lending can better weather economic downturns because the loan sizes tend to be smaller and more manageable for repayment. Furthermore, the consumer is rebounding faster than SMEs and management expects this trend to continue. However, they intend to maintain a strong foothold in the SBO lending market, reminding that SMEs still account for 80% of jobs in China. Meanwhile, Qifu Technology has always been laser-focused on consumer lending, especially on the sub-prime segment. This has led their stock to outperform Lufax since the start of 2023 and their revenue to remain stable in comparison. 02,0004,0006,0008,00010,00012,000 Q1 2023 Q2 2023 Q3 2023 Q4 2023 Q1 2024CNY, MillionsQuarterly Revenue Lufax Qifu Data from Bloomberg as of 3/31/2024. Please see the end of the report for definitions.
16 kraneshares.com info@kraneshares.com +1 (212) 933 0393 Back to Top ↑Qifu management told KraneShares that their lending business is helping to power China’s consumer rebound, as their borrowers up their spending on home improvements, travel, and automobiles. Regulatory headwinds have blown away China’s financial regulatory landscape has changed in three major ways since Ant postponed its IPO: Tighter caps on loans, a requirement that all businesses involved in lending register to receive a financial guarantee license, and the conglomeration of multiple financial regulatory authorities into one “super-regulator”. These changes initially caused headaches for businesses but are now supporting a more sustainable consumer lending ecosystem, according to Lufax’s management. Initially, many online lenders responded to regulatory changes by stepping up partnerships with larger banks to originate loans, rather than go through the lengthy process of securing a financial guarantee license. Now, most online lenders possess licenses, ensuring that they can continue to provide innovative financial services for their customers. Lufax’s management attests to the more sustainable nature of the online lending ecosystem following the change in the regulatory environment. According to them, prior to 2021, the industry was seeing breakneck growth but was a regulatory “Wild West” with many unaccounted-for potential liabilities. Technological innovation may drive growth for Lufax and Qifu. Both Lufax and Qifu are investing heavily in new technologies, many of which are unheard of among US-based fintech platforms. These new technologies range from faster loan funding to more efficient and
17 kraneshares.com info@kraneshares.com +1 (212) 933 0393 Back to Top ↑dynamic credit assessment. Lufax now enables instant transfers of loan funds. These transfers happen instantly upon approval, which only takes 20 to 30 minutes for certain loan types. Credit assessment is also an area where both platforms are innovating. Both platforms utilize the credit database maintained by the People’s Bank of China (PBOC), China’s central bank, when making their credit decisions. This system is commonly used by lenders in China, whether online or brick-and-mortar-based. However, both platforms have additional assessment techniques that can bolster their lending businesses. Lufax allows users to chat with an AI bot with advanced lie-detection techniques. Customers who choose to use this feature may receive faster approvals or lower interest rates. Meanwhile, Qifu offers lower interest rates to borrowers willing to offer up their online footprints, allowing the platform to monitor their web activity to determine how much time is spent on productive activities. Investment considerations and implications for China’s internet sector. Despite being comparable to online lenders such as SoFi in the United States, Lufax and Qifu have vastly different profiles as investments. At present, they are not growing as quickly as SoFi but offer attractive dividend yields. However, Qifu is profitable, unlike SoFi and Lufax.
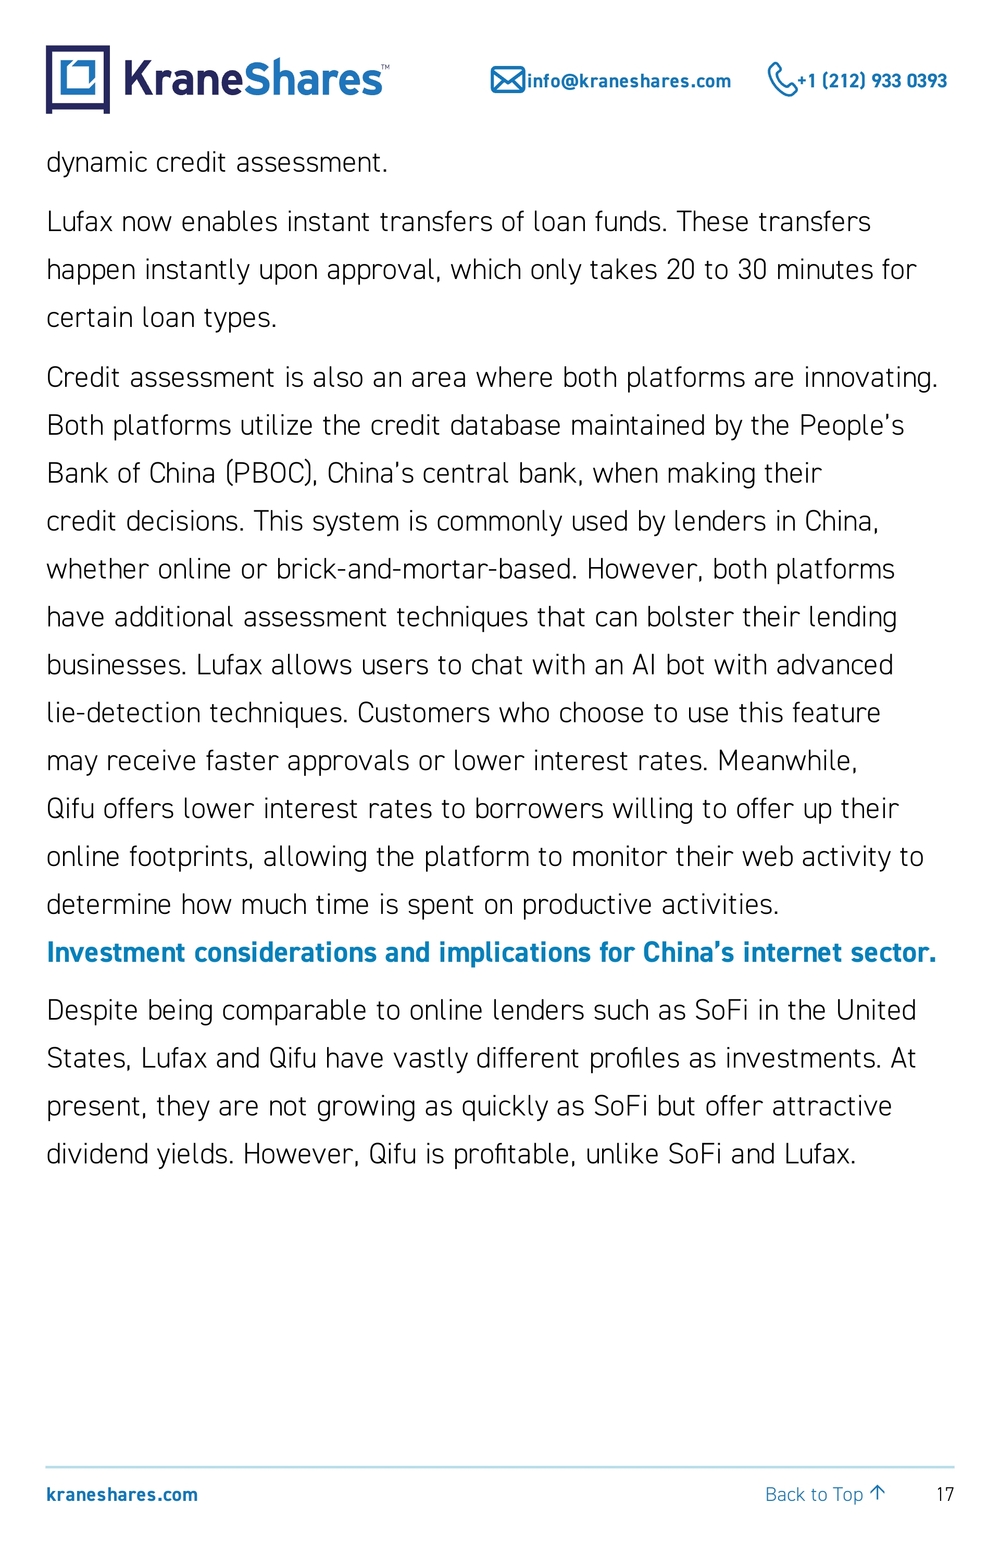
18 kraneshares.com info@kraneshares.com +1 (212) 933 0393 Back to Top ↑ Data from Bloomberg as of 03/31/2024 These characteristics have benefited the share prices of Lufax and Qifu so far this year, and both have outperformed SoFi. Meanwhile, Lufax has outperformed both Qifu and SoFi thanks in part to a special dividend announced in March.
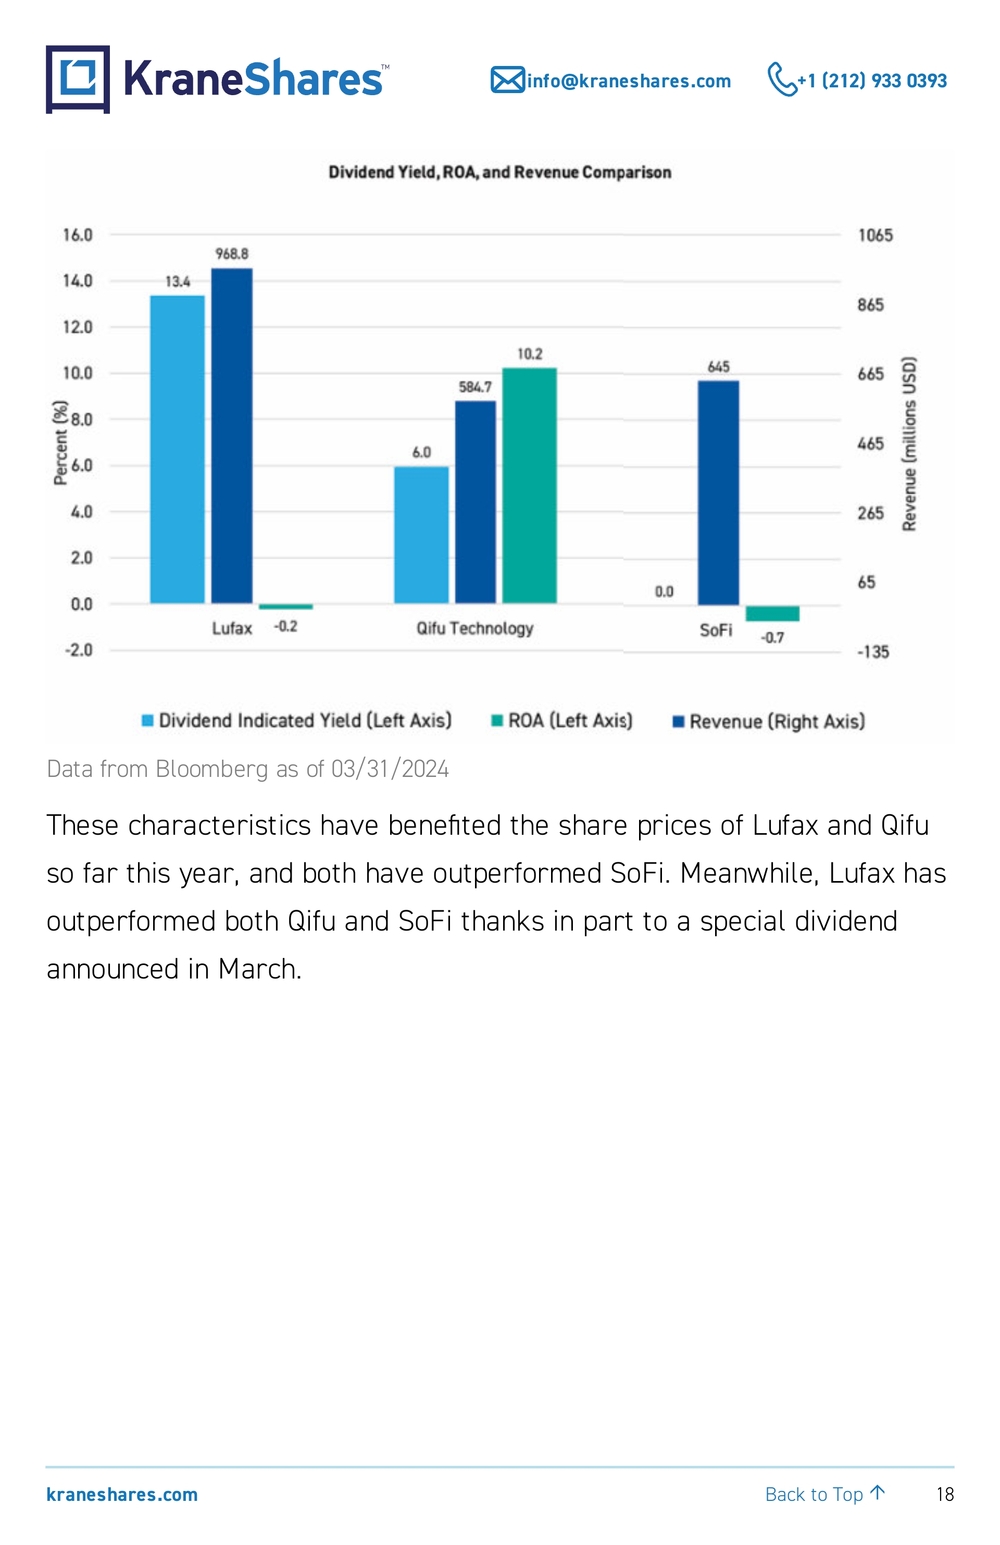
19 kraneshares.com info@kraneshares.com +1 (212) 933 0393 Back to Top ↑Lufax declares a special cash dividend in the amount of $2.37 per share 6,0008,00010,00012,00014,00016,00018,000 1/2/2024 2/2/2024 3/2/2024 4/2/2024 5/2/2024 6/2/2024Growth of 10,000 unitsYTD Performance Comparison Lufax QifuTechnology SoFi Data from Bloomberg as of 06/27/2024. Past performance does not guarantee future results. We believe a recovery in fintech is important for China’s internet sector overall. The postponement of Ant Group’s IPO marked the beginning of a challenging period for China internet stocks, characterized by investor anxiety over changes in regulations, not just for fintech, but also for E-Commerce. As such, the industry represents a meaningful bellwether for the internet sector overall. Although Ant Group’s share offering is not yet on the calendar, we believe the increased optimism expressed by the management teams of both Lufax and Qifu, their increasing investment in China’s consumer, the positive performance so far this year, and the payment of healthy dividends are all positive signs.
20 kraneshares.com info@kraneshares.com +1 (212) 933 0393 Back to Top ↑Conclusion We believe it could be time to revisit China’s fintech sector due to the recent increase in its consumer focus, the resolution of many regulatory headwinds that have plagued the industry in recent years, the technological innovations occurring, and online lenders’ strong balance sheets. If nothing else, recent positive developments in the industry may also indicate improving conditions in China’s internet sector overall, given the fintech industry’s bellwether status for the sector. KWEB Top 10 Holdings Earnings Update Sources: Bloomberg, CICC Research, Company releases & filings, KraneShares. % changes are year-over-year (YoY) unless otherwise indicated. Revenue figures are adjusted (non-GAAP). Please see the end of the report for KWEB top ten holdings as of the most recent quarter end. Tencent Tencent is a diversi fied consumer technology company with businesses in social media, cloud services, payments, and online advertising. Tencent’s most well-known product is WeChat, one of China’s premier social media platforms with over one billion monthly active users (MAUs). Tencent By The Numbers (Q1 2024) •Revenue +6% to RMB 159.5B ($22.2B) •Net Income RMB 42.3B ($5.9B) •Net Margin 26.5% •Earnings Per Share RMB 4.43 ($0.62) Tencent had a positive quarter, beating analyst estimates thanks to a +25% rebound in online advertising revenue. China gaming revenue declined -2%, though international games revenue was up by +34%, led
21 kraneshares.com info@kraneshares.com +1 (212) 933 0393 Back to Top ↑by title Brawl Stars. Management did an excellent job at driving down costs, resulting in a +54% net income boost. Chairman, Founder, and CEO Huateng “Pony” Ma stated that “Executing on our commitment to return excess capital to shareholders, we stepped up our buyback plan and are on track to repurchase HKD 100 billion worth of our shares in 2024 and paid an increased dividend.” Under its current program, Tencent will repurchase $4.01 billion worth of its shares through May 13, 2025. Alibaba Alibaba is a conglomerate primarily engaged in the E-Commerce industry. The company operates an online marketplace offering a wide variety of consumer goods. The company has also expanded beyond E-Commerce and is now a consortium of six businesses covering cloud, domestic E-Commerce, global E-Commerce, media, logistics, and local services. Alibaba By The Numbers (Q1 2024) •Revenue +6.6% to RMB 221.8B ($30.9B) •Net Income RMB 18.0B ($2.5B) •Net Margin 8.1% •Earnings Per Share RMB 7.21 ($1.0) Alibaba’s earnings release was a topline revenue beat, though adjusted net income and adjusted EPS missed expectations. The income statement shows expenses rose incrementally, but the miss on the bottom line came from a decline in interest and investment income, leading the
22 kraneshares.com info@kraneshares.com +1 (212) 933 0393 Back to Top ↑company’s margin to be lower than is typical in the first quarter. China E-Commerce revenue increased by +4% YoY to RMB 93.216B ($12.91B), while international E-Commerce gained +45% YoY to RMB 27.448B ($3.802B). Alibaba executives told KraneShares that their Hong Kong shares could be included in Southbound Stock Connect as soon as August after becoming their primary listing, a significant catalyst. The company announced an annual dividend of $1 per ADR and a special one- time dividend of $0.66. Under its current Program, Alibaba will repurchase $26.10 billion worth of its shares through March 31, 2027. Meituan Meituan is an E-Commerce company that specializes in food delivery and other local services. Meituan is the product of the 2015 merger between Meituan, known as the “Groupon of China,” and Dianping, known as the “Yelp of China.” The company now operates many business lines, including general retail, restaurant booking, and travel booking services, serving over 600 million registered users. Meituan By The Numbers (Q1 2024) •Revenue +25% to RMB 73.3B ($10.2B) •Net Income RMB 6.4B ($0.9B) •Net Margin 8.7% •Earnings Per Share RMB 1.13 ($0.16) Meituan beat analyst estimates in its first quarter results. The company has seen a stronger pick up in in-store deals and goods compared to food delivery this year. The dialing back of some user subsidies likely led
23 kraneshares.com info@kraneshares.com +1 (212) 933 0393 Back to Top ↑to the strong increase in net income, up +123%. The company has also been stepping up promotions and sales in lower-tier cities, viewed as a promising growth area by management. The platform is also expanding overseas, targeting Middle Eastern markets, according to management. Under its current program, Meituan will repurchase $1.64 billion worth of its shares, though the company has not set an intended completion date for this program. PDD Holdings PDD’s platform was one of the fi rst to embrace a hybrid of E-Commerce and social media. The company started by allowing users to share deals and then form “shopping teams” to drive down the prices they pay for goods. PDD operates under the name “Pinduoduo” in China and “Temu” in the rest of the world. PDD has rapidly gained market share in E-Commerce globally since its establishment in 2015 and is now the fi fth- largest E-Commerce platform in the world. PDD Holdings By The Numbers (Q1 2024) •Revenue +131% to RMB 86.9B ($12.0B) •Net Income RMB 28.0B ($3.9B) •Net Margin 32.3% •Earnings Per Share RMB 18.98 ($2.64) E-Commerce company PDD Holdings (PDD US), which owns shopping apps Pinduoduo and Temu, exceeded analyst expectations for its earnings per share by 2x in the first quarter. The company is never overly verbose, as management is solely focused on the company’s daily operations. The lack of communication with analysts and shareholders likely contributed
24 kraneshares.com info@kraneshares.com +1 (212) 933 0393 Back to Top ↑to the huge disparity between analysts’ models and the results. PDD may encounter increased marketing expenses though to keep up its edge compared to Alibaba’s AliExpress and SHEIN in international markets. NetEase NetEase is a consumer information technology company primarily dealing in online, PC, and mobile games. It is one of the largest gaming companies in the world, and its titles include Knives Out and Naraka: Bladepoint. NetEase By The Numbers (Q1 2024) •Revenue +7% to RMB 26.9B ($3.7B) •Net Income RMB 7.4B ($1.0B) •Net Margin 27.6% •Earnings Per Share RMB 11.39 ($1.58) NetEase beat analyst expectations across the board in the first quarter. NetEase continues to pay dividends, as one of the first China internet companies to adopt a strong dividend policy. They paid a dividend of $0.49 per ADR in the first quarter. Under its current program, NetEase will repurchase $4.97 billion worth of its shares through January 6, 2026. Trip.com Trip.com is a travel booking site widely recognized as an international competitor to Expedia. It provides search and complete booking services for fl ights, hotels, trains, car rentals, and more. The company offers international and domestic travel booking services to Chinese and global customers.
25 kraneshares.com info@kraneshares.com +1 (212) 933 0393 Back to Top ↑Trip.com By The Numbers (Q1 2024) •Revenue +29% to RMB 11.9B ($1.7B) •Net Income RMB 3.6B ($0.5B) •Net Margin 30.3% •Earnings Per Share RMB 5.33 ($0.74) Trip.com beat expectations on the big three: revenue, net income, and earnings per share (EPS). According to Executive Chairman James Liang, “The year 2024 has begun with a significant increase in both domestic and outbound travel demand in China…”. On the company’s earnings call, Liang noted that inbound tourist travel increased +400% in the first quarter, driven by China waiving visas for visitors from 15 European and Asian countries. CEO Jane Sun noted that “Our domestic hotel and air ticket booking increased by 20% and 30% ….”. Meanwhile, outbound tourism is expected to reach 80% of 2019 levels, though the company plans to attract more users from broader Asia, which is 1.5x larger than China. Under its current program, Trip.com will repurchase $300 million worth of its shares, though the company has not set an intended completion date for this program. Kanzhun Founded in 2014, Kanzhun operates “BOSS Zhipin”, which has become the largest online recruitment platform in China, as measured by monthly active users. The platform connects enterprises and individual job seekers in a seamless and interactive manner through its mobile- first application.
26 kraneshares.com info@kraneshares.com +1 (212) 933 0393 Back to Top ↑Kanzhun By The Numbers (Q1 2024) •Revenue +33% to RMB 1.7B ($0.2B) •Net Income RMB 0.2B ($0.03B) •Net Margin 14.4% •Earnings Per Share RMB 0.27 ($0.04) Kanzhun beat estimates slightly on revenue but missed on earnings per share in the first quarter. The company’s monthly active users increased +17% to near 50 million. However, job seekers currently outnumber employers, which would suggest that further growth is coming soon. The company has been investing heavily in AI tools for job applicants and employers, the cost of which may have weighed on its bottom line. Under the current program, Kanzhun will repurchase $1.38 billion worth of its shares through June 27, 2025. Tencent Music Entertainment Tencent Music operates an online entertainment platform that encompasses music, podcasts, audiobooks, online karaoke, and live streaming. The platform also offers a broader community around music, allowing fans to connect with each other and socialize. Tencent Music Entertainment By The Numbers (Q1 2024) •Revenue -3% to RMB 6.8B ($0.9B) •Net Income RMB 1.5B ($0.2B) •Net Margin 21.5% •Earnings Per Share RMB 0.93 ($0.13) Tencent Music beat estimates for its bottom-line net income in the first
27 kraneshares.com info@kraneshares.com +1 (212) 933 0393 Back to Top ↑quarter. The company’s shift to focus on increasing paying users is showing some early success. Its paying customers were up +20% in the first quarter. However, the company faces some mild headwinds such as rising costs and increased competition in China’s music streaming industry. JD.com JD.com is one of the largest E-Commerce platforms in China. JD owns a large and growing marketplace for a wide variety of goods and offers its own logistics service. JD offers its services to over 500 million users. JD.com By The Numbers (Q1 2024) •Revenue +7% to RMB 260.0B ($36.2B) •Net Income RMB 7.8B ($1.1B) •Net Margin 3% •Earnings Per Share RMB 4.95 ($0.69) JD.com’s earnings results were well ahead of analysts’ expectations on significant increases in adjusted net income and adjusted earnings per share (EPS) versus expectations of a decline. Management cut research and development expenses by -3.6% and general & administrative expenses by -21%, which led to a strong bottom-line beat. Under the current program, JD will repurchase $2.3 billion worth of its shares through March 31, 2027. Full Truck Alliance Logistics app Full Truck Alliance called the “Uber of trucking,” is leading the way in its field with a mission of eliminating empty trucks from the
28 kraneshares.com info@kraneshares.com +1 (212) 933 0393 Back to Top ↑roads. The company went public on the New York Stock Exchange (NYSE) in June 2021. Full Truck Alliance By The Numbers (Q1 2024) •Revenue +33% to RMB 2.3B ($0.3B) •Net Income RMB 0.6B ($0.0B) •Net Margin 25.6% •Earnings Per Share RMB 0.03 ($0.00) Full Truck beat analyst estimates on both its top and bottom line, but the bottom-line beat was stronger, indicating costs were likely lower than expected. The platform saw monthly active users increase +22% in the first quarter. Transaction services were the star of the quarter as revenue from the segment increased by over 60%. This segment refers to the commissions charged on transactions made on the platform, as opposed to off-platform after truckers and shippers are matched. CICC analysts think this segment has done better than initially expected and will likely be a key driver of growth. Full Truck Alliance will repurchase $22 million worth of its shares through March 12, 2025. Citations
- Bloomberg News. “How OpenAI’s Decision Not to Operate in China Will Reshape the Chinese AI Scene,” Time. June 26, 2024.
- Feng, Coco. “Tencent’s Roco Kingdom: World among 104 nee video games approved in Beijing in June,” South China Morning Post.
- Feng, Coco. “China approves 96 new video games in May, with market leaders Tencent, NetEase missing from list,” South China
29 kraneshares.com info@kraneshares.com +1 (212) 933 0393 Back to Top ↑Morning Post. 4. Data from FactSet as of 6/30/2024. 5. Data from Hong Kong Exchanges & Clearing as of 6/30/2024. 6. News Release. “Blizzard Entertainment and NetEase Renew Agreement to Bring Beloved Titles Back to China; Microsoft Gaming, NetEase Enter Broader Collaboration,” NetEase. April 9, 2024. Index Definitions The CSI Overseas China Internet Index (China Internet) selects overseas listed Chinese Internet companies as the index constituents; the index is weighted by free float market cap. The index can measure the overall performance of overseas listed Chinese Internet companies. The Index is within the scope of the IOSCO Assurance Report as of 30 September 2018. The index was launched on September 20, 2011. The Dow Jones US Internet Composite Index (US Internet) is designed to measure the performance of the 40 largest and most actively traded stocks of U.S. companies in the internet industry. To be eligible for the index, a company must derive at least 50% of cash flows from the internet. The index was launched on February 18, 1999. Term Definitions: Revenue: The money that a company makes from selling goods and/ or services, usually over a certain period. In this case, the period is quarterly. Net Income: A company’s pro fit or total revenue minus total expenses. Net Margin: A company’s net income divided by its total revenue, usually
30 kraneshares.com info@kraneshares.com +1 (212) 933 0393 Back to Top ↑expressed as a percent. This is also referred to as a pro fit margin and helps determine how pro fitable a business is. Earnings per Share: A company’s total revenue divided by the number of shares of that company. Revenue Growth: A company’s revenue growth over a given period; in this case, the change is recorded over a year from Q2 2022 to Q2 2023. Price-to-Earnings (P/E) Ratio: A way to value a company by comparing its stock price to earnings. P/E equals the share price divided by a company’s earnings per share (EPS). Buyback Yield: Buyback yield reflects the potential impact of current share repurchase programs being carried out. It is expressed as the value of the remaining share repurchases as a percentage of the company’s market capitalization. Gross Merchandise Value (GMV): The total value of merchandise sold over a given period of time. Carefully consider the Funds’ investment objectives, risk factors, charges, and expenses before investing. This and additional information can be found in the Funds’ full and summary prospectus, which may be obtained by visiting www.kraneshares.com/kweb. Read the prospectus carefully before investing. Risk Disclosures: Investing involves risk, including possible loss of principal. There can be no assurance that a Fund will achieve its stated objectives. Indices are unmanaged and do not include the effect of fees. One cannot invest directly in an index. This information should not be relied upon as research, investment advice, or a recommendation regarding any products, strategies, or any security in particular. This material is strictly for illustrative, educational, or informational