KraneShares Levered ETF Suite | BABA, PDD & More
by Kraneshares
KraneShares Single
Stock
Levered ETF Suite:
Bullish Strategies For
Global CompaniesKBAB
KPDD
6/30/2026
KMLI
KJD
KBDU
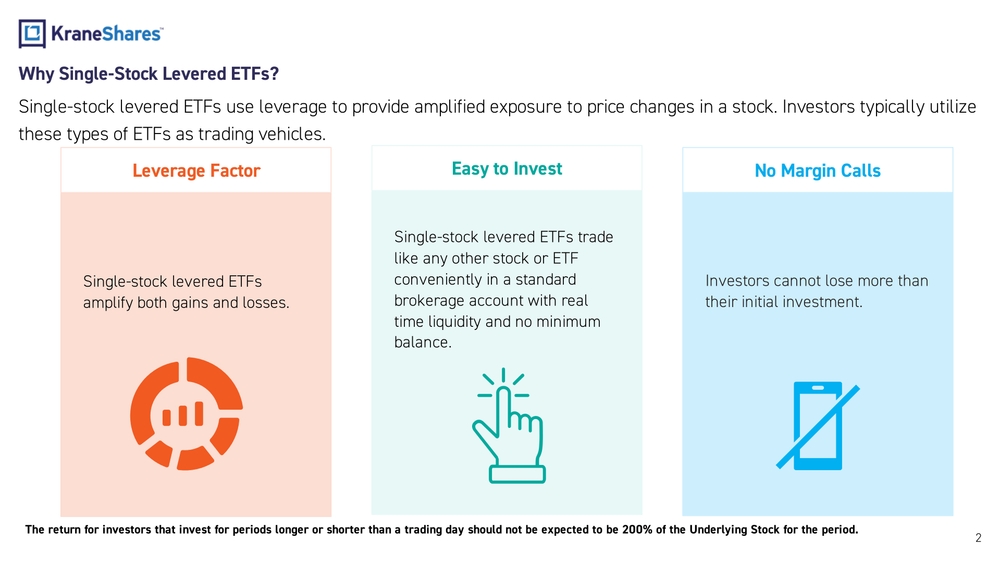
Single -stock levered ETFs amplify both gains and losses. 2Why Single -Stock Levered ETFs? Single -stock levered ETFs use leverage to provide amplified exposure to price changes in a stock. Investors typically utilize these types of ETFs as trading vehicles. Investors cannot lose more than their initial investment.Single -stock levered ETFs trade like any other stock or ETF conveniently in a standard brokerage account with real time liquidity and no minimum balance. Easy to Invest Leverage Factor No Margin Calls The return for investors that invest for periods longer or shorter than a trading day should not be expected to be 200% of th e Underlying Stock for the period.
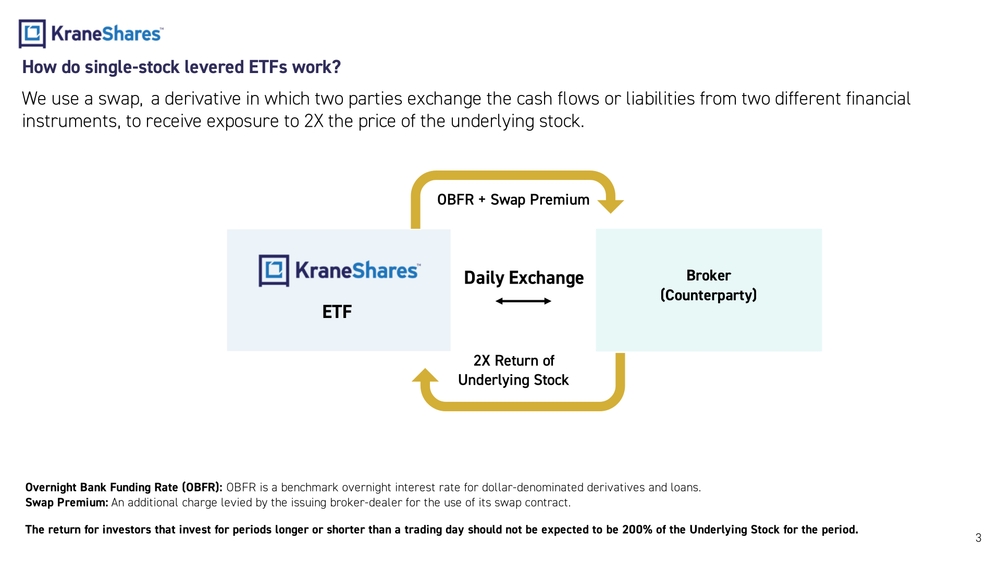
3How do single -stock levered ETFs work? We use a swap, a derivative in which two parties exchange the cash flows or liabilities from two different financial instruments, to receive exposure to 2X the price of the underlying stock. Broker (Counterparty) OBFR + Swap Premium 2X Return of Underlying StockDaily Exchange Overnight Bank Funding Rate (OBFR): OBFR is a benchmark overnight interest rate for dollar -denominated derivatives and loans. Swap Premium: An additional charge levied by the issuing broker -dealer for the use of its swap contract.ETF The return for investors that invest for periods longer or shorter than a trading day should not be expected to be 200% of th e Underlying Stock for the period.
4The KraneShares Single -Stock Levered ETF Suite gives investors the tools necessary to place high -conviction trades in global com panies, including China Internet, Emerging Markets, and technology stocks.KraneShares Single -Stock Levered ETF Suite KPDD 2X Long PDD Daily Leveraged Long Funds pursue daily enhanced returns, which heightens their risk compared to non -leveraged options. This increased risk arises from their ability to magnify the performance of the underlying stocks. The return for investors that invest for periods longer or shorter than a trading day s hould not be expected to be 200% of the Underlying Stock for the period.KBAB 2X Long BABA DailyKMLI 2X Long MELI Daily KJD 2X Long JD Daily KBDU 2X Long BIDU Daily
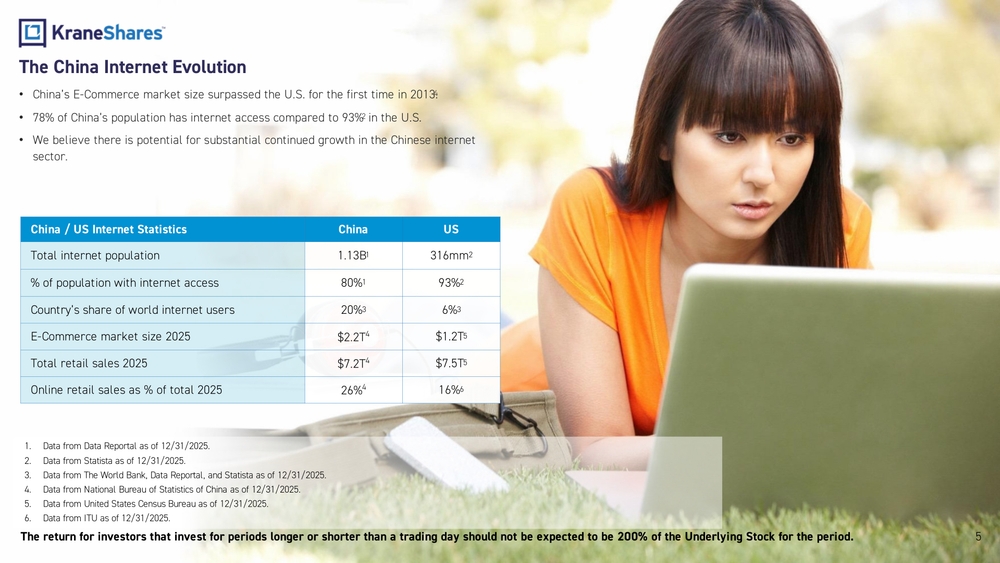
5The China Internet Evolution •China’s E -Commerce market size surpassed the U.S. for the first time in 2013.4 •78% of China’s population has internet access compared to 93%2 in the U.S. •We believe there is potential for substantial continued growth in the Chinese internet sector. The return for investors that invest for periods longer or shorter than a trading day should not be expected to be 200% of th e Underlying Stock for the period.China / US Internet Statistics China US Total internet population 1.13B1 316mm2 % of population with internet access 80%1 93%2 Country’s share of world internet users 20%3 6%3 E-Commerce market size 2025 $2.2T4$1.2T5 Total retail sales 2025 $7.2T4$7.5T5 Online retail sales as % of total 2025 26%416%6
- Data from Data Reportal as of 12/31/2025.
- Data from Statista as of 12/31/2025.
- Data from The World Bank, Data Reportal, and Statista as of 12/31/2025.
- Data from National Bureau of Statistics of China as of 12/31/2025.
- Data from United States Census Bureau as of 12/31/2025.
- Data from ITU as of 12/31/2025.
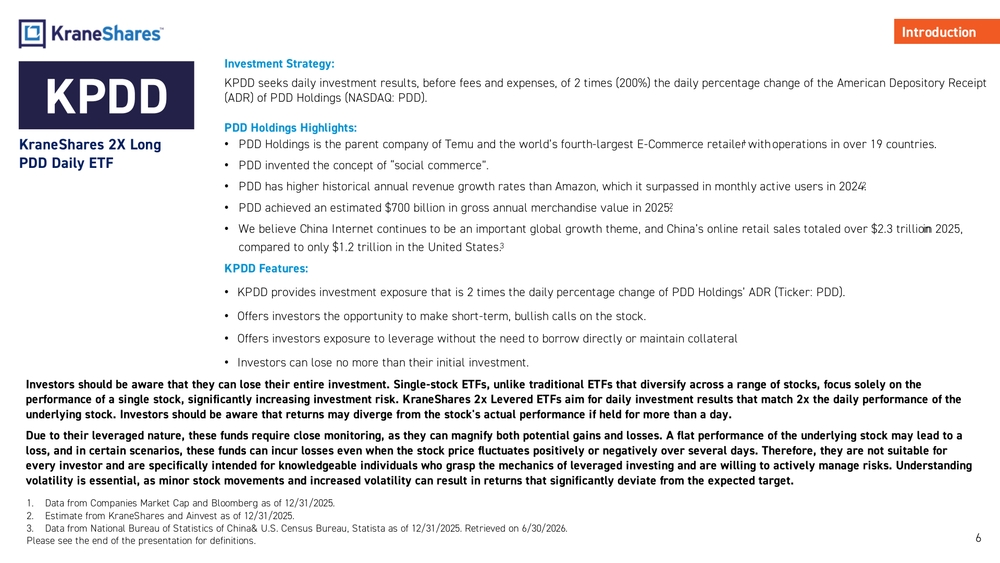
Investment Strategy: KPDD seeks daily investment results, before fees and expenses, of 2 times (200%) the daily percentage change of the American Depository Receipt (ADR) of PDD Holdings (NASDAQ: PDD). PDD Holdings Highlights: •PDD Holdings is the parent company of Temu and the world’s fourth -largest E -Commerce retailer1 with operations in over 19 countries. •PDD invented the concept of “social commerce”. •PDD has higher historical annual revenue growth rates than Amazon, which it surpassed in monthly active users in 2024.2 •PDD achieved an estimated $700 billion in gross annual merchandise value in 2025.2 •We believe China Internet continues to be an important global growth theme, and China’s online retail sales totaled over $2.3 trillion in 2025, compared to only $1.2 trillion in the United States. 3 KPDD Features: •KPDD provides investment exposure that is 2 times the daily percentage change of PDD Holdings’ ADR (Ticker: PDD). •Offers investors the opportunity to make short -term, bullish calls on the stock. •Offers investors exposure to leverage without the need to borrow directly or maintain collateral •Investors can lose no more than their initial investment. 6Introduction KPDD KraneShares 2X Long PDD Daily ETF 1.Data from Companies Market Cap and Bloomberg as of 12/31/2025. 2.Estimate from KraneShares and Ainvest as of 12/31/2025. 3.Data from National Bureau of Statistics of China& U.S. Census Bureau, Statista as of 12/31/2025. Retrieved on 6/30/2026. Please see the end of the presentation for definitions.Investors should be aware that they can lose their entire investment. Single -stock ETFs, unlike traditional ETFs that diversify across a range of stocks, focus solely on the performance of a single stock, significantly increasing investment risk. KraneShares 2x Levered ETFs aim for daily investment results that match 2x the daily performance of the underlying stock. Investors should be aware that returns may diverge from the stock's actual performance if held for more tha n a day. Due to their leveraged nature, these funds require close monitoring, as they can magnify both potential gains and losses. A f lat performance of the underlying stock may lead to a loss, and in certain scenarios, these funds can incur losses even when the stock price fluctuates positively or negatively ov er several days. Therefore, they are not suitable for every investor and are specifically intended for knowledgeable individuals who grasp the mechanics of leveraged investing and are willing to actively manage risks. Understanding volatility is essential, as minor stock movements and increased volatility can result in returns that significantly deviate f rom the expected target.
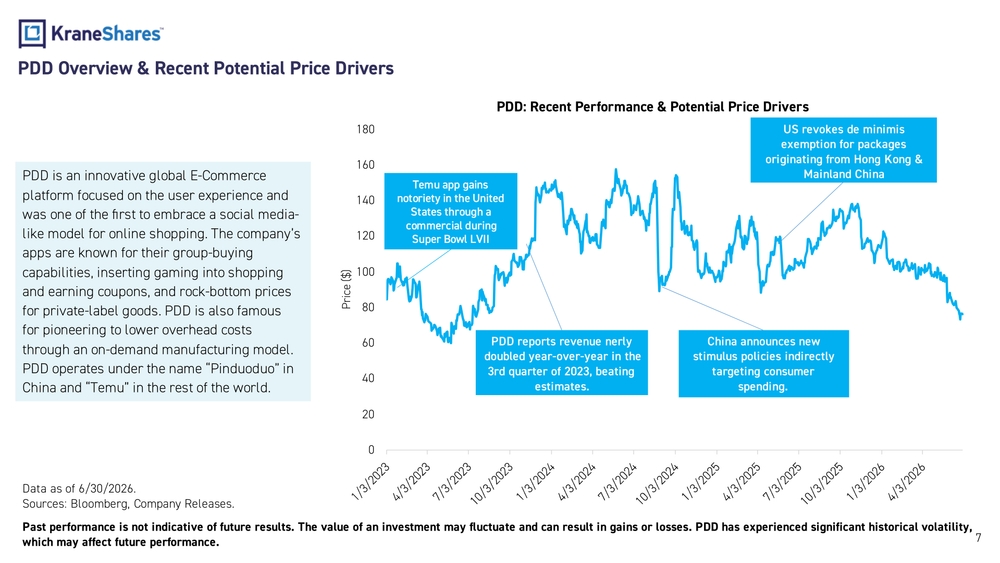
7PDD Overview & Recent Potential Price Drivers
PDD is an innovative global E -Commerce
platform focused on the user experience and
was one of the first to embrace a social media -
like model for online shopping. The company’s
apps are known for their group -buying
capabilities, inserting gaming into shopping
and earning coupons, and rock -bottom prices
for private -label goods. PDD is also famous
for pioneering to lower overhead costs
through an on -demand manufacturing model.
PDD operates under the name “Pinduoduo” in
China and “ Temu ” in the rest of the world.
Data as of 6/30/2026.
Sources: Bloomberg, Company Releases.
Past performance is not indicative of future results. The value of an investment may fluctuate and can result in gains or los ses. PDD has experienced significant historical volatility,
which may affect future performance.020406080100120140160180Price ($)PDD: Recent Performance & Potential Price Drivers
Temu app gains
notoriety in the United
States through a
commercial during
Super Bowl LVII
PDD reports revenue nerly
doubled year -over -year in the
3rd quarter of 2023, beating
estimates.China announces new
stimulus policies indirectly
targeting consumer
spending.US revokes de minimis
exemption for packages
originating from Hong Kong &
Mainland China
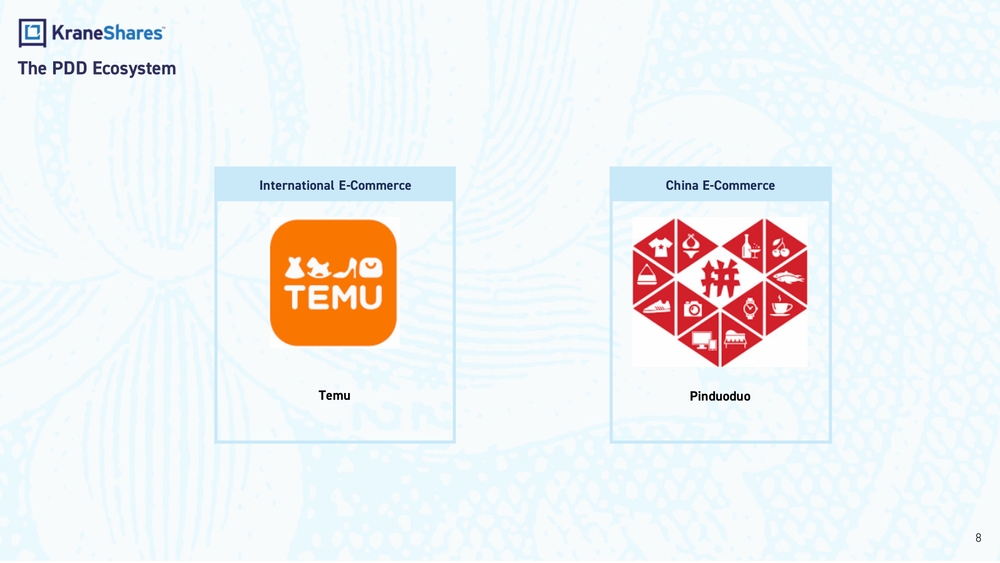
8PinduoduoChina E -Commerce International E -CommerceThe PDD Ecosystem Temu
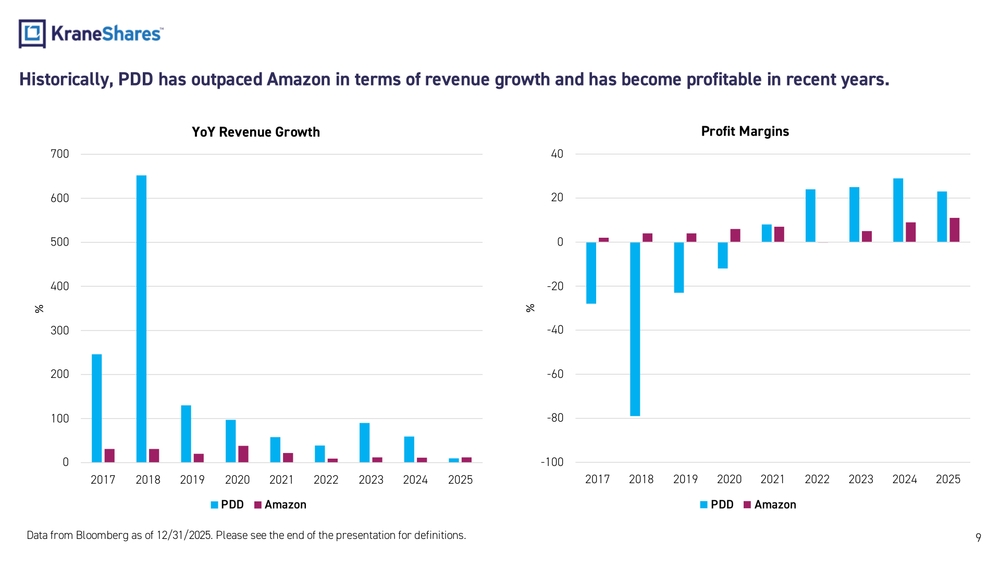
9Historically, PDD has outpaced Amazon in terms of revenue growth and has become profitable in recent years. Data from Bloomberg as of 12/31/2025 . Please see the end of the presentation for definitions.0100200300400500600700 2017 2018 2019 2020 2021 2022 2023 2024 2025%YoY Revenue Growth PDD Amazon-100-80-60-40-2002040 2017 2018 2019 2020 2021 2022 2023 2024 2025%Profit Margins PDD Amazon
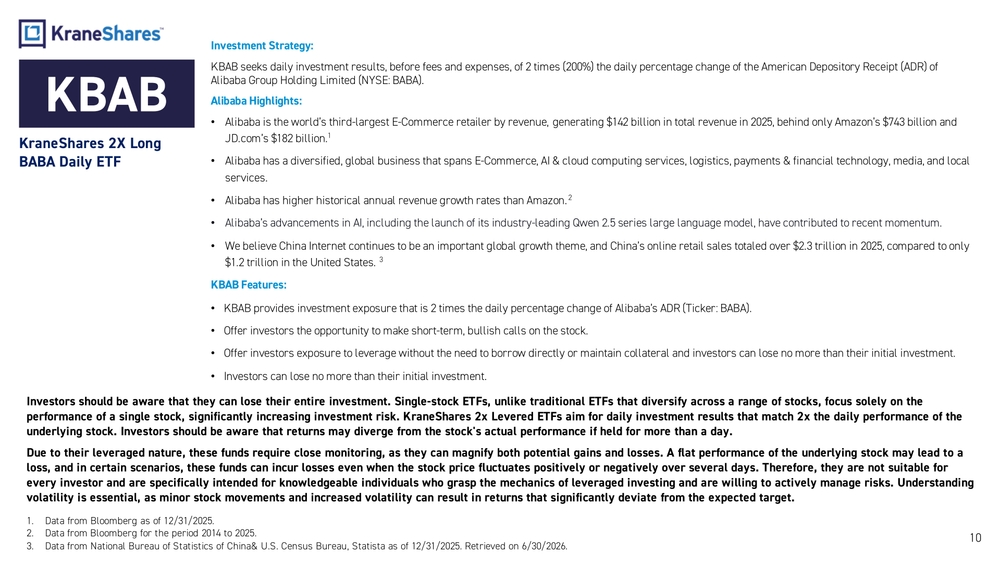
10KBAB KraneShares 2X Long BABA Daily ETFInvestment Strategy: KBAB seeks daily investment results, before fees and expenses, of 2 times (200%) the daily percentage change of the American Depository Receipt (ADR) of Alibaba Group Holding Limited (NYSE: BABA). Alibaba Highlights: •Alibaba is the world’s third -largest E -Commerce retailer by revenue, generating $142 billion in total revenue in 2025, behind only Amazon’s $743 billion and JD.com’s $182 billion.1 •Alibaba has a diversified, global business that spans E -Commerce, AI & cloud computing services, logistics, payments & financial technology, media, and local services. •Alibaba has higher historical annual revenue growth rates than Amazon.2 •Alibaba’s advancements in AI, including the launch of its industry -leading Qwen 2.5 series large language model, have contributed to recent momentum. •We believe China Internet continues to be an important global growth theme, and China’s online retail sales totaled over $2.3 trillion in 2025, compared to only $1.2 trillion in the United States. 3 KBAB Features: •KBAB provides investment exposure that is 2 times the daily percentage change of Alibaba’s ADR (Ticker: BABA). •Offer investors the opportunity to make short -term, bullish calls on the stock. •Offer investors exposure to leverage without the need to borrow directly or maintain collateral and investors can lose no mor e than their initial investment. •Investors can lose no more than their initial investment. 1.Data from Bloomberg as of 12/31/2025. 2.Data from Bloomberg for the period 2014 to 2025. 3.Data from National Bureau of Statistics of China& U.S. Census Bureau, Statista as of 12/31/2025. Retrieved on 6/30/2026.Investors should be aware that they can lose their entire investment. Single -stock ETFs, unlike traditional ETFs that diversify across a range of stocks, focus solely on the performance of a single stock, significantly increasing investment risk. KraneShares 2x Levered ETFs aim for daily investment results that match 2x the daily performance of the underlying stock. Investors should be aware that returns may diverge from the stock's actual performance if held for more tha n a day. Due to their leveraged nature, these funds require close monitoring, as they can magnify both potential gains and losses. A f lat performance of the underlying stock may lead to a loss, and in certain scenarios, these funds can incur losses even when the stock price fluctuates positively or negatively ov er several days. Therefore, they are not suitable for every investor and are specifically intended for knowledgeable individuals who grasp the mechanics of leveraged investing and are willing to actively manage risks. Understanding volatility is essential, as minor stock movements and increased volatility can result in returns that significantly deviate f rom the expected target.
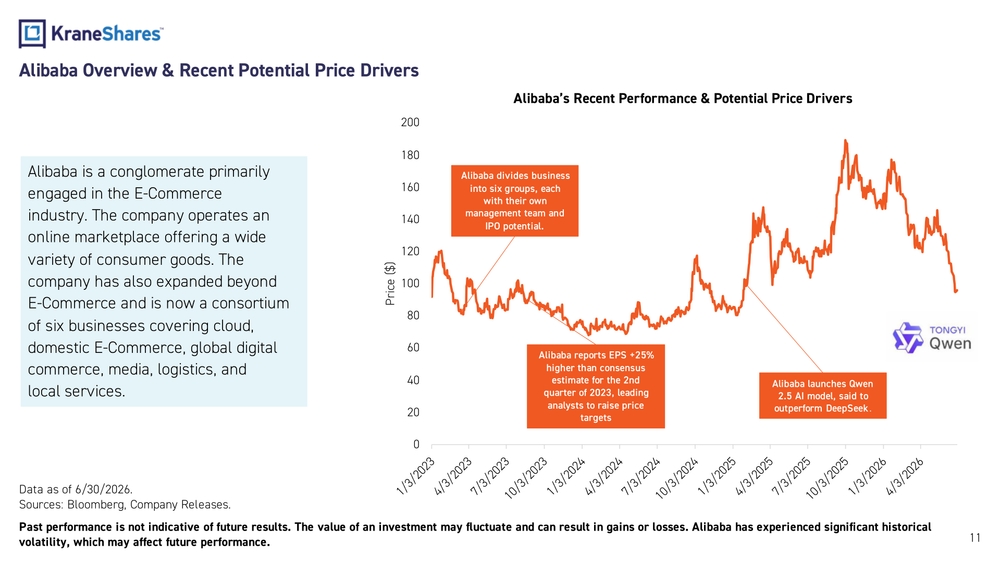
11Alibaba is a conglomerate primarily engaged in the E -Commerce industry. The company operates an online marketplace offering a wide variety of consumer goods. The company has also expanded beyond E-Commerce and is now a consortium of six businesses covering cloud, domestic E -Commerce, global digital commerce, media, logistics, and local services. Alibaba Overview & Recent Potential Price Drivers Data as of 6/30/2026. Sources: Bloomberg, Company Releases. Past performance is not indicative of future results. The value of an investment may fluctuate and can result in gains or los ses. Alibaba has experienced significant historical volatility, which may affect future performance.020406080100120140160180200Price ($)Alibaba’s Recent Performance & Potential Price Drivers Alibaba divides business into six groups, each with their own management team and IPO potential. Alibaba reports EPS +25% higher than consensus estimate for the 2nd quarter of 2023, leading analysts to raise price targetsAlibaba launches Qwen 2.5 AI model, said to outperform DeepSeek .
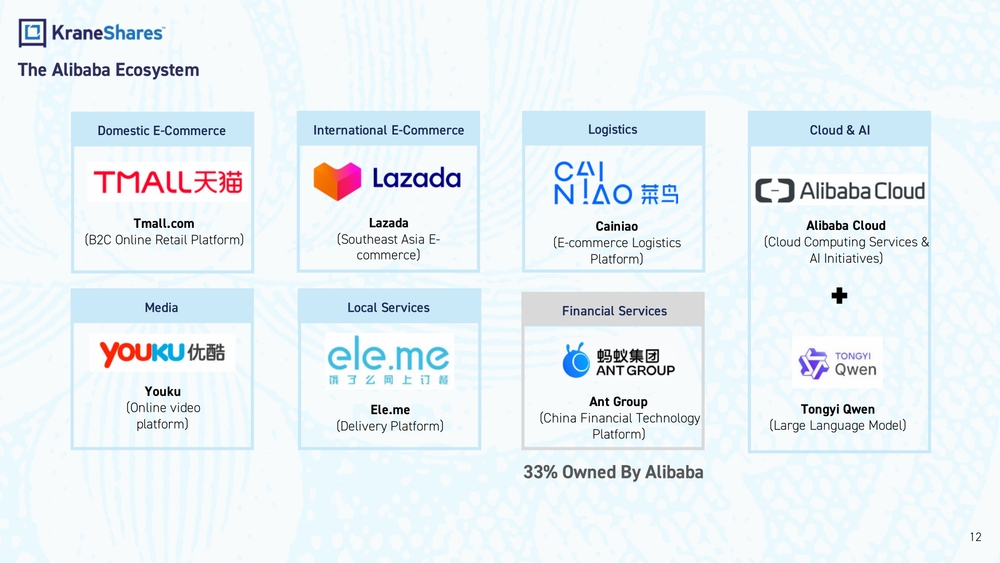
Lazada (Southeast Asia E - commerce) Tmall.com (B2C Online Retail Platform) Alibaba Cloud (Cloud Computing Services & AI Initiatives) Cainiao (E-commerce Logistics Platform)International E -Commerce 12 The Alibaba Ecosystem Local ServicesDomestic E -Commerce Cloud & AI MediaLogistics Ele.me (Delivery Platform)Youku (Online video platform)Ant Group (China Financial Technology Platform)Financial Services 33% Owned By Alibaba Tongyi Qwen (Large Language Model)
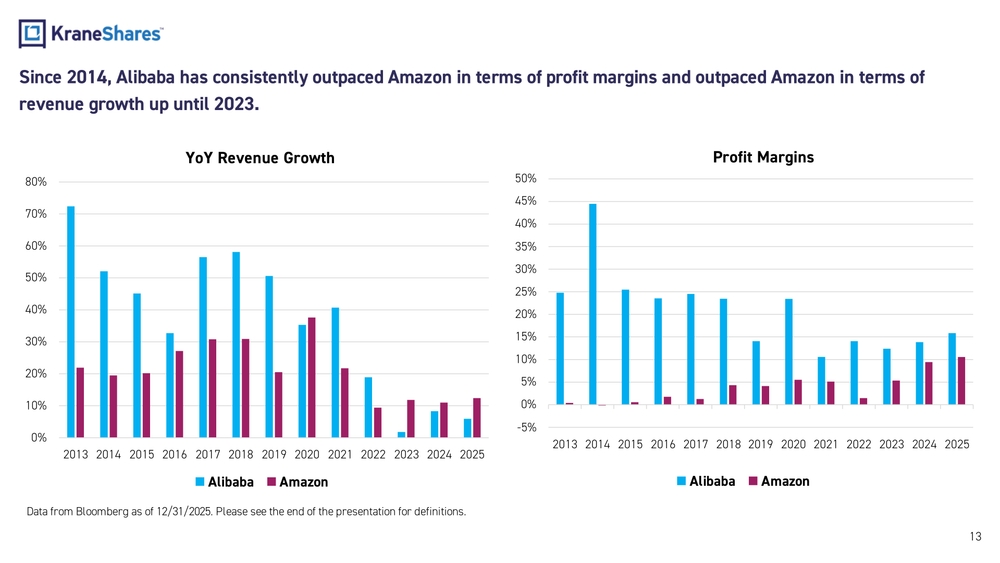
Data from Bloomberg as of 12/31/2025 . Please see the end of the presentation for definitions.Since 2014, Alibaba has consistently outpaced Amazon in terms of profit margins and outpaced Amazon in terms of revenue growth up until 2023. 130%10%20%30%40%50%60%70%80% 2013 2014 2015 2016 2017 2018 2019 2020 2021 2022 2023 2024 2025YoY Revenue Growth Alibaba Amazon-5%0%5%10%15%20%25%30%35%40%45%50% 2013 2014 2015 2016 2017 2018 2019 2020 2021 2022 2023 2024 2025Profit Margins Alibaba Amazon
14KMLI KraneShares 2X Long MELI Daily ETFInvestment Strategy: KMLI seeks daily investment results, before fees and expenses, of 2 times (200%) the daily percentage change of Mercado Libre Inc. (NYSE: BIDU). Mercado Libre Highlights: •Mercado Libre is Latin America’s most popular E -Commerce platform, beating out Amazon in the region in terms of users.1 •Mercado Libre helps power the digital transformation in 18 developing and middle -income countries through frictionless commerce and financial inclusion.2 •We believe the growth of internet adoption within emerging markets is a long -term secular theme that may continue to play out over the course of decades. KMLI Features: •KMLI provides investment exposure that is 2 times the daily percentage change of Mercado Libre Inc. (Ticker: MELI). •Offers investors the opportunity to make short -term, bullish calls on the stock. •Offers investors exposure to leverage without the need to borrow directly or maintain collateral and investors can lose no mo re than their initial investment. •Investors can lose no more than their initial investment. Investors should be aware that they can lose their entire investment. Single -stock ETFs, unlike traditional ETFs that diversify across a range of stocks, focus solely on the performance of a single stock, significantly increasing investment risk. KraneShares 2x Levered ETFs aim for daily investment results that match 2x the daily performance of the underlying stock. Investors should be aware that returns may diverge from the stock's actual performance if held for more tha n a day. Due to their leveraged nature, these funds require close monitoring, as they can magnify both potential gains and losses. A f lat performance of the underlying stock may lead to a loss, and in certain scenarios, these funds can incur losses even when the stock price fluctuates positively or negatively ov er several days. Therefore, they are not suitable for every investor and are specifically intended for knowledgeable individuals who grasp the mechanics of leveraged investing and are willing to actively manage risks. Understanding volatility is essential, as minor stock movements and increased volatility can result in returns that significantly deviate f rom the expected target. 1.Westberg Peter. “Mercado Libre: The Digital Backbone of Latin America,” Quartr. January 3, 2025. Retrieved on 6/30/2026. 2.Company Reports as of 12/31/2025.
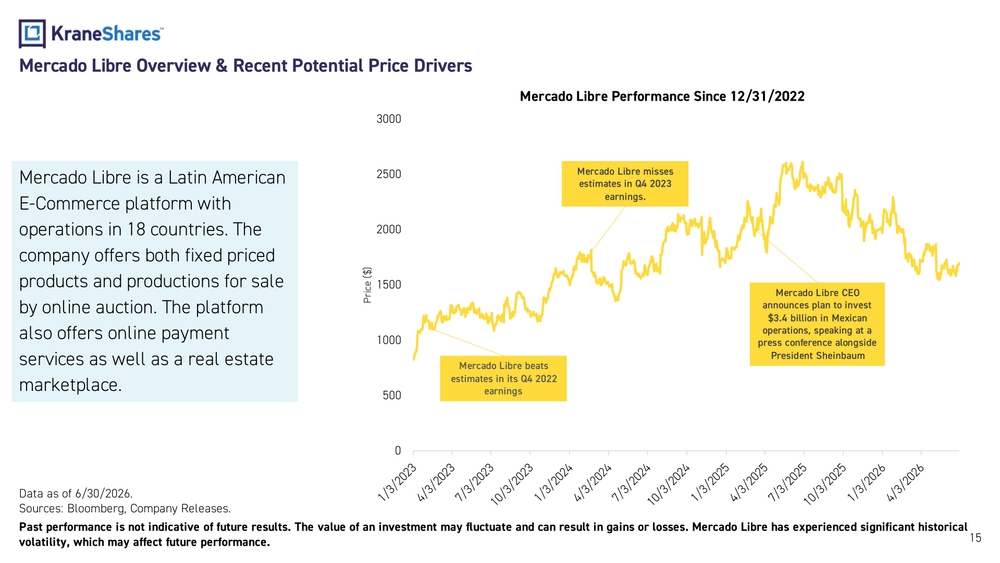
15Mercado Libre is a Latin American E-Commerce platform with operations in 18 countries. The company offers both fixed priced products and productions for sale by online auction. The platform also offers online payment services as well as a real estate marketplace.Mercado Libre Overview & Recent Potential Price Drivers Data as of 6/30/2026. Sources: Bloomberg, Company Releases. Past performance is not indicative of future results. The value of an investment may fluctuate and can result in gains or los ses. Mercado Libre has experienced significant historical volatility, which may affect future performance.050010001500200025003000Price ($)Mercado Libre Performance Since 12/31/2022 Mercado Libre beats estimates in its Q4 2022 earningsMercado Libre misses estimates in Q4 2023 earnings. Mercado Libre CEO announces plan to invest $3.4 billion in Mexican operations, speaking at a press conference alongside President Sheinbaum
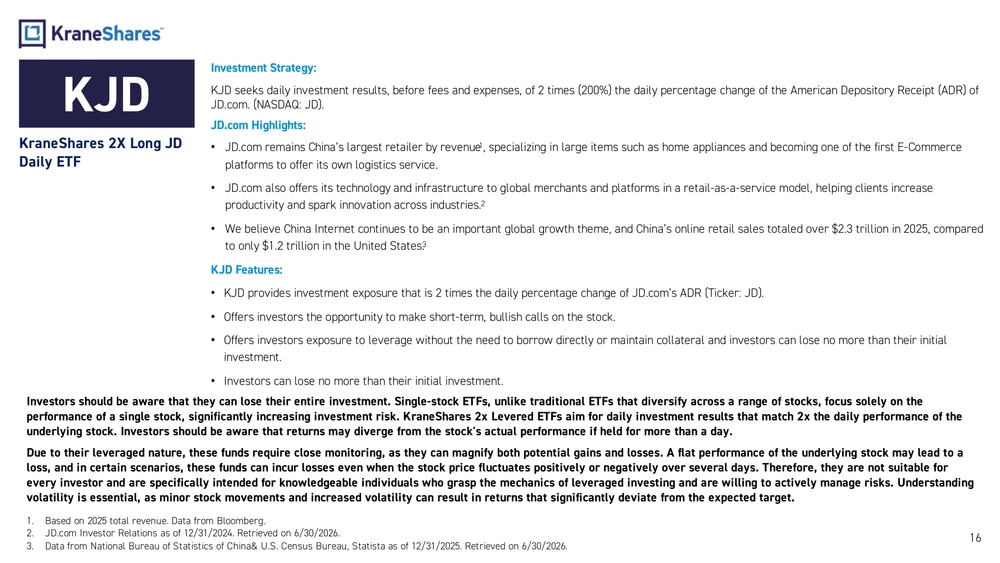
16KJD KraneShares 2X Long JD Daily ETFInvestment Strategy: KJD seeks daily investment results, before fees and expenses, of 2 times (200%) the daily percentage change of the American D epository Receipt (ADR) of JD.com. (NASDAQ: JD). JD.com Highlights: •JD.com remains China’s largest retailer by revenue1, specializing in large items such as home appliances and becoming one of the first E -Commerce platforms to offer its own logistics service. •JD.com also offers its technology and infrastructure to global merchants and platforms in a retail -as-a-service model, helping c lients increase productivity and spark innovation across industries.2 •We believe China Internet continues to be an important global growth theme, and China’s online retail sales totaled over $2.3 trillion in 2025, compared to only $1.2 trillion in the United States. 3 KJD Features: •KJD provides investment exposure that is 2 times the daily percentage change of JD.com’s ADR (Ticker: JD). •Offers investors the opportunity to make short -term, bullish calls on the stock. •Offers investors exposure to leverage without the need to borrow directly or maintain collateral and investors can lose no mo re than their initial investment. •Investors can lose no more than their initial investment. 1.Based on 2025 total revenue. Data from Bloomberg. 2.JD.com Investor Relations as of 12/31/2024. Retrieved on 6/30/2026. 3.Data from National Bureau of Statistics of China& U.S. Census Bureau, Statista as of 12/31/2025. Retrieved on 6/30/2026.Investors should be aware that they can lose their entire investment. Single -stock ETFs, unlike traditional ETFs that diversify across a range of stocks, focus solely on the performance of a single stock, significantly increasing investment risk. KraneShares 2x Levered ETFs aim for daily investment results that match 2x the daily performance of the underlying stock. Investors should be aware that returns may diverge from the stock's actual performance if held for more tha n a day. Due to their leveraged nature, these funds require close monitoring, as they can magnify both potential gains and losses. A f lat performance of the underlying stock may lead to a loss, and in certain scenarios, these funds can incur losses even when the stock price fluctuates positively or negatively ov er several days. Therefore, they are not suitable for every investor and are specifically intended for knowledgeable individuals who grasp the mechanics of leveraged investing and are willing to actively manage risks. Understanding volatility is essential, as minor stock movements and increased volatility can result in returns that significantly deviate f rom the expected target.
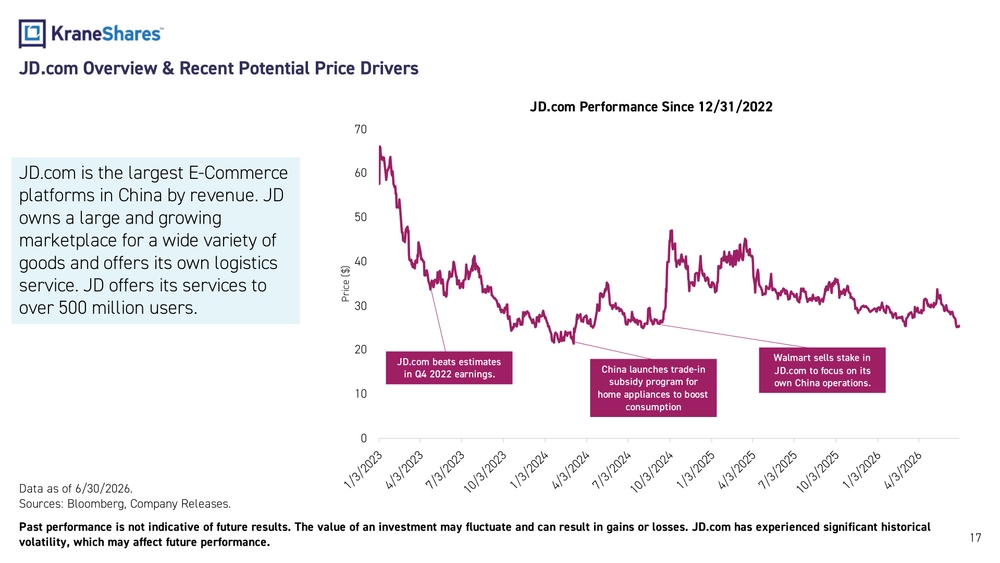
17JD.com is the largest E -Commerce platforms in China by revenue. JD owns a large and growing marketplace for a wide variety of goods and offers its own logistics service. JD offers its services to over 500 million users.JD.com Overview & Recent Potential Price Drivers Data as of 6/30/2026. Sources: Bloomberg, Company Releases. Past performance is not indicative of future results. The value of an investment may fluctuate and can result in gains or los ses. JD.com has experienced significant historical volatility, which may affect future performance.010203040506070Price ($)JD.com Performance Since 12/31/2022 Walmart sells stake in JD.com to focus on its own China operations.China launches trade -in subsidy program for home appliances to boost consumptionJD.com beats estimates in Q4 2022 earnings.
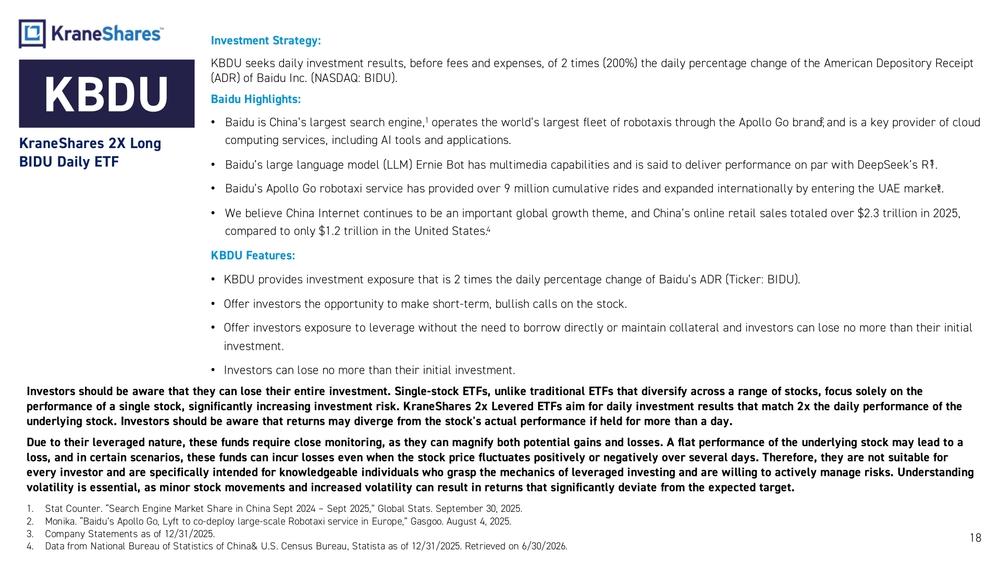
18KBDU KraneShares 2X Long BIDU Daily ETFInvestment Strategy: KBDU seeks daily investment results, before fees and expenses, of 2 times (200%) the daily percentage change of the American Depository Receipt (ADR) of Baidu Inc. (NASDAQ: BIDU). Baidu Highlights: •Baidu is China’s largest search engine,1 operates the world’s largest fleet of robotaxis through the Apollo Go brand,2 and is a key provider of cloud computing services, including AI tools and applications. •Baidu ’s large language model (LLM) Ernie Bot has multimedia capabilities and is said to deliver performance on par with DeepSeek’s R1.3 •Baidu’s Apollo Go robotaxi service has provided over 9 million cumulative rides and expanded internationally by entering the UAE market.3 •We believe China Internet continues to be an important global growth theme, and China’s online retail sales totaled over $2.3 trillion in 2025, compared to only $1.2 trillion in the United States. 4 KBDU Features: •KBDU provides investment exposure that is 2 times the daily percentage change of Baidu’s ADR (Ticker: BIDU). •Offer investors the opportunity to make short -term, bullish calls on the stock. •Offer investors exposure to leverage without the need to borrow directly or maintain collateral and investors can lose no mor e than their initial investment. •Investors can lose no more than their initial investment. 1.Stat Counter. “Search Engine Market Share in China Sept 2024 – Sept 2025,” Global Stats. September 30, 2025. 2.Monika. “Baidu’s Apollo Go, Lyft to co -deploy large -scale Robotaxi service in Europe,” Gasgoo . August 4, 2025. 3.Company Statements as of 12/31/2025. 4.Data from National Bureau of Statistics of China& U.S. Census Bureau, Statista as of 12/31/2025. Retrieved on 6/30/2026.Investors should be aware that they can lose their entire investment. Single -stock ETFs, unlike traditional ETFs that diversify across a range of stocks, focus solely on the performance of a single stock, significantly increasing investment risk. KraneShares 2x Levered ETFs aim for daily investment results that match 2x the daily performance of the underlying stock. Investors should be aware that returns may diverge from the stock's actual performance if held for more tha n a day. Due to their leveraged nature, these funds require close monitoring, as they can magnify both potential gains and losses. A f lat performance of the underlying stock may lead to a loss, and in certain scenarios, these funds can incur losses even when the stock price fluctuates positively or negatively ov er several days. Therefore, they are not suitable for every investor and are specifically intended for knowledgeable individuals who grasp the mechanics of leveraged investing and are willing to actively manage risks. Understanding volatility is essential, as minor stock movements and increased volatility can result in returns that significantly deviate f rom the expected target.
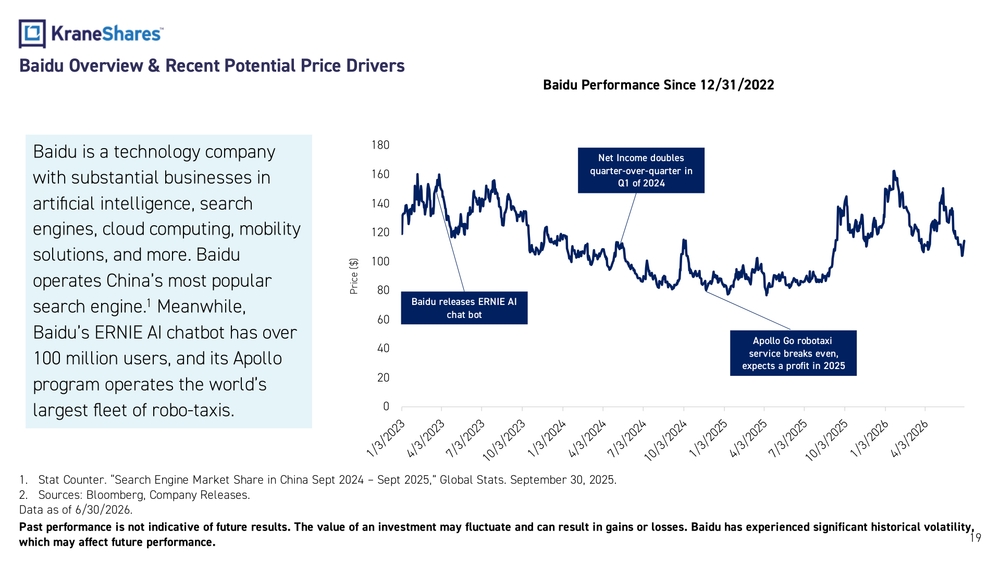
19Baidu is a technology company with substantial businesses in artificial intelligence, search engines, cloud computing, mobility solutions, and more. Baidu operates China’s most popular search engine.1 Meanwhile, Baidu’s ERNIE AI chatbot has over 100 million users, and its Apollo program operates the world’s largest fleet of robo -taxis.Baidu Overview & Recent Potential Price Drivers 1.Stat Counter. “Search Engine Market Share in China Sept 2024 – Sept 2025,” Global Stats. September 30, 2025. 2.Sources: Bloomberg, Company Releases. Data as of 6/30/2026. Past performance is not indicative of future results. The value of an investment may fluctuate and can result in gains or los ses. Baidu has experienced significant historical volatility, which may affect future performance.020406080100120140160180Price ($)Baidu Performance Since 12/31/2022 Apollo Go robotaxi service breaks even, expects a profit in 2025Net Income doubles quarter -over -quarter in Q1 of 2024 Baidu releases ERNIE AI chat bot
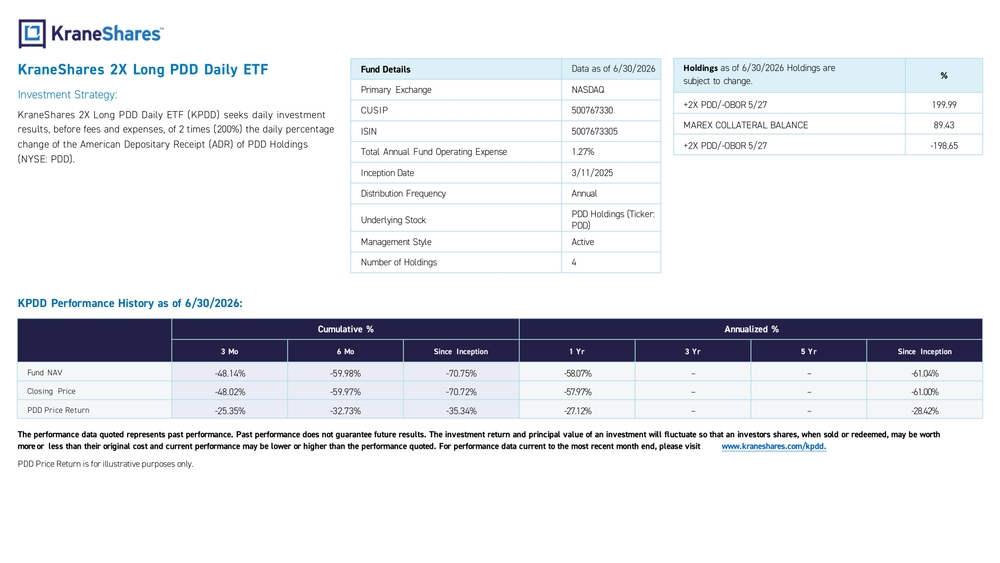
KraneShares 2XLong PDD Daily ETF Investment Strategy: KraneShares 2XLong PDD Daily ETF (KPDD) seeks daily investment results, before fees andexpenses, of2times (200%) thedaily percentage change oftheAmerican Depositary Receipt (ADR) ofPDD Holdings (NYSE: PDD).Fund Details Data as of 6/30/2026 Primary Exchange NASDAQ CUSIP 500767330 ISIN 5007673305 Total Annual Fund Operating Expense 1.27% Inception Date 3/11/2025 Distribution Frequency Annual Underlying StockPDD Holdings (Ticker: PDD) Management Style Active Number ofHoldings 4 KPDD Performance History asof6/30/202 6: Cumulative % Annualized % 3Mo 6Mo Since Inception 1Yr 3Yr 5Yr Since Inception Fund NAV -48.14% -59.98% -70.75% -58.07% – – -61.04% Closing Price -48.02% -59.97% -70.72% -57.97% – – -61.00% PDD Price Return -25.35% -32.73% -35.34% -27.12% – – -28.42% Theperformance data quoted represents past performance. Past performance does notguarantee future results. Theinvestment return andprincipal value ofaninvestment will fluctuate sothat aninvestors shares, when sold orredeemed, may beworth more orless than their original cost andcurrent performance may belower orhigher than theperformance quoted. Forperformance data current tothemost recent month end, please visit www.kraneshares.com/kpdd. PDD Price Return is for illustrative purposes only.Holdings asof6/30/202 6Holdings are subject tochange.% +2X PDD/ -OBOR 5/27 199.99 MAREX COLLATERAL BALANCE 89.43 +2X PDD/ -OBOR 5/27 -198.65
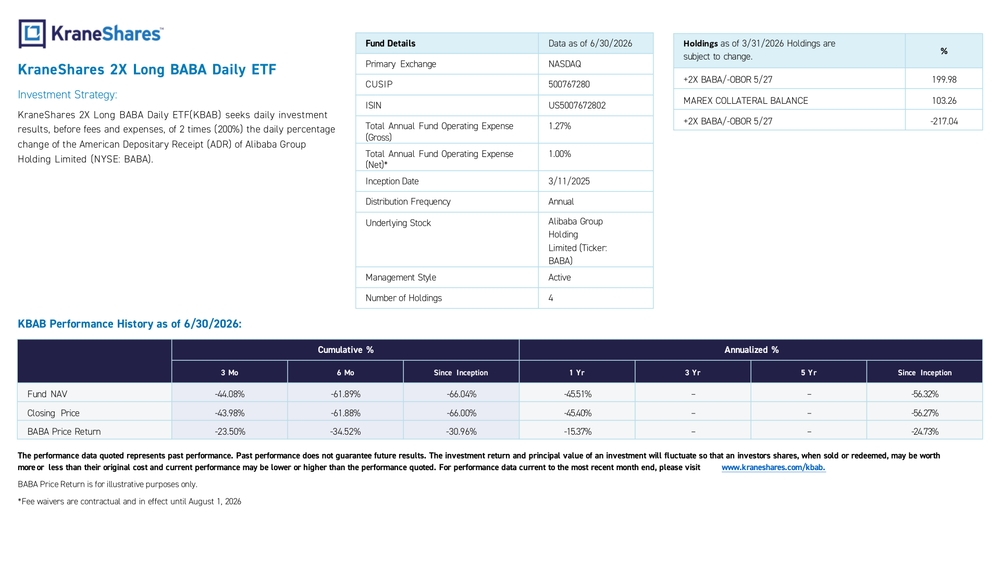
KraneShares 2XLong BABA Daily ETF Investment Strategy: KraneShares 2XLong BABA Daily ETF(KBAB )seeks daily investment results, before fees andexpenses, of2times (200%) thedaily percentage change of the American Depositary Receipt (ADR) of Alibaba Group Holding Limited (NYSE: BABA).Fund Details Data as of 6/30/2026 Primary Exchange NASDAQ CUSIP 500767280 ISIN US5007672802 Total Annual Fund Operating Expense (Gross)1.27% Total Annual Fund Operating Expense (Net)*1.00% Inception Date 3/11/2025 Distribution Frequency Annual Underlying Stock Alibaba Group Holding Limited (Ticker: BABA) Management Style Active Number ofHoldings 4Holdings asof3/31/202 6Holdings are subject tochange.% +2X BABA/ -OBOR 5/27 199.98 MAREX COLLATERAL BALANCE 103.26 +2X BABA/ -OBOR 5/27 -217.04 KBAB Performance History asof6/30/202 6: Cumulative % Annualized % 3Mo 6Mo Since Inception 1Yr 3Yr 5Yr Since Inception Fund NAV -44.08 % -61.89 % -66.04 % -45.51% – – -56.32% Closing Price -43.98 % -61.88 % -66.00 % -45.40% – – -56.27% BABA Price Return -23.50% -34.52% -30.96% -15.37% – – -24.73% Theperformance data quoted represents past performance. Past performance does notguarantee future results. Theinvestment return andprincipal value ofaninvestment will fluctuate sothat aninvestors shares, when sold orredeemed, may beworth more orless than their original cost andcurrent performance may belower orhigher than theperformance quoted. Forperformance data current tothemost recent month end, please visit www.kraneshares.com/kbab. BABA Price Return is for illustrative purposes only. *Fee waivers arecontractual andineffect until August 1,2026
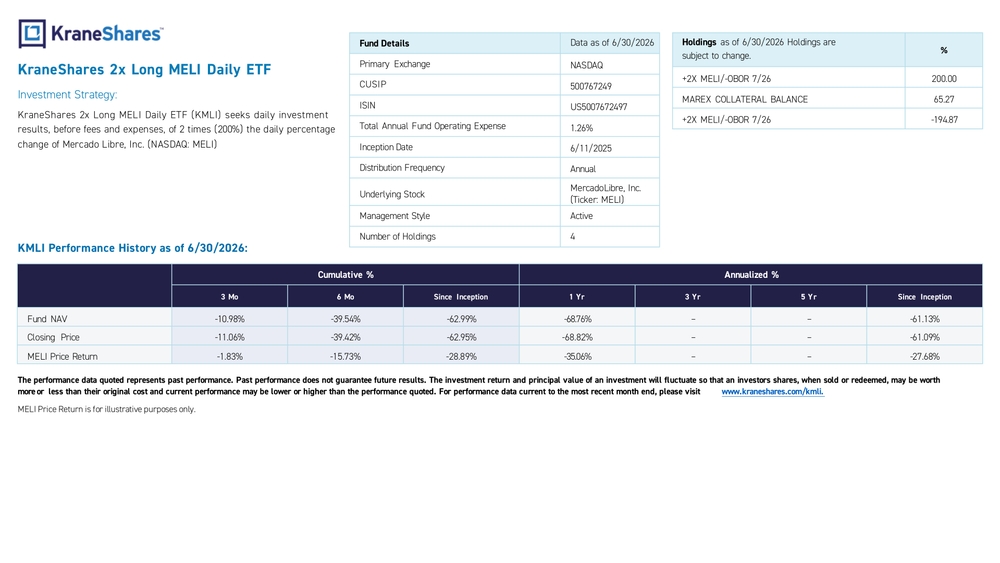
KraneShares 2xLong MELI Daily ETF Investment Strategy: KraneShares 2xLong MELI Daily ETF (KMLI) seeks daily investment results, before fees andexpenses, of2times (200%) thedaily percentage change ofMercado Libre, Inc.(NASDAQ: MELI) KMLI Performance History asof6/30/2026 : Theperformance data quoted represents past performance. Past performance does notguarantee future results. Theinvestment return andprincipal value ofaninvestment will fluctuate sothat aninvestors shares, when sold orredeemed, may beworth more orless than their original cost andcurrent performance may belower orhigher than theperformance quoted. Forperformance data current tothemost recent month end, please visit www.kraneshares.com/kmli. MELI Price Return is for illustrative purposes only.Holdings asof6/30/202 6Holdings are subject tochange.% +2XMELI/ -OBOR 7/26 200.0 0 MAREX COLLATERAL BALANCE 65.27 +2XMELI/ -OBOR 7/26 -194.87 Cumulative % Annualized % 3Mo 6Mo Since Inception 1Yr 3Yr 5Yr Since Inception Fund NAV -10.98 % -39.54 % -62.99 % -68.76% – – -61.13 % Closing Price -11.06 % -39.42 % -62.95 % -68.82% – – -61.09 % MELI Price Return -1.83% -15.73% -28.89% -35.06% – – -27.68%Fund Details Data as of 6/30/2026 Primary Exchange NASDAQ CUSIP 500767249 ISIN US5007672497 Total Annual Fund Operating Expense 1.26% Inception Date 6/11/2025 Distribution Frequency Annual Underlying StockMercadoLibre , Inc. (Ticker: MELI) Management Style Active Number ofHoldings 4
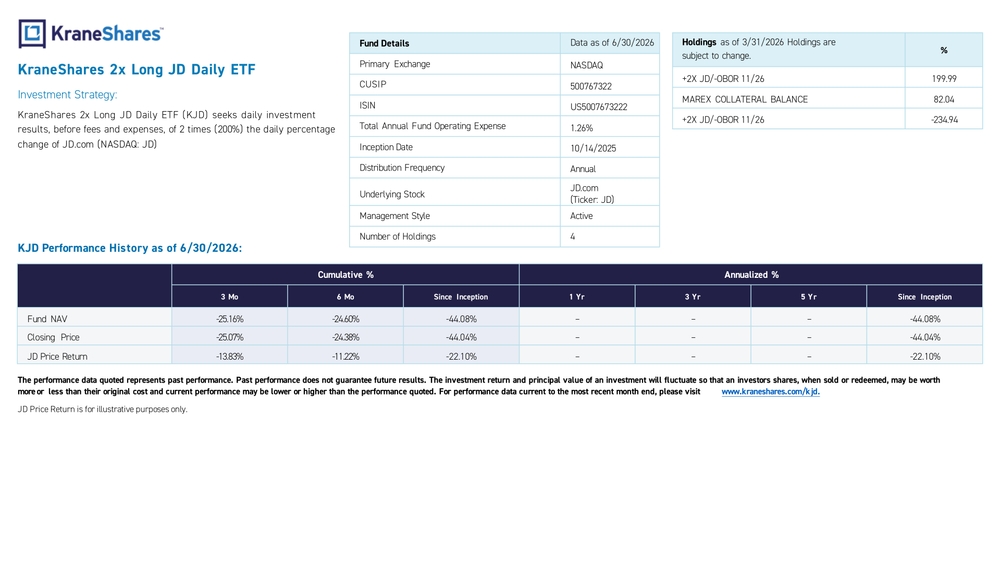
KraneShares 2xLong JDDaily ETF Investment Strategy: KraneShares 2xLong JD Daily ETF (KJD )seeks daily investment results, before fees andexpenses, of2times (200%) thedaily percentage change ofJD.com (NASDAQ: JD) KJD Performance History asof6/30/2026 : Theperformance data quoted represents past performance. Past performance does notguarantee future results. Theinvestment return andprincipal value ofaninvestment will fluctuate sothat aninvestors shares, when sold orredeemed, may beworth more orless than their original cost andcurrent performance may belower orhigher than theperformance quoted. Forperformance data current tothemost recent month end, please visit www.kraneshares.com/k jd. JD Price Return is for illustrative purposes only.Cumulative % Annualized % 3Mo 6Mo Since Inception 1Yr 3Yr 5Yr Since Inception Fund NAV -25.16% -24.60% -44.08% – – – -44.08% Closing Price -25.07% -24.38% -44.04% – – – -44.04% JD Price Return -13.83% -11.22% -22.10% – – – -22.10%Fund Details Data as of 6/30/2026 Primary Exchange NASDAQ CUSIP 500767 322 ISIN US500767 3222 Total Annual Fund Operating Expense 1.26% Inception Date 10/14/2025 Distribution Frequency Annual Underlying StockJD.com (Ticker: JD) Management Style Active Number ofHoldings 4Holdings asof3/31/202 6Holdings are subject tochange.% +2X JD/ -OBOR 11/26 199.99 MAREX COLLATERAL BALANCE 82.04 +2X JD/ -OBOR 11/26 -234.94
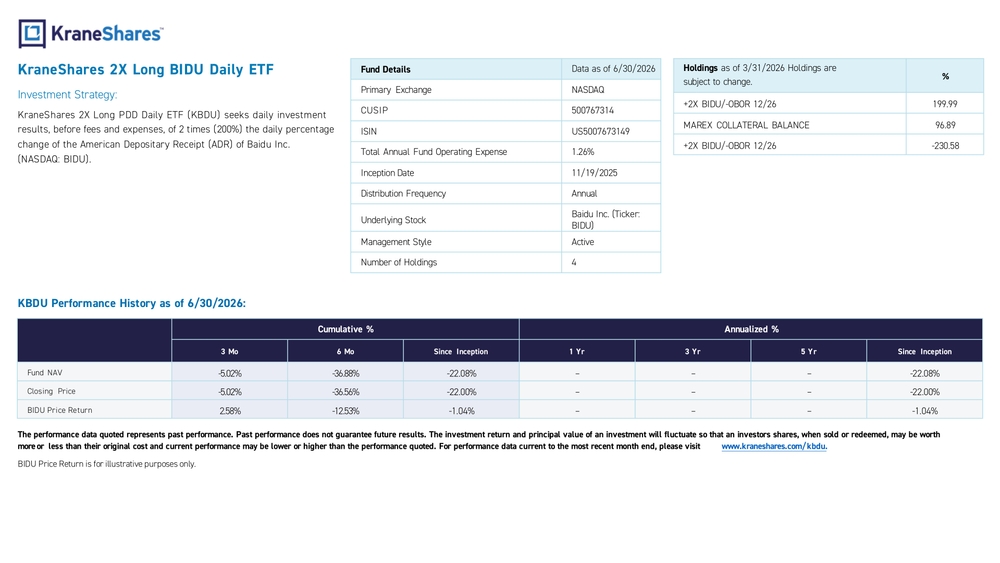
KraneShares 2XLong BIDU Daily ETF Investment Strategy: KraneShares 2XLong PDD Daily ETF (KBDU) seeks daily investment results, before fees andexpenses, of2times (200%) thedaily percentage change oftheAmerican Depositary Receipt (ADR) ofBaidu Inc. (NASDAQ :BIDU ).Holdings as of 3/31/2026 Holdings are subject to change.% +2XBIDU/ -OBOR 12/26 199.99 MAREX COLLATERAL BALANCE 96.89 +2XBIDU/ -OBOR 12/26 -230.58 KBDU Performance History asof6/30/202 6: Cumulative % Annualized % 3Mo 6Mo Since Inception 1Yr 3Yr 5Yr Since Inception Fund NAV -5.02% -36.88% -22.08 % – – – -22.08 % Closing Price -5.02% -36.56% -22.00 % – – – -22.00 % BIDU Price Return 2.58% -12.53% -1.04% – – – -1.04% Theperformance data quoted represents past performance. Past performance does notguarantee future results. Theinvestment return andprincipal value ofaninvestment will fluctuate sothat aninvestors shares, when sold orredeemed, may beworth more orless than their original cost andcurrent performance may belower orhigher than theperformance quoted. Forperformance data current tothemost recent month end, please visit www.kraneshares.com/ kbdu . BIDU Price Return is for illustrative purposes only.Fund Details Data as of 6/30/2026 Primary Exchange NASDAQ CUSIP 500767314 ISIN US5007673149 Total Annual Fund Operating Expense 1.26% Inception Date 11/19/2025 Distribution Frequency Annual Underlying StockBaidu Inc. (Ticker: BIDU) Management Style Active Number ofHoldings 4
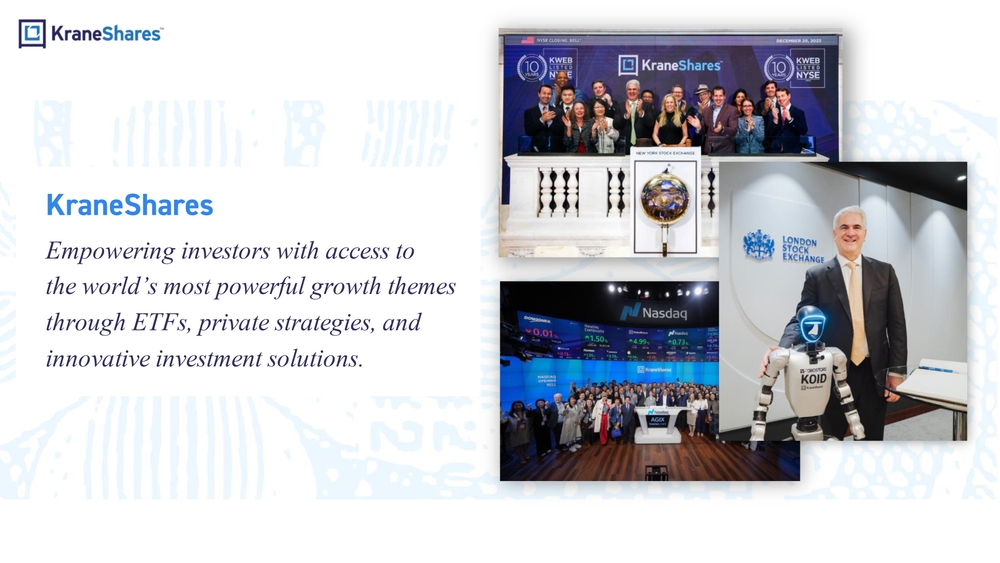
KraneShares Empowering investors with access to the world’ s most powerful growth themes through ETFs, private strategies, and innovative investment solutions.
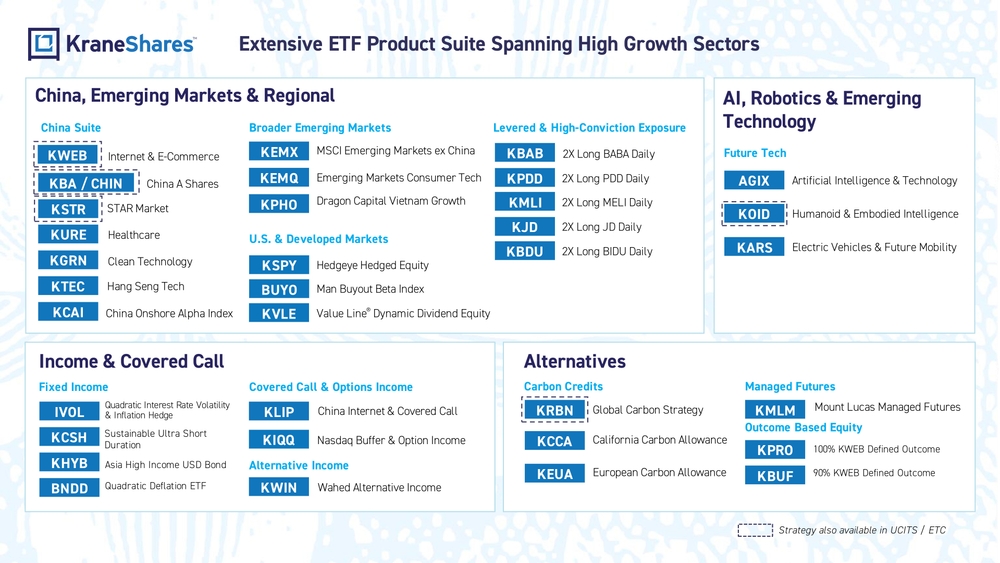
China, Emerging Markets & Regional Alternatives Income & Covered Call AI, Robotics & Emerging Technology KURE Healthcare KGRN Clean TechnologyKSTR STAR Market KTEC Hang Seng TechKWEB Internet & E -Commerce China A Shares KBA / CHIN KCAI China Onshore Alpha IndexAGIX Artificial Intelligence & Technology KOID Humanoid & Embodied Intelligence Electric Vehicles & Future Mobility KARSChina Suite Future TechBroader Emerging Markets KEMQ Emerging Markets Consumer Tech KPHODragon Capital Vietnam GrowthKEMX MSCI Emerging Markets ex China U.S. & Developed Markets KVLE Value Line® Dynamic Dividend EquityHedgeye Hedged Equity KSPY Man Buyout Beta Index BUYO Fixed Income BNDDQuadratic Deflation ETFIVOLQuadratic Interest Rate Volatility & Inflation Hedge KHYB Asia High Income USD BondSustainable Ultra Short DurationKCSH KEUA European Carbon AllowanceGlobal Carbon Strategy KRBNCarbon CreditsKPDD 2X Long PDD Daily KJD 2X Long JD DailyKBAB 2X Long BABA Daily KMLI 2X Long MELI Daily Covered Call & Options Income Managed Futures KMLMMount Lucas Managed Futures KWIN Wahed Alternative IncomeKLIP China Internet & Covered Call Outcome Based Equity KIQQ Nasdaq Buffer & Option IncomeLevered & High -Conviction Exposure KBUF90% KWEB Defined Outcome100% KWEB Defined Outcome KPRO Alternative Income KCCA California Carbon AllowanceExtensive ETF Product Suite Spanning High Growth Sectors Strategy also available in UCITS / ETCKBDU 2X Long BIDU Daily
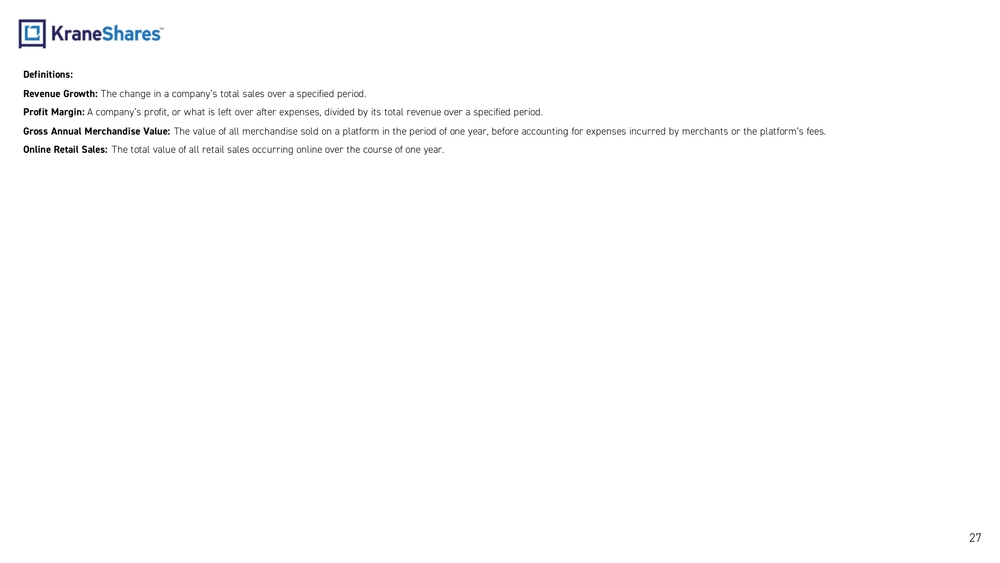
27Definitions: Revenue Growth: The change in a company’s total sales over a specified period. Profit Margin: A company’s profit, or what is left over after expenses, divided by its total revenue over a specified period. Gross Annual Merchandise Value: The value of all merchandise sold on a platform in the period of one year, before accounting for expenses incurred by merchan ts or the platform’s fees. Online Retail Sales: The total value of all retail sales occurring online over the course of one year.
Important Notes: Carefully consider the Funds’ investment objectives, risk factors, charges and expenses before investing. This and additional information can be found in the Funds’ full and summary prospectus, which may be obtained by visiting: www.kraneshares.com/kpdd , www.kraneshares.com/kbab , www.kraneshares.com/kmli , www.kraneshares.com/kjd , or www.kraneshares.com/kbdu . Read the prospectus carefully before investing. Risk Disclosures: Investing involves risk, including possible loss ofprincipal. There canbenoassurance that aFund willachieve itsstated objectives. Indices areunmanaged anddonotinclude theeffect offees. One cannot invest directly inanindex. This information should notberelied upon asresearch, investment advice, orarecommendation regarding anyproducts, strategies, oranysecurity inparticular. This material isstrictly forillustrative, educational, or informational purposes andis subject tochange. Certain content represents anassessment ofthemarket environment ataspecific time andisnotintended tobeaforecast offuture events oraguarantee offuture results; material isasofthedates noted andissubject tochange without notice. TheFund may invest inderivatives, which areoften more volatile than other investments andmay magnify theFund’s gains orlosses. Aderivative (i.e., futures/forward contracts, swaps, andoptions) isacontract that derives itsvalue from the performance ofanunderlying asset. Theprimary riskofderivatives isthat changes intheasset’s market value andthederivative may notbeproportionate, andsome derivatives canhave the potential forunlimited losses. Derivatives arealso subject toliquidity andcounterparty risk. TheFund issubject toliquidity risk, meaning that certain investments may become difficult topurchase orsellatareasonable time andprice. Ifatransaction forthese securities islarge, itmay notbepossible to initiate, which may cause theFund tosuffer losses. Counterparty riskistheriskofloss intheevent that thecounterparty toan agreement fails tomake required payments orotherwise comply with theterms ofthederivative. The Underlying Stocks are exposed to numerous risks that can impact their revenues and viability, such as price volatility, m anagement, inflation, global economic conditions, and natural disasters. Their performances may be influenced by trends in commerce, cloud computing, international trade policies, and regulatory changes. The Fund’s daily returns rely on the Underlying Stocks' performances and volatility. Issuer -specific factors may increase Fund investment volatility compared to the overall market. BABA faces risks from competitio n in e -commerce, economic uncertainties, demand declines, revenue concentration, geopolitical events, intellectual property issues, exchange rates, reliance on third -party manufacturing, shortages, cybersecuri ty threats, system failures, rising costs, government regulations, compliance expenses, litigation, taxes, debt, and talent retention. The Funds aim for daily investment results of 200% of the daily percentage changes of the Underlying Stocks. Their performanc es over longer periods will likely differ from the Underlying Stocks due to compounded returns, which significantly affect leveraged funds. If the Underlying Stocks perform poorly, the dollar losses for sharehold ers will be smaller if their investments have already decreased. Conversely, if the stocks perform well, future losses will be larger as the investment values have increased. Compounding effects become more pronounced with h igher volatility and longer holding periods, impacting shareholders differently based on their investment durations and the stocks' volatility. Various factors can impact the Funds' correlations with Underlying Stocks, and achieving high correlations is not guaranteed. If the Funds fail to achieve correlation, they may not meet their investment objectives, with NAV changes varying significantly from 200% of the Underlying Stocks' changes. To maintain correlations, the Funds attempt daily rebalancing for consistent exposures. Major deviations can increase leverage risks. Market disruptions and volatility can hinder the Funds' ability to adjust. Target exposures fluctuate, making perfect 200% exposures unlikely, especially on volatile days. Other elements, like fees and market conditions, can also affect correlations. The Funds may change positions for tax efficiency, which could harm correlations. Large asset movements or trading discrepancies may lead to under - or overexposures, reducing the Funds' ability to meet their daily objectives. (Continued on the next page)
29Risk Disclosures (continued):
The Funds use leverage to gain investment exposure beyond their net assets, leading to potential greater losses in adverse co nditions than non -leveraged funds. A decline in the Underlying Stocks' daily performance can
magnify losses, decreasing the Funds' values by 2% for each 1% drop, excluding costs. Losses could exceed net assets if the U nderlying Stocks fall over 50%. Due to limited investments, the Funds may need to limit or
suspend the creation or redemption of Creation Units. During these times, shares might trade at significant premiums or disco unts to their net asset values. If creations are halted, large redemptions could force the Funds
to sell securities at unfavorable prices, increasing costs and taxable distributions to shareholders.
The Underlying Stock is listed on an exchange, but an active trading market isn't guaranteed, and trading can be halted. A ha lt in the Underlying Stock usually leads to a halt in the Fund's shares. Trading may stop due to
market conditions or exchange decisions, and halts can occur from extraordinary volatility under circuit breaker rules. Exten ded trading halts may hinder the Fund's ability to arrange necessary swaps for its investment
strategy.
Narrowly focused investments typically exhibit higher volatility. The Funds' assets are expected to be concentrated in a sing le stock. The securities or futures in that concentration could react similarly to market
developments. Thus, the Funds are subject to loss due to adverse occurrences that affect that concentration. In addition to t he normal risks associated with investing, investments in smaller companies typically exhibit
higher volatility. KPDD, KBAB, KMLI, KJD, and KBDU are non -diversified.
The economies of certain Latin American countries have experienced high interest rates, economic volatility, inflation and hi gh unemployment rates. Adverse economic events in one country may have a significant adverse
effect on other Latin American countries. Latin American economies are emerging markets, vulnerable to domestic and regional economic and political changes, often showing more volatility than developed markets.
The Chinese economy is an emerging market, vulnerable to domestic and regional economic and political changes, often showing more volatility than developed markets. Companies face risks from potential government
interventions, and the export -driven economy is sensitive to downturns in key trading partners, impacting the Fund. U.S. -China t ensions raise concerns over tariffs and trade restrictions, which could harm China’s exports
and the Fund. China’s regulatory standards are less stringent than in the U.S., resulting in limited information about issuer s. Tax laws are unclear and subject to change, potentially impacting the Fund and leading to
unexpected liabilities for foreign investors. Fluctuations in currency of foreign countries may have an adverse effect to dom estic currency values. The Fund is new and does not yet have a significant number of shares
outstanding. If the Fund does not grow in size, it will be at greater risk than larger funds of wider bid -ask spreads for its sh ares, trading at a greater premium or discount to NAV, liquidation and/or a trading halt.
ETF shares are bought and sold on an exchange at market price (not NAV) and are not individually redeemed from the Fund. However, shares may be redeemed at NAV directly by certain authorized broker -dealers
(Authorized Participants) in very large creation/redemption units. The returns shown do not represent the returns you would receive if you traded shares at other times. Shares may trade at a premium or discount to
their NAV in the secondary market. Brokerage commissions will reduce returns. Beginning 12/23/2020, market price returns are based on the official closing price of an ETF share or, if the official closing price isn't
available, the midpoint between the national best bid and national best offer ("NBBO") as of the time the ETF calculates the current NAV per share. Prior to that date, market price returns were based on the midpoint
between the Bid and Ask price. NAVs are calculated using prices as of 4:00 PM Eastern Time.
The KraneShares ETFs and KFA Funds ETFs are distributed by SEI Investments Distribution Company (SIDCO), 1 Freedom Valley Drive, Oaks, PA 19456, which is not affiliated with Krane Funds Advisors, LLC,
the Investment Adviser for the Funds, or any sub-advisers for the Funds.