2026_06_03_trade_report
by Kraneshares
1 Strategic Wealth Model Portfolios A KraneShares Solution Built With iShares® and KraneShares ETFs info@kraneshares.com June 03, 2026 For financial professional use only, not for use with retail investors. Model Update

2 For illustrative purposes only. Strategy characteristics are subject to change. Actual allocations may be significantly different than those shown here. Please see the end of the presentation for definitions.KraneShares Strategic Wealth Model Portfolios Investment Strategy: The Strategic Wealth Model Portfolio Suite is designed to act as a comprehensive, global portfolio that leverages KraneShares’ forward - thinking perspective and BlackRock® insights. The model portfolios currently include allocations to ETFs from both KraneShares and iShares®. The model investment process includes: •Enhanced Strategic Allocation (meaningful exposure to alternatives, global orientation - consideration of a country’s economic strength in addition to market cap) using ETFs. •Risk Management by Krane’s experienced portfolio management team, complemented by Aladdin technology from BlackRock®. •Disciplined Rebalancing with the ability to adjust more frequently according to market conditions.
3 Forward -Looking Global Investing We see the world through an economic growth lens and seek to capture value in economies that are on the rise rather than those with already -high market capitalizations.Impactful Alternatives Exposure We believe portfolios can significantly benefit from meaningful exposure to strategies with low correlations to traditional stocks and bonds.Fixed Income Shouldn’t be “Fixed” * Fixed income should be regularly assessed for interest rate, credit, and currency risk. *Source: BlackRock. For illustrative purposes only. Investment process is subject to change. Our Framework: Guiding Principles
4 Risk Profile MenuKraneShares Strategic Wealth Model Portfolios Using an asset allocation strategy does not guarantee a profit or protection against a loss, and diversification does not eli minate the risk of investment losses. Growth Balanced Conservative Cautious
5 Trade Rationale: for Trading on June 03, 2026 Portfolio positioning: We are modestly reducing equity exposure across portfolios following a period of strong equity market performance, while incrementally increasing allocations to fixed income and alternatives. The adjustment reflects a measured reduction in portfo lio risk as equity markets remain near all -time highs, while maintaining the overall portfolio structure and key strategic exposures. Equity positioning: Equity exposure is reduced modestly across all risk profiles, with the adjustment focused primarily on taking profits in posi tions that have outperformed year -to-date. We are trimming small -cap and clean energy exposures following their recent strength and realloc ating proceeds toward broader US large -cap exposure. International developed market exposure is also reduced modestly in higher -risk models. Emerging markets, China, and AI/innovation allocations remain unchanged, reflecting our continued conviction in these structural growth themes. Fixed income allocation refinement: We are modestly increasing allocations to broad US aggregate bonds to support portfolio balance as equity risk is reduced. The overall structure of the fixed income sleeve remains unchanged - combining passive aggregate exposure, active syste matic bond strategies, interest rate volatility hedging, and targeted high -yield exposure, continuing to provide income generation, duration management , and inflation resilience. Alternatives allocation enhancement: We are increasing allocations to managed futures to reinforce the diversification benefits of the alternatives sleeve. Other alternative exposures, including gold, bitcoin, carbon credits, mortgage REITs, and option -based income strategies, remain unchanged.
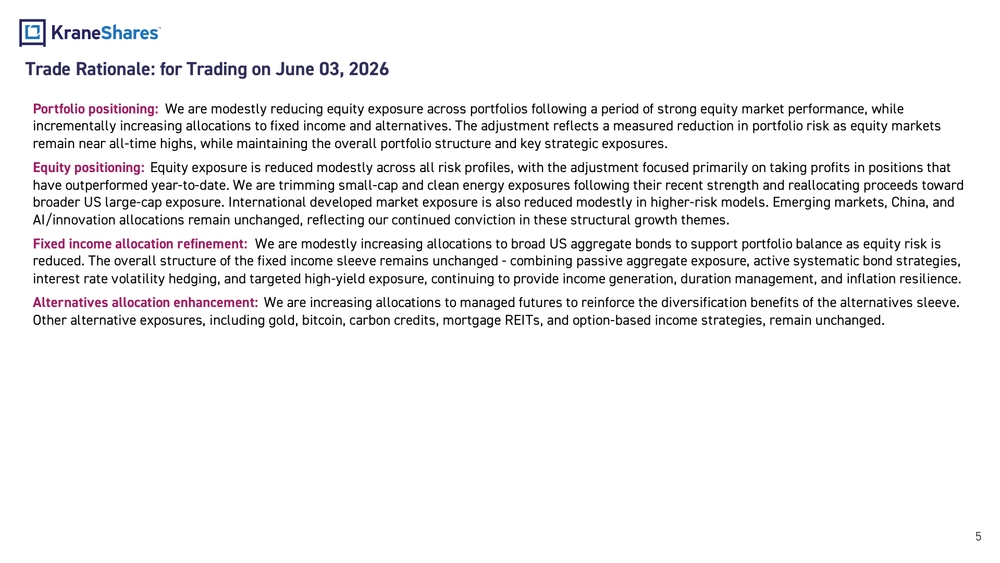
6 Latest Holdings (%) As of 06/03/2026. Excluding Cash. Using an asset allocation strategy does not guarantee a profit or protection against a loss, and diversification does not eli minate the risk of investment losses.Portfolio Ticker Net Expense Ratio Growth Balanced Conservative Cautious Equity 63.0% 47.0% 32.0% 16.0% KraneShares Value Line Dynamic Dividend Eq ETF KVLE 0.56 6.0% 8.0% 8.0% 6.0% iShares Core S&P 500 ETF IVV 0.03 12.0% 7.0% 2.5% 0.0% KraneShares Hedgeye Hedged Equity Index ETF KSPY 0.88 3.0% 3.0% 3.0% 2.0% iShares Core S&P Small -Cap ETF IJR 0.06 5.0% 4.0% 2.0% 1.0% KraneShares Man Buyout Beta Index ETF BUYO 0.89 4.0% 3.0% 2.0% 1.0% iShares MSCI EAFE ETF IEFA 0.07 8.0% 5.0% 1.5% 1.0% KraneShares MSCI EM ex China Index ETF KEMX 0.24 8.0% 5.0% 3.0% 1.0% KraneShares CSI China Internet ETF KWEB 0.70 6.0% 4.0% 3.0% 1.0% KraneShares Bosera MSCI China A 50 ETF KBA 0.56 5.0% 3.0% 2.0% 1.0% iShares Global Clean Energy ETF ICLN 0.39 2.0% 1.0% 1.0% 0.0% KraneShares Artificial Intelligence & Tech ETF AGIX 0.99 2.0% 2.0% 2.0% 1.0% KraneShares Global Humanoid & Embodied Intelligence ETF KOID 0.69 2.0% 2.0% 2.0% 1.0% Fixed Income 17.0% 33.0% 50.0% 67.0% iShares Core US Aggregate Bond ETF AGG 0.03 6.0% 11.0% 17.0% 23.0% iShares Systematic Bond ETF SYSB 0.25 4.0% 9.0% 16.0% 21.0% iShares Broad USD High Yield Corp Bond ETF USHY 0.08 1.0% 2.0% 2.0% 2.0% KraneShares Asia Pacific High Income USD Bond ETF KHYB 0.69 1.0% 4.0% 6.0% 9.0% Quadratic Interest Rate Vol & Inflation Hedge ETF IVOL 0.98 3.0% 5.0% 7.0% 10.0% KraneShares Sustainable Ultra Short Duration ETF KCSH 0.20 2.0% 2.0% 2.0% 2.0% Alternatives 20.0% 20.0% 18.0% 17.0% KraneShares Global Carbon Strategy ETF KRBN 0.90 5.0% 5.0% 5.0% 5.0% KraneShares Mount Lucas Strategy ETF KMLM 0.90 5.0% 6.0% 5.0% 5.0% iShares Mortgage Real Estate ETF REM 0.48 3.0% 2.0% 1.0% 1.0% iShares Bitcoin Trust IBIT 0.25 1.0% 1.0% 1.0% 0.0% KraneShares China Internet & Covered Call ETF KLIP 0.95 2.0% 2.0% 2.0% 2.0% KraneShares InspereX Nd Dyn Buff High Inc ETF KIQQ 0.79 2.0% 2.0% 2.0% 2.0% iShares Gold Trust IAU 0.25 2.0% 2.0% 2.0% 2.0%
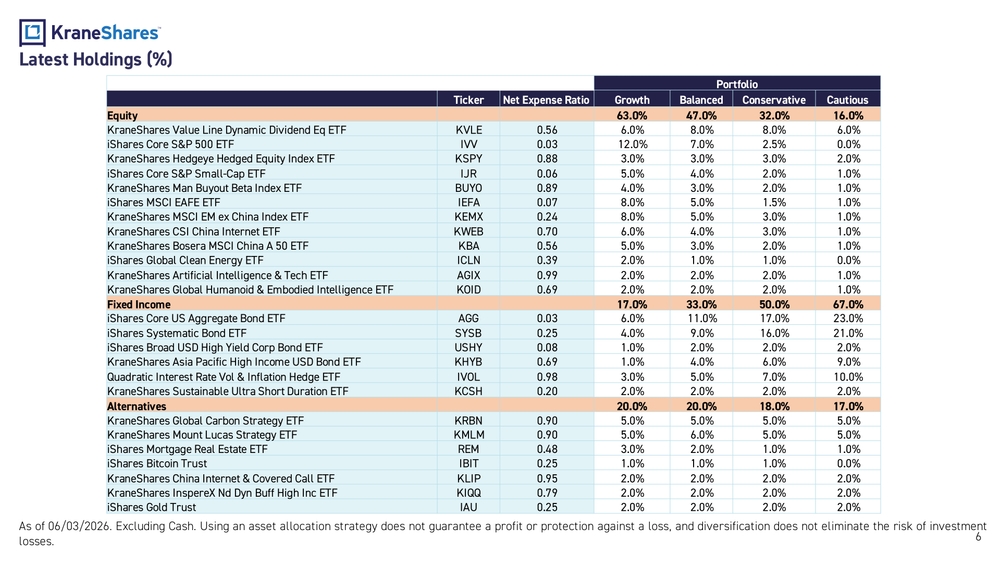
7 As of 06/03/2026. Excluding Cash. Using an asset allocation strategy does not guarantee a profit or protection against a loss, and diversification does not eli minate the risk of investment losses.Changes to Holdings (%) Portfolio Ticker Net Expense Ratio Growth Balanced Conservative Cautious Equity -2.0% -2.0% -1.0% -1.0% KraneShares Value Line Dynamic Dividend Eq ETF KVLE 0.56 - - - - iShares Core S&P 500 ETF IVV 0.03 1.0% 1.0% 0.5% - KraneShares Hedgeye Hedged Equity Index ETF KSPY 0.88 - - - - iShares Core S&P Small -Cap ETF IJR 0.06 -1.0% -1.0% -1.0% -1.0% KraneShares Man Buyout Beta Index ETF BUYO 0.89 - - - - iShares MSCI EAFE ETF IEFA 0.07 -1.0% -1.0% -0.5% - KraneShares MSCI EM ex China Index ETF KEMX 0.24 - - - - KraneShares CSI China Internet ETF KWEB 0.70 - - - - KraneShares Bosera MSCI China A 50 ETF KBA 0.56 - - - - iShares Global Clean Energy ETF ICLN 0.39 -1.0% -1.0% - - KraneShares Artificial Intelligence & Tech ETF AGIX 0.99 - - - - KraneShares Global Humanoid & Embodied Intelligence ETF KOID 0.69 - - - - Fixed Income 1.0% 1.0% 1.0% 1.0% iShares Core US Aggregate Bond ETF AGG 0.03 1.0% 1.0% 1.0% 1.0% iShares Systematic Bond ETF SYSB 0.25 - - - - iShares Broad USD High Yield Corp Bond ETF USHY 0.08 - - - - KraneShares Asia Pacific High Income USD Bond ETF KHYB 0.69 - - - - Quadratic Interest Rate Vol & Inflation Hedge ETF IVOL 0.98 - - - - KraneShares Sustainable Ultra Short Duration ETF KCSH 0.20 - - - - Alternatives 1.0% 1.0% 0.0% 0.0% KraneShares Global Carbon Strategy ETF KRBN 0.90 - - - - KraneShares Mount Lucas Strategy ETF KMLM 0.90 1.0% 1.0% - - iShares Mortgage Real Estate ETF REM 0.48 - - - - iShares Bitcoin Trust IBIT 0.25 - - - - KraneShares China Internet & Covered Call ETF KLIP 0.95 - - - - KraneShares InspereX Nd Dyn Buff High Inc ETF KIQQ 0.79 - - - - iShares Gold Trust IAU 0.25 - - - -
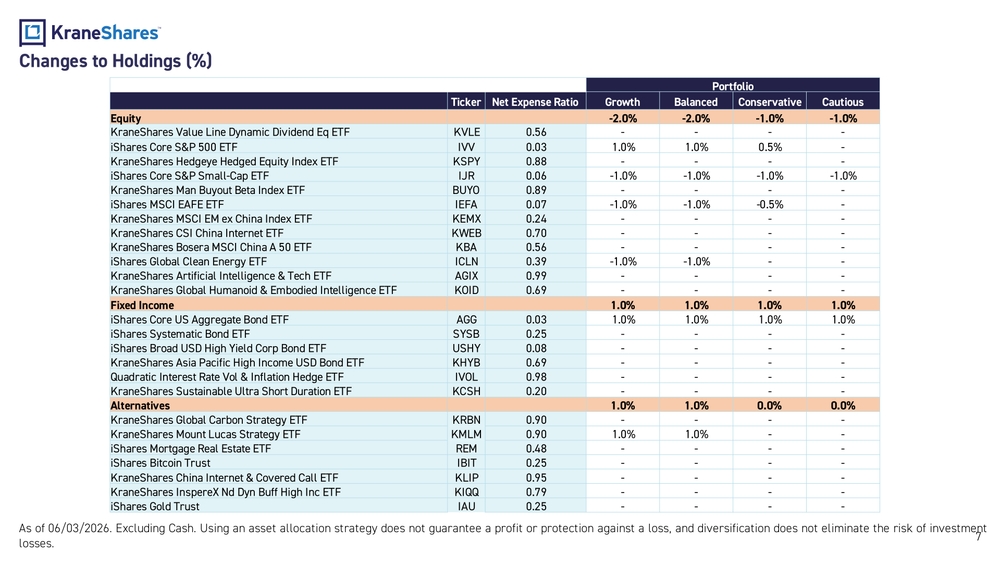
8 Model Performance (%) Cumulative % Annualized % 1 Mo 3 Mo 1 Yr. 3 Yr. 5 Yr. 10 Yr.Since Inception (09/03/2024) Growth Allocation Composite (Net of ETF Fees) 7.40% 2.91% 26.55% - - - 17.11% Benchmark (70% ACWI, 20% US Agg., 10% Liq. Alt. Beta)7.18% 2.58% 23.17% - - - 13.80% Balanced Allocation (Net of ETF Fees) 5.82% 2.31% 20.80% - - - 13.70% Benchmark (55% ACWI, 35% US Agg., 10% Liq. Alt. Beta)5.68% 2.05% 19.04% - - - 11.52% Conservative Allocation (Net of ETF Fees) 4.37% 1.57% 14.92% - - - 10.09% Benchmark (35% ACWI, 55% US Agg., 10% Liq. Alt. Beta)3.66% 1.32% 13.66% - - - 8.50% Cautious Allocation (Net of ETF Fees) 2.64% 0.79% 9.26% - - - 6.52% Benchmark (20% ACWI, 70% US Agg., 10% Liq. Alt. Beta)2.15% 0.75% 9.72% - - - 6.25% The performance data quoted represents past performance. Past performance does not guarantee future results. The investment return and principal value of an investment will fluctuate so that an investor's shares, when sold or redeemed, may be worth more or less than their original cost and current performance may be lower or higher than the performance quoted. Please read the disclosures on subsequent pages carefully.Data from Charles Schwab and KraneShares as of 04/30/2026. Allocations are subject to change. US Agg. = The Bloomberg US Aggr egate Bond Index. Liq. Alt. Beta = The Credit Suisse Liquid Alternative Beta Index. ACWI = The MSCI All Country World Index. Please see the end of the presentation for index definitions . KraneShares claims compliance with the Global Investment Performance Standards (GIPS®) and has prepared and presented this report in compliance with the GIPS standards. KraneShares has been independently verified for the periods April 1, 2015 to September 30, 2024. The verification report is available upon request. A firm that claims compliance with the GIPS standar ds must establish policies and procedures for complying with all the applicable requirements of the GIPS standards. Verification provides assur ance on whether the firm’s policies and procedures related to composite and pooled fund maintenance, as well as the calculation, presentation, and distribution of performance, have been designed in compliance with the GIPS standards and have been implemented on a firm-wide basis. Verification does not provide assurance on the accuracy of any specific performance report .
9 Investing involves risk, including possible loss of principal. There can be no assurance that a Fund or Model Portfolio will achieve its stated objectives. Indexes are unmanaged and one cannot invest directly in an index. Index returns do not reflect fees or other costs associated with investing. The Model Portfolios typically include target allocations to KraneShares and BlackRock ETFs, notwithstanding the fact that there may be a similar third-party ETF with a higher rating, lower fees and expenses, or better performance. KraneShares will indirectly benefit from investments in KraneShares ETFs base d on the Model Portfolios through fees paid by the ETFs to KraneShares for advisory (and other) services. Therefore, KraneShares has an incentive to select KraneShares ETFs (including those with higher fees) to be part of a Model Portfolio. This may result in Model Portfolios that achieve a level of performance less favorable or reflecting higher fees t han otherwise would be the case if the Model Portfolios did not include target allocations to KraneShares ETFs. All performance presented, except for index performance, is “net” of all applicable management fees, including fees and expen ses charged by the underlying funds. The benchmark index reflects the reinvestment of any cash distributions after the deduction of any withholding tax using the maximum rate applicable to non -resid ent institutional investors who do not benefit from double taxation treaties. The KraneShares Strategic Wealth Model Portfolios (“Model Portfolios”) are for illustrative purposes only to demonstrate how certain ETFs, including but not limited to KraneShares ETFs, can potentially fit into an investor’s portfolio. The Model Portfolios do not represent personalized investment advice or an investment recom mendation by KraneShares. Financial professionals can use the Model Portfolios, together with other information and their own independent judgment , as a resource to help build a portfolio or aid in the development of investment advice for their clients. The Model Portfol ios cannot be invested in directly. The Model Portfolios are not Funds or other investments. Performance is calculated by Charles Schwab, Krane’s trading and execution platform, based on the value of the proprietary accounts manag ed by Krane in accordance with the Model Portfolios. The value of these accounts is determined by the market value of the ETFs. If the performance was calculated based on the NAV of the ETFs, the performance would be different. Using an asset allocation strategy does not guarantee a profit or protection against loss, and diversification does not elimi nate the risk of experiencing investment losses. Index performance and volatility are materially different from that of any Model Portfolio. There is no assurance that investing in accordance with a Model Po rtfolio’s allocations will provide positive performance over any period and investors should understand that they may experience losses (including total loss) when investing based on a Model Portfolio. The Model Portfolios are provided “as is”, without any warranty of any kind, expressed or implied. KraneShares may make updates to the recommendations allocations that comprise the Model Portfolios from time to time. However, KraneShares assumes no duty to update the Model Portfolios on any given schedule. Information and other marketing materials provided to you by KraneShares or any third party concerning a KraneShares Model Portfolio, including allocations, performance, and other characteristics prior to the Model Portfolio’s inception date are not indicative of an investor’s experience, meaning that, beginning on that date, accounts were managed in accordance with the model. (Continued on the next page)
10 The information and opinions expressed in this document are for informational purposes only. Any recommendation or opinion made in this document may not be suitable for all investors. The information contained herein does not constitute and should not be construed as investment advice, an offering of investment advisory services, or an offer to sell or a solicitation to buy any security. Each financial professional making use of the Model Portfolios is solely responsible for making investment recommendations and/or decisions with respect to its clients without input from KraneShares, including with respect to investing in accordance with any Model Portfolio or any particular security. KraneShares is not acting in an investment advisory, fiduciary or quasi - fiduciary capacity to any financial professional or its client. This material should not serve as a primary basis for investment decisions. This material has been prepared without regard to the individual financial circumstances and objectives of any investor, and the appropriateness of a particular investment or strategy will depend on an investor’s individual circumstances and objectives. Investors and their financial professionals should consider the investors’ individual financial circumstances, investment time frame, risk tolerance level, and investment goals. Investors and their financial professionals should consider the investment objectives, risks, charges and expenses of the ETFs underlying any Model Portfolio carefully before investing based on a Model Portfolio. A prospectus containing this and other information with respect to any KraneShares ETFs that are a part of a Model Portfolio is available at www.kraneshares.com . With respect to any non-KraneShares ETF that is part of a Model Portfolio, please visit www.ishares.com to obtain a prospectus. KraneShares does not endorse and is not responsible for or liable for any content or other materials made available by other ETF sponsors. Investors should read the prospectus for each ETF that comprises a model portfolio carefully before investing based on a Model Portfolio. KraneShares does not have investment discretion over, or place trade orders for, any account derived from the Model Portfolio s by a financial professional. Accordingly, the holdings, performance, and other characteristics of any account derived from the Model Portfolios by a financial professional may vary materially fr om what is presented here. iShares® and BlackRock® are registered trademarks of BlackRock, Inc. and its affiliates (“BlackRock”) and are used under lice nse. BlackRock makes no representations or warranties regarding the advisability of investing in any product or the use of any service offered by Krane Funds Advisors, LLC. BlackRock has no obligation or liability in connection with the operation, marketing, trading, or sale of any product or service offered by Krane Funds Advisors, LLC. For each individual fund’s top ten holdings, standard performance, and risks, please visit www.kraneshares.com for KraneShares ETFs and www.ishares.com for BlackRock ETFs.
11 MSCI All Country World Index (ACWI): The MSCI ACWI captures large and mid cap representation across 23 Developed Markets (DM) and 24 Emerging Markets (EM) countri es*. With 2,757 constituents, the index covers approximately 85% of the global investable equity opportunity set. The index was launche d on May 31, 1990. Bloomberg US Aggregate Index (US Agg.) : The Bloomberg US Aggregate Bond Index is a broad -based flagship benchmark that measures the investment grade, US dollar - denominated, fixed -rate taxable bond market. The index includes Treasuries, government -related and corporate securities, fixed -rate agency MBS, ABS and CMBS (agency and non - agency). Provided the necessary inclusion rules are met, US Aggregate -eligible securities also contribute to the multi -currency Global Aggregate Index and the US Universal Index. The US Aggregate Index was created in 1986. Credit Suisse Liquid Alternative Beta Index (Liq. Alt. Beta): Using only liquid securities, the Credit Suisse Liquid Alternative Beta Index seeks to replicate the return of the overall hedge fund industry, as represented by the Credit Suisse Hedge Fund Index. The Credit Suisse Liquid Alternative Beta Index re flects the combined returns of the individual LAB strategy indices – Long/Short, Event Driven, Global Strategies, Merger Arbitrage and Managed Futures – weighted according to the ir respective strategy weights in the Credit Suisse Hedge Fund Index.Definitions: