Managed Futures ETF Overview | KMLM : Managed Futures
by Kraneshares
Trend Following and Uncorrelated Assets – A Strategy for Uncertain Times KraneShares Mount Lucas Managed Futures Index Strategy ETF (Ticker: KMLM) info@kfafunds.com KMLM 9/30/2026 1
2Investment Strategy KMLM is benchmarked to the KFA MLM Index, which consists of a portfolio of twenty -two liquid futures contracts traded on U.S. and foreign exchanges. The Index includes futures contracts on 11 commodities, 6 currencies, and 5 global bond markets. These three baskets are weighted by their relative historical volatility, and within each basket, the constituent markets are equal dollar weighted. KMLM Features •Access to managed futures through a liquid and low -cost ETF structure1 •Managed futures are considered alternative investments and may provide additional diversification and decrease volatility when included within traditional equity/bond portfolios2 •A potential hedge on equity, bond, and commodity risk •Sub-advised by Mount Lucas Management, who in 1988 created the MLM Index, the first passive index to measure the returns to risk bearing in futures markets3 KMLM Partner Mount Lucas, the sub -advisor of KMLM, is a Newtown, PA based asset manager founded in 1986. Since its founding, Mount Lucas has provided innovative alternative investment strategies to institutional and high -net-worth investors that enhance and diversify traditional investments. Mount Lucas’ investment professionals have extensive experience in the development and use of systematic investment strategies that access alternative risk premia as well as a long history of discretionary macro trading and risk taking.3KMLM KraneShares Mount Lucas Managed Futures Index Strategy ETF 1.Buying and selling shares of the KFA Mount Lucas Index Strategy ETF may result in brokerage commissions. 2.Diversification does not ensure a profit or guarantee against a loss. 3.Source: Mount Lucas Management
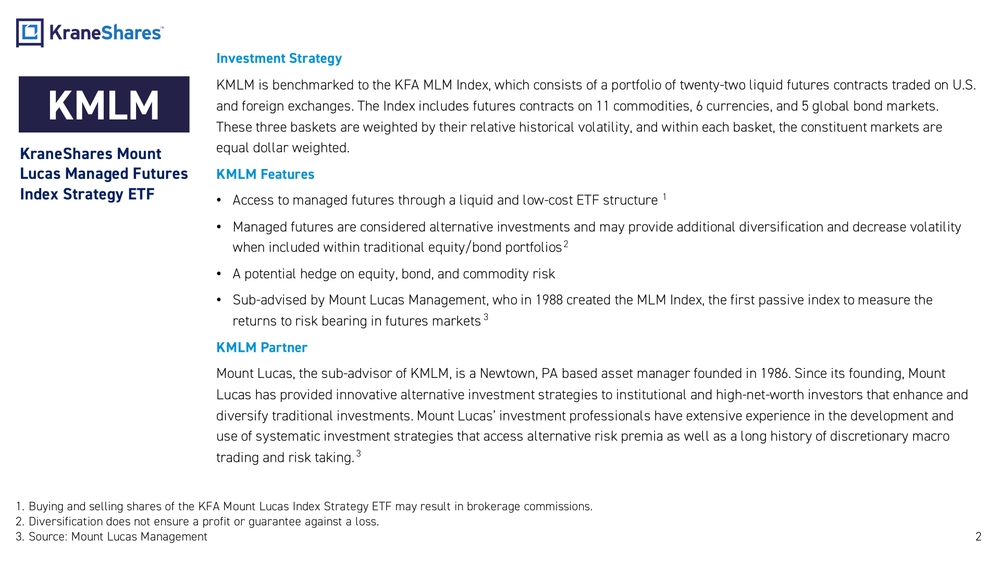
3Source: Mount Lucas Management as of 9/30/2026. Diversification does not ensure a profit or guarantee against a loss. Firm founded -First client was the Kodak Pension PlanLaunched the industry’s first alternative beta index, the MLM Index
- FedEx Pension plan was the initial investor Established flagship Global Macro Strategy -MLM Macro PeakLaunched quantitative macro fund, MLM SymmetryAssets under advisement across all strategies as of Sep 2026 1986 1988 1996 2013 $3.1bn OUR MISSION Mount Lucas seeks to provide innovative alternative investment strategies that enhance and diversify traditional investments Our products employ a distinct approach that utilizes proprietary quantitative models and the collective discretionary insight of the investment teamOUR INVESTMENT EDGE Firm applies a unique investment philosophy that seeks to earn the premium available to investors by taking economic risk Unwavering approach backed by sophisticated technology for managing the portfolio and risk Mount Lucas’ principals are co -invested with client portfolios in every strategy offered by the firmOUR MANAGEMENT Tim Rudderow , co-founder of Mount Lucas, serves as the Chairman Management team with 140+ years of combined industry experience and have worked together for at least 18 years Highly collaborative culture interconnects investment management and client services and provides breadth, diversity, and continuity of leadershipMLM INDEX TM In 1988, Mount Lucas Management introduced the MLM Index as the first passive trend following index of the returns to futures investing. Underlying the MLM Index is the fact that the mismatch in commercial firms’ futures positions is greatest, and investor profits most pronounced, when the underlying market is moving broadly from one price level to another, either up or down. The MLM Index employs a simple algorithm to measure the extent and profitability of such price transitions to provide a metric of the returns to economic risk bearing in futures markets.
4What are managed futures? Futures markets were created over 150 years ago for a single purpose, to facilitate the transfer of price risk away from produce rs and consumers. By participating in the futures markets, a managed futures portfolio acts as an important market participant, accepting that price risk and providing liquidity to commercial interests. Futures markets are traded on public exchanges and are based on a standardized futures contracts in equ ities, bonds, currencies, and commodities.What are the benefits of investing in managed futures? The primary benefit of investing in managed futures is the mitigation of portfolio risk through an uncorrelated asset class. Further, during periods of market stress, managed futures has historically shown greater potential for negative correlations. Institutional investors may emplo y an active futures manager for a variety of reasons. However, investors of all types may use managed futures to diversify risks in a portfolio that does not already consist of derivatives. Who are active futures managers? Active futures managers are highly trained individuals designated by the CFTC as Commodity Trading Advisors (CTAs), who trade futures across a wide array of commodities and other assets on behalf of clients.
$354 Billion Assets in managed futures, mostly in private vehicles192% Of CTA -industry assets under management are deployed by systematic traders 1Managed Futures at a Glance 15% The average return of a managed futures portfolio during the 2008 Global Financial Crisis2 1.Data from BarclayHedge as of 9/30/2026. 2.Data from Altegris as of 8/2011. Data presented is for informational purposes only and is not meant to guide any investment decision. Past perfo rmance does not guarantee future results. Retrieved on 9/30/2026 . Diversification does not ensure a profit or guarantee against a loss. See the end of the presentation for term definitions.Managed Futures Overview
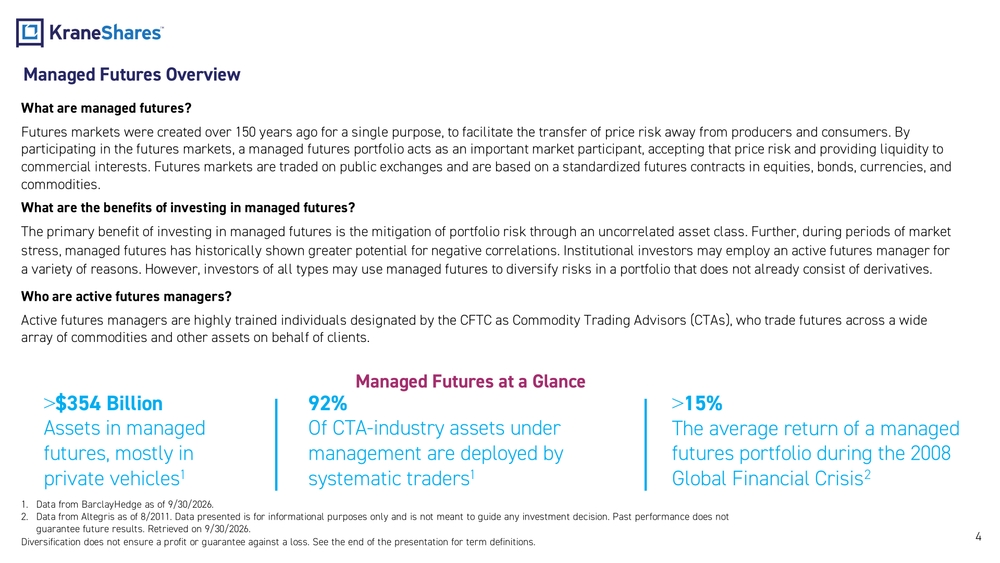
5Transparent Beta Index of Managed Futures. First product of its kind in the marketCost Efficient ETF Structure KFA MLM Index Strategy ETF has an annual operating expense of 0.90%, compared to 1.66% for the average managed futures mutual fund.* Longest Track Record Originally conceived in 1988 , Mount Lucas has been replicating for client accounts since 1993 . Excellent Liquidity All markets in the Index are liquid exchange traded futures limiting counter - party risk . Consistent Diversification We believe our methodology , particularly our ideas around position sizing and volatility targeting, is more transparent and understandable . It offers greater portfolio diversification in a crisis as we are not necessarily providing volatility reducing exposure. It can also be a diversifying (or even a complement ) to a basket of managed futures investments.1KFA MLM Index Key Characteristics *Data from Morningstar as of 9/30/2026. Diversification does not ensure a profit or guarantee against a loss. See the end of the presentation for term definitions.
- Source: Mount Lucas Management
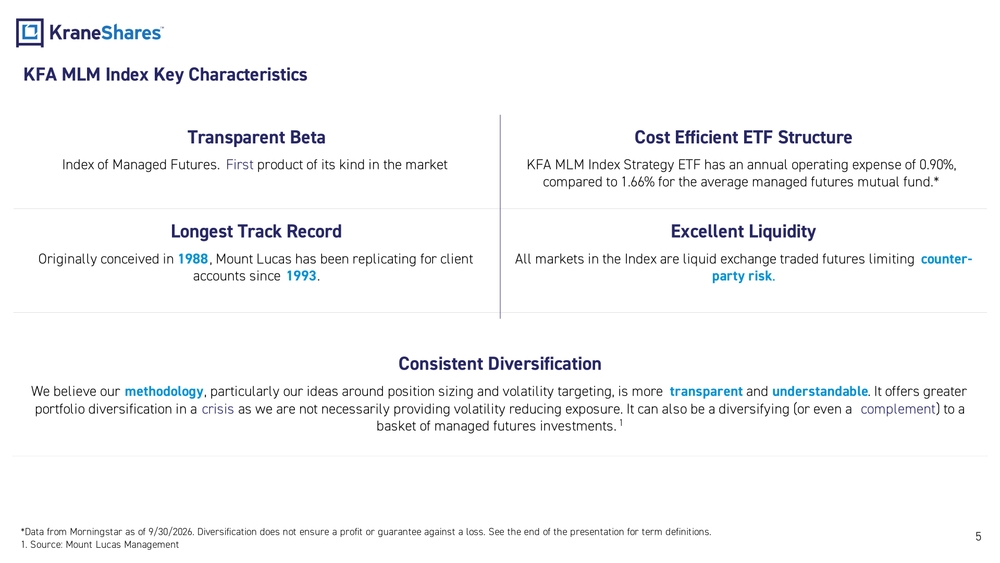
6Global Fixed Income 42.5% Currencies 32.5%Commodities 25.0%KFA MLM Index Target Allocation by Underlying Asset Canadian Govt. Bond German Govt. BondJapanese Govt. BondUK GiltUS TreasuryCopperGoldHeating OilGasolineCrude OilNatural GasSoybeansCornWheatSugarLive Cattle Australian DollarBritish PoundCanadian DollarEuroJapanese YenSwiss Franc•The KFA MLM Index tracks the performance of Mount Lucas’ managed futures strategy. •The index is meant to reflect the return available to managed futures investors through an efficient passive trend following algorithm. •The Mount Lucas team trades futures contracts derived from the value of various commodities, currencies, and government bonds. Data from Mount Lucas. The weights displayed above are target exposure allocations and the index may not precisely match these weights at all times. See the end of the presentation for index definitions.KFA MLM Index Overview
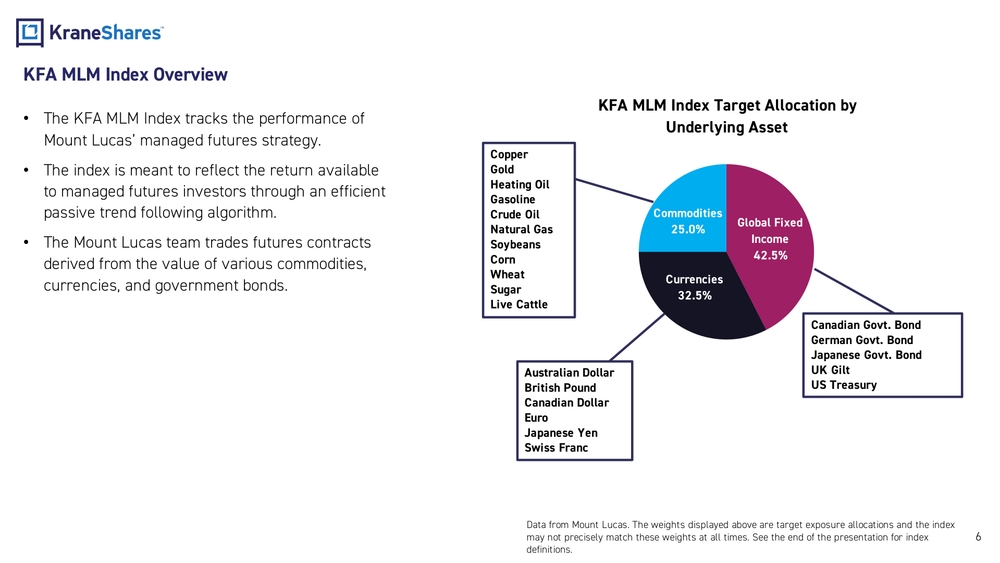
22 Highly Liquid Futures Contracts Allocate Risk Across Sectors and Markets Generate Trend Signal Daily Execution KMLMThe KFA Mount Lucas Index trades 11 commodities, 6 currencies and 5 global bond markets. Risk is allocated to each sector based on relative historical volatility and rebalanced monthly. A daily trend signal is generated based on each market's price versus its long- term moving average. Signals can be long or short. Evaluates market trading signals once per day, rebalances on the first of the month and rolls futures contracts forward on a market - by-market basis. Periods of volatility create opportunities for profit, as investors assume risk that hedgers wish to avoid. When prices are more volatile, one can expect the premium businesses are willing to pay is larger, and when prices are stable, one can expect the premiums to be lower. KFA MLM Index Implementation Risk Mitigation •The index has the potential to outperform during periods of price instability and dislocation. •The index is also meant to exhibit lower volatility than the broader market during such periods, providing a meaningful diversification impact. Transparency •Many managed futures strategies are opaque and do not provide regular pricing. •The KFA MLM Index improves transparency by providing investors with monthly pricing and a performance history dating to 1988. See the end of the presentation for index and term definitions. Diversification does not ensure a profit or guarantee against a loss. 7
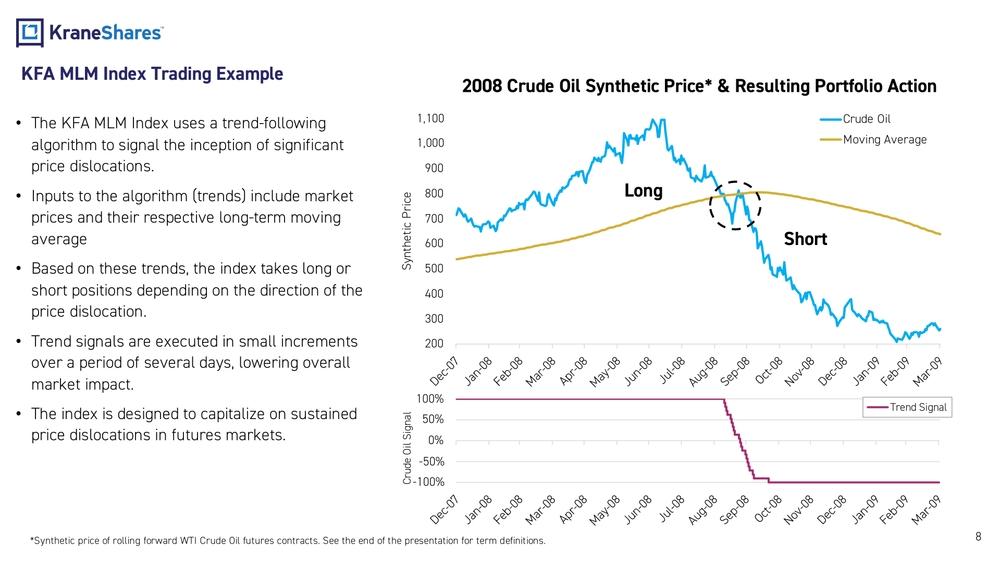
82003004005006007008009001,0001,100Synthetic PriceCrude Oil Moving Average ShortLong•The KFA MLM Index uses a trend -following algorithm to signal the inception of significant price dislocations. •Inputs to the algorithm (trends) include market prices and their respective long -term moving average •Based on these trends, the index takes long or short positions depending on the direction of the price dislocation. •Trend signals are executed in small increments over a period of several days, lowering overall market impact. •The index is designed to capitalize on sustained price dislocations in futures markets. Synthetic price of rolling forward WTI Crude Oil futures contracts. See the end of the presentation for term definitions. -100%-50%0%50%100%Crude Oil SignalTrend Signal2008 Crude Oil Synthetic Price & Resulting Portfolio ActionKFA MLM Index Trading Example
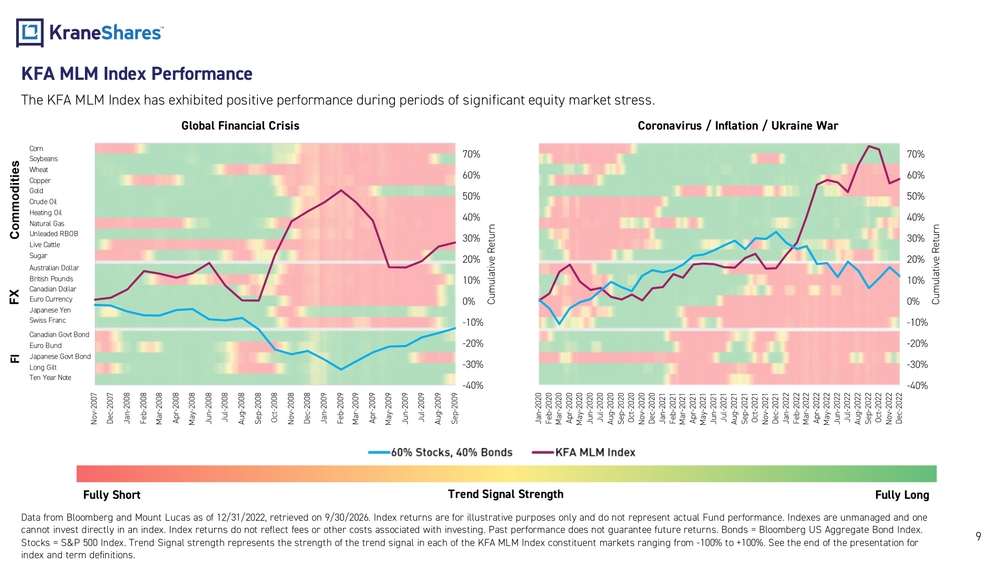
9KFA MLM Index Performance The KFA MLM Index has exhibited positive performance during periods of significant equity market stress. Data from Bloomberg and Mount Lucas as of 12/31/2022, retrieved on 9/30/2026. Index returns are for illustrative purposes onl y and do not represent actual Fund performance. Indexes are unmanaged and one cannot invest directly in an index. Index returns do not reflect fees or other costs associated with investing. Past performa nce does not guarantee future returns. Bonds = Bloomberg US Aggregate Bond Index. Stocks = S&P 500 Index. Trend Signal strength represents the strength of the trend signal in each of the KFA MLM Index constitue nt markets ranging from -100% to +100%. See the end of the presentation for index and term definitions. Commodities FX FIGlobal Financial Crisis Coronavirus / Inflation / Ukraine War Fully Short Fully Long Trend Signal StrengthCorn SoybeansWheatCopperGoldCrude OilHeating OilNatural GasUnleaded RBOBLive Cattle Sugar Australian Dollar British PoundsCanadian Dollar Euro Currency Japanese YenSwiss Franc Canadian Govt Bond Euro Bund Japanese Govt BondLong GiltTen Year Note
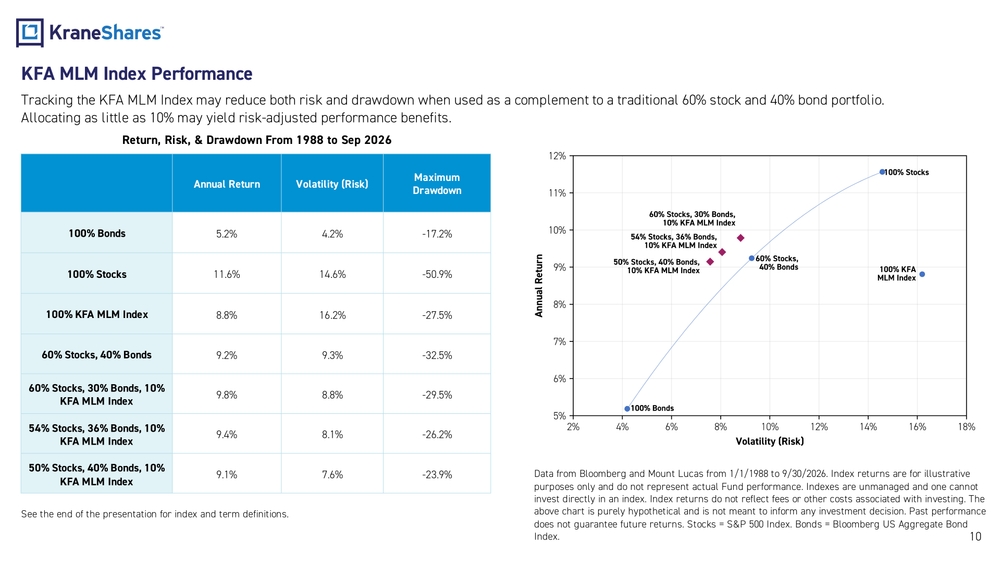
10KFA MLM Index Performance Tracking the KFA MLM Index may reduce both risk and drawdown when used as a complement to a traditional 60% stock and 40% bon d portfolio. Allocating as little as 10% may yield risk -adjusted performance benefits. Data from Bloomberg and Mount Lucas from 1/1/1988 to 9/30/2026. Index returns are for illustrative purposes only and do not represent actual Fund performance. Indexes are unmanaged and one cannot invest directly in an index. Index returns do not reflect fees or other costs associated with investing. The above chart is purely hypothetical and is not meant to inform any investment decision. Past performance does not guarantee future returns. Stocks = S&P 500 Index. Bonds = Bloomberg US Aggregate Bond Index. Annual Return Volatility (Risk)Maximum Drawdown 100% Bonds 5.2% 4.2% -17.2% 100% Stocks 11.6% 14.6% -50.9% 100% KFA MLM Index 8.8% 16.2% -27.5% 60% Stocks, 40% Bonds 9.2% 9.3% -32.5% 60% Stocks, 30% Bonds, 10% KFA MLM Index9.8% 8.8% -29.5% 54% Stocks, 36% Bonds, 10% KFA MLM Index9.4% 8.1% -26.2% 50% Stocks, 40% Bonds, 10% KFA MLM Index9.1% 7.6% -23.9%Return, Risk, & Drawdown From 1988 to Sep 2026 See the end of the presentation for index and term definitions.
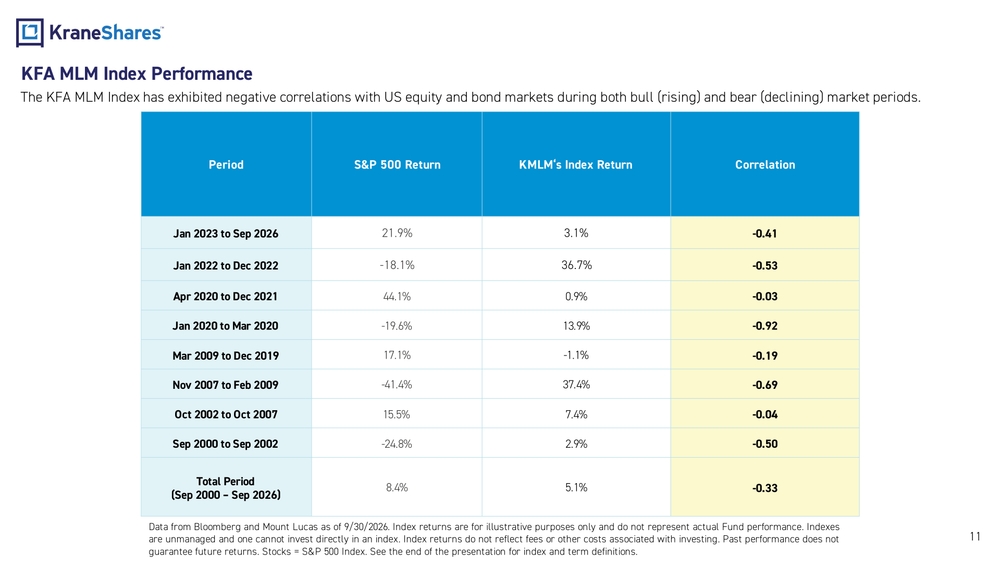
11The KFA MLM Index has exhibited negative correlations with US equity and bond markets during both bull (rising) and bear (dec lining) market periods. Period S&P 500 Return KMLM‘s Index Return Correlation Jan 2023 to Sep 2026 21.9% 3.1% -0.41 Jan 2022 to Dec 2022 -18.1% 36.7% -0.53 Apr 2020 to Dec 2021 44.1% 0.9% -0.03 Jan 2020 to Mar 2020 -19.6% 13.9% -0.92 Mar 2009 to Dec 2019 17.1% -1.1% -0.19 Nov 2007 to Feb 2009 -41.4% 37.4% -0.69 Oct 2002 to Oct 2007 15.5% 7.4% -0.04 Sep 2000 to Sep 2002 -24.8% 2.9% -0.50 Total Period (Sep 2000 – Sep 2026)8.4% 5.1% -0.33 Data from Bloomberg and Mount Lucas as of 9/30/2026. Index returns are for illustrative purposes only and do not represent ac tual Fund performance. Indexes are unmanaged and one cannot invest directly in an index. Index returns do not reflect fees or other costs associated with inves ting. Past performance does not guarantee future returns. Stocks = S&P 500 Index. See the end of the presentation for index and term definitions.KFA MLM Index Performance
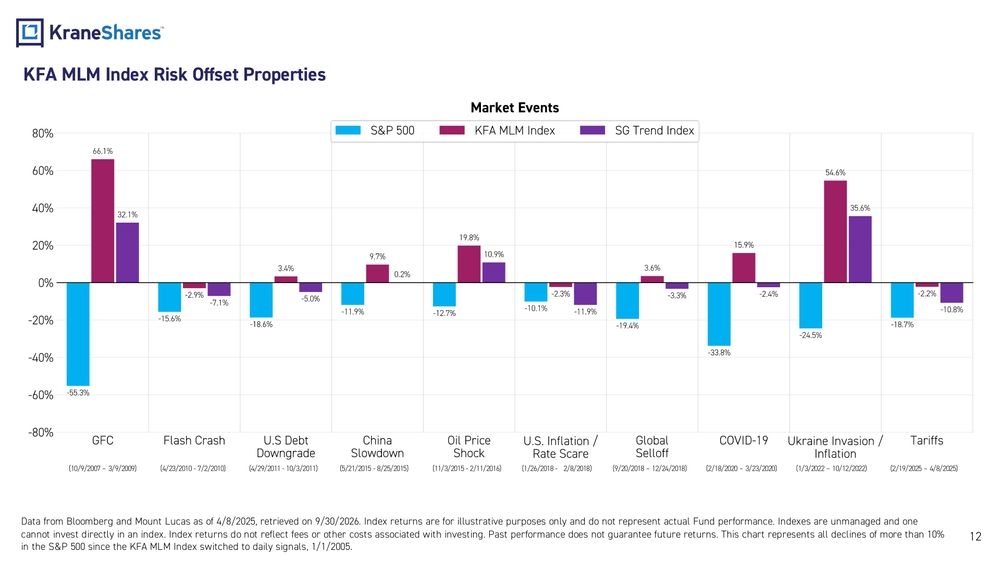
KFA MLM Index Risk Offset Properties Data from Bloomberg and Mount Lucas as of 4/8/2025, retrieved on 9/30/2026. Index returns are for illustrative purposes only and do not represent actual Fund performance. Indexes are unmanaged and one cannot invest directly in an index. Index returns do not reflect fees or other costs associated with investing. Past performa nce does not guarantee future returns. This chart represents all declines of more than 10% in the S&P 500 since the KFA MLM Index switched to daily signals, 1/1/2005.12(4/23/2010 - 7/2/2010) (4/29/2011 - 10/3/2011) (5/21/2015 - 8/25/2015) (11/3/2015 - 2/11/2016) (1/26/2018 - 2/8/2018) (9/20/2018 – 12/24/2018) (2/18/2020 – 3/23/2020) (1/3/2022 – 10/12/2022) (2/19/2025 – 4/8/2025) (10/9/2007 – 3/9/2009)
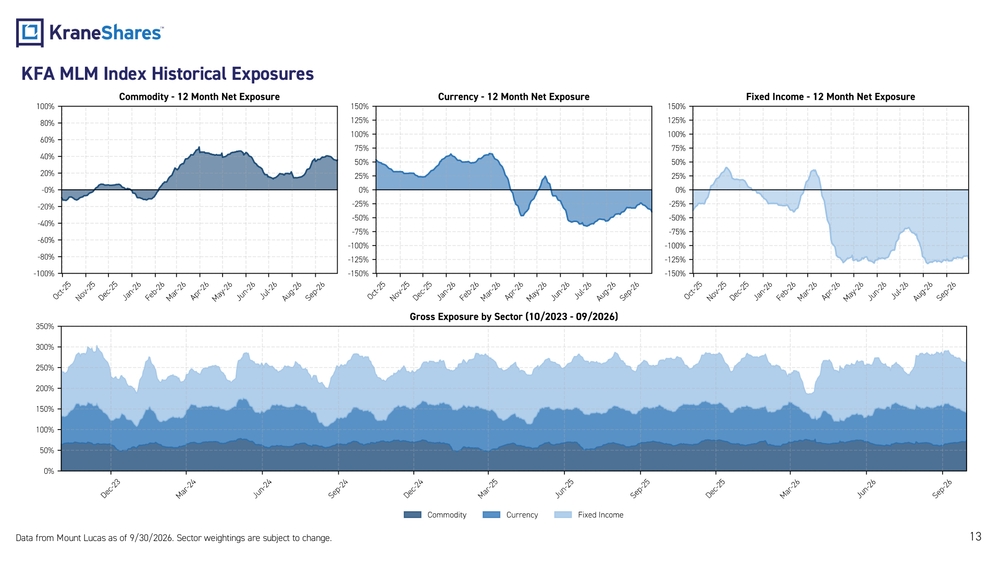
13 Data from Mount Lucas as of 9/30/2026. Sector weightings are subject to change. KFA MLM Index Historical Exposures
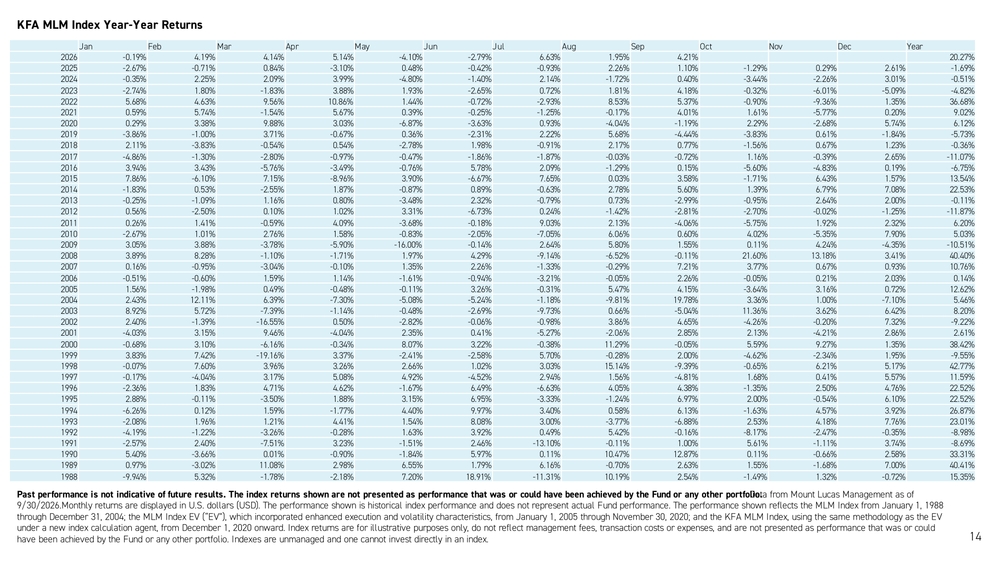
14Past performance is not indicative of future results. The index returns shown are not presented as performance that was or could have been achieved by the Fund or any other portfolio. Data from Mount Lucas Management as of 9/30/2026. Monthly returns are displayed in U.S. dollars (USD). The performance shown is historical index performance and does not repre sent actual Fund performance. The performance shown reflects the MLM Index from January 1, 1988 through December 31, 2004; the MLM Index EV (“EV”), which incorporated enhanced execution and volatility characteristics, fro m January 1, 2005 through November 30, 2020; and the KFA MLM Index, using the same methodology as the EV under a new index calculation agent, from December 1, 2020 onward. Index returns are for illustrative purposes only, do not r eflect management fees, transaction costs or expenses, and are not presented as performance that was or could have been achieved by the Fund or any other portfolio. Indexes are unmanaged and one cannot invest directly in an index.KFA MLM Index Year -Year Returns Jan Feb Mar Apr May Jun Jul Aug Sep Oct Nov Dec Year 2026 -0.19% 4.19% 4.14% 5.14% -4.10% -2.79% 6.63% 1.95% 4.21% 20.27% 2025 -2.67% -0.71% 0.84% -3.10% 0.48% -0.42% -0.93% 2.26% 1.10% -1.29% 0.29% 2.61% -1.69% 2024 -0.35% 2.25% 2.09% 3.99% -4.80% -1.40% 2.14% -1.72% 0.40% -3.44% -2.26% 3.01% -0.51% 2023 -2.74% 1.80% -1.83% 3.88% 1.93% -2.65% 0.72% 1.81% 4.18% -0.32% -6.01% -5.09% -4.82% 2022 5.68% 4.63% 9.56% 10.86% 1.44% -0.72% -2.93% 8.53% 5.37% -0.90% -9.36% 1.35% 36.68% 2021 0.59% 5.74% -1.54% 5.67% 0.39% -0.25% -1.25% -0.17% 4.01% 1.61% -5.77% 0.20% 9.02% 2020 0.29% 3.38% 9.88% 3.03% -6.87% -3.63% 0.93% -4.04% -1.19% 2.29% -2.68% 5.74% 6.12% 2019 -3.86% -1.00% 3.71% -0.67% 0.36% -2.31% 2.22% 5.68% -4.44% -3.83% 0.61% -1.84% -5.73% 2018 2.11% -3.83% -0.54% 0.54% -2.78% 1.98% -0.91% 2.17% 0.77% -1.56% 0.67% 1.23% -0.36% 2017 -4.86% -1.30% -2.80% -0.97% -0.47% -1.86% -1.87% -0.03% -0.72% 1.16% -0.39% 2.65% -11.07% 2016 3.94% 3.43% -5.76% -3.49% -0.76% 5.78% 2.09% -1.29% 0.15% -5.60% -4.83% 0.19% -6.75% 2015 7.86% -6.10% 7.15% -8.96% 3.90% -6.67% 7.65% 0.03% 3.58% -1.71% 6.43% 1.57% 13.54% 2014 -1.83% 0.53% -2.55% 1.87% -0.87% 0.89% -0.63% 2.78% 5.60% 1.39% 6.79% 7.08% 22.53% 2013 -0.25% -1.09% 1.16% 0.80% -3.48% 2.32% -0.79% 0.73% -2.99% -0.95% 2.64% 2.00% -0.11% 2012 0.56% -2.50% 0.10% 1.02% 3.31% -6.73% 0.24% -1.42% -2.81% -2.70% -0.02% -1.25% -11.87% 2011 0.26% 1.41% -0.59% 4.09% -3.68% -0.18% 9.03% 2.13% -4.06% -5.75% 1.92% 2.32% 6.20% 2010 -2.67% 1.01% 2.76% 1.58% -0.83% -2.05% -7.05% 6.06% 0.60% 4.02% -5.35% 7.90% 5.03% 2009 3.05% 3.88% -3.78% -5.90% -16.00% -0.14% 2.64% 5.80% 1.55% 0.11% 4.24% -4.35% -10.51% 2008 3.89% 8.28% -1.10% -1.71% 1.97% 4.29% -9.14% -6.52% -0.11% 21.60% 13.18% 3.41% 40.40% 2007 0.16% -0.95% -3.04% -0.10% 1.35% 2.26% -1.33% -0.29% 7.21% 3.77% 0.67% 0.93% 10.76% 2006 -0.51% -0.60% 1.59% 1.14% -1.61% -0.94% -3.21% -0.05% 2.26% -0.05% 0.21% 2.03% 0.14% 2005 1.56% -1.98% 0.49% -0.48% -0.11% 3.26% -0.31% 5.47% 4.15% -3.64% 3.16% 0.72% 12.62% 2004 2.43% 12.11% 6.39% -7.30% -5.08% -5.24% -1.18% -9.81% 19.78% 3.36% 1.00% -7.10% 5.46% 2003 8.92% 5.72% -7.39% -1.14% -0.48% -2.69% -9.73% 0.66% -5.04% 11.36% 3.62% 6.42% 8.20% 2002 2.40% -1.39% -16.55% 0.50% -2.82% -0.06% -0.98% 3.86% 4.65% -4.26% -0.20% 7.32% -9.22% 2001 -4.03% 3.15% 9.46% -4.04% 2.35% 0.41% -5.27% -2.06% 2.85% 2.13% -4.21% 2.86% 2.61% 2000 -0.68% 3.10% -6.16% -0.34% 8.07% 3.22% -0.38% 11.29% -0.05% 5.59% 9.27% 1.35% 38.42% 1999 3.83% 7.42% -19.16% 3.37% -2.41% -2.58% 5.70% -0.28% 2.00% -4.62% -2.34% 1.95% -9.55% 1998 -0.07% 7.60% 3.96% 3.26% 2.66% 1.02% 3.03% 15.14% -9.39% -0.65% 6.21% 5.17% 42.77% 1997 -0.17% -4.04% 3.17% 5.08% 4.92% -4.52% 2.94% 1.56% -4.81% 1.68% 0.41% 5.57% 11.59% 1996 -2.36% 1.83% 4.71% 4.62% -1.67% 6.49% -6.63% 4.05% 4.38% -1.35% 2.50% 4.76% 22.52% 1995 2.88% -0.11% -3.50% 1.88% 3.15% 6.95% -3.33% -1.24% 6.97% 2.00% -0.54% 6.10% 22.52% 1994 -6.26% 0.12% 1.59% -1.77% 4.40% 9.97% 3.40% 0.58% 6.13% -1.63% 4.57% 3.92% 26.87% 1993 -2.08% 1.96% 1.21% 4.41% 1.54% 8.08% 3.00% -3.77% -6.88% 2.53% 4.18% 7.76% 23.01% 1992 -4.19% -1.22% -3.26% -0.28% 1.63% 3.92% 0.49% 5.42% -0.16% -8.17% -2.47% -0.35% -8.98% 1991 -2.57% 2.40% -7.51% 3.23% -1.51% 2.46% -13.10% -0.11% 1.00% 5.61% -1.11% 3.74% -8.69% 1990 5.40% -3.66% 0.01% -0.90% -1.84% 5.97% 0.11% 10.47% 12.87% 0.11% -0.66% 2.58% 33.31% 1989 0.97% -3.02% 11.08% 2.98% 6.55% 1.79% 6.16% -0.70% 2.63% 1.55% -1.68% 7.00% 40.41% 1988 -9.94% 5.32% -1.78% -2.18% 7.20% 18.91% -11.31% 10.19% 2.54% -1.49% 1.32% -0.72% 15.35%
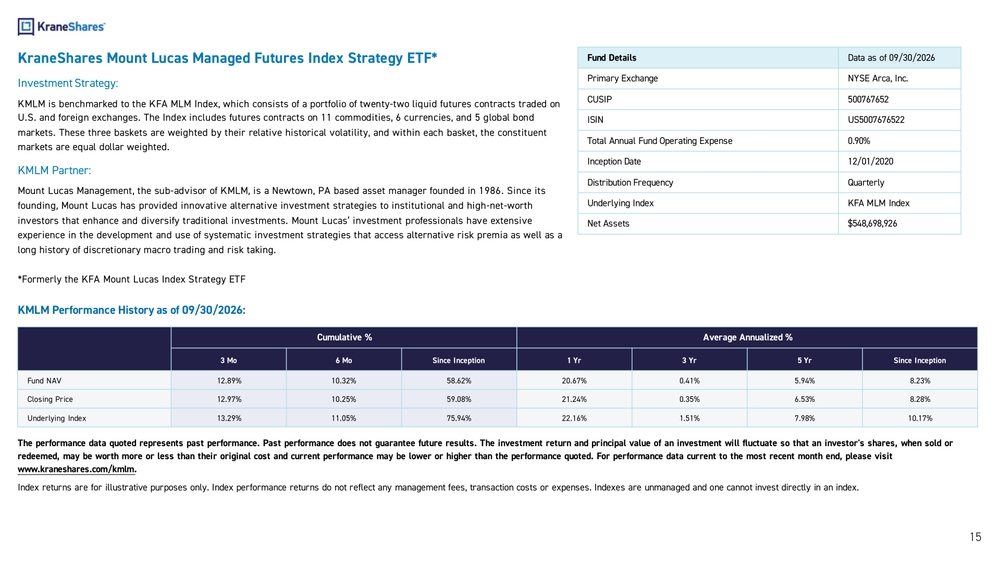
KraneShares Mount Lucas Managed Futures Index Strategy ETF* Investment Strategy: KMLM isbenchmarked totheKFA MLM Index, which consists ofaportfolio oftwenty -twoliquid futures contracts traded on U.S. andforeign exchanges. TheIndex includes futures contracts on11commodities, 6currencies, and5global bond markets. These three baskets are weighted by their relative historical volatility, andwithin each basket, the constituent markets are equal dollar weighted. KMLM Partner: Mount Lucas Management, thesub-advisor ofKMLM, isaNewtown, PAbased asset manager founded in1986. Since its founding, Mount Lucas hasprovided innovative alternative investment strategies toinstitutional andhigh- net-worth investors that enhance anddiversify traditional investments. Mount Lucas’ investment professionals have extensive experience inthe development anduseofsystematic investment strategies that access alternative riskpremia aswell asa long history of discretionary macro trading andrisktaking. *Formerly theKFA Mount Lucas Index Strategy ETF KMLM Performance History asof09/30/2026:Fund Details Data asof09/30/2026 Primary Exchange NYSE Arca, Inc. CUSIP 500767652 ISIN US5007676522 Total Annual Fund Operating Expense 0.90% Inception Date 12/01/2020 Distribution Frequency Quarterly Underlying Index KFA MLM Index Net Assets $548,698,926 Cumulative % Average Annualized % 3Mo 6Mo Since Inception 1Yr 3Yr 5Yr Since Inception Fund NAV 12.89% 10.32% 58.62% 20.67% 0.41% 5.94% 8.23% Closing Price 12.97% 10.25% 59.08% 21.24% 0.35% 6.53% 8.28% Underlying Index 13.29% 11.05% 75.94% 22.16% 1.51% 7.98% 10.17% Theperformance data quoted represents past performance. Past performance does notguarantee future results. Theinvestment return andprincipal value ofaninvestment willfluctuate sothat aninvestor 'sshares, when sold or redeemed, may beworth more orless than their original cost andcurrent performance may belower orhigher than theperformance quoted. Forperformance data current tothemost recent month end, please visit www.kraneshares.com/kmlm. Index returns areforillustrative purposes only. Index performance returns donotreflect anymanagement fees, transaction costs orexpenses. Indexes areunmanaged andonecannot invest directly inanindex. 15
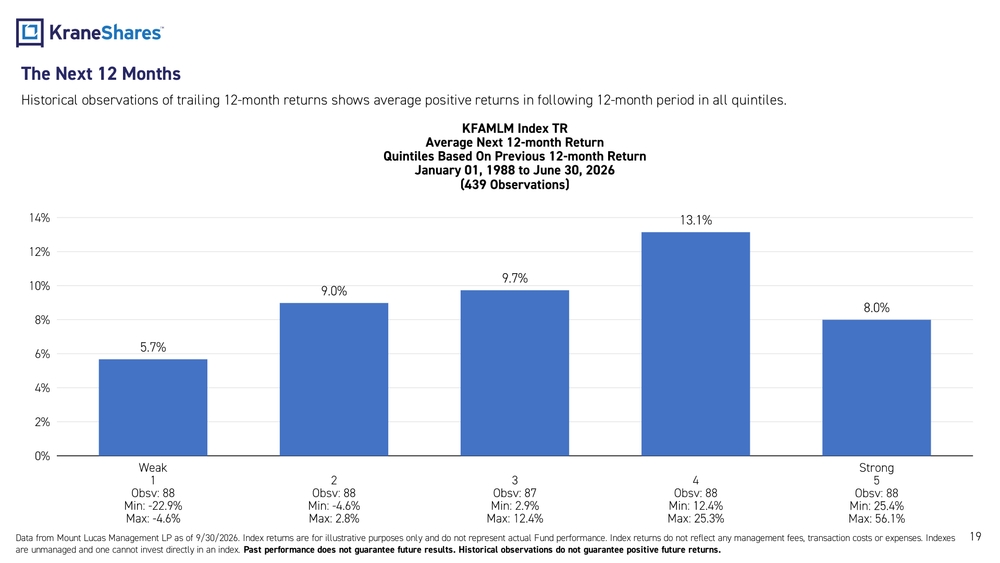
Holdings andExposures oftheKraneShares Mount Lucas Managed Futures Index Strategy ETF Commodity Exposures asof09/30/2026 Identifier Position %NAV GASOLINE RBOB FUT DEC26 XBZ6 Long 7.74% NYHARB ULSD FUT DEC26 HOZ6 Long 7.69% WTICRUDE FUTURE DEC26 CLZ6 Long 7.49% LIVE CATTLE FUTR DEC26 LCZ6 Short 7.21% SOYBEAN FUTURE NOV26 SX6 Long 6.98% SUGAR #11(WORLD) MAR27 SBH7 Long 6.88% COPPER FUTURE DEC26 HGZ6 Long 6.88% NATURAL GAS FUTR DEC26 NGZ26 Short 6.66% CORN FUTURE DEC26 CZ6 Long 6.47% WHEAT FUTURE(CBT) DEC26 WZ6 Long 6.07% GOLD 100 OZ FUTR DEC26 GCZ6 Short 5.88%Currency Exposures asof09/30/2026 Identifier Position %NAV EURO FXCURR FUT DEC26 ECZ6 Short 16.13% C$CURRENCY FUT DEC26 CDZ6 Short 16.11% AUDUSD CRNCY FUT DEC26 ADZ6 Long 16.07% CHF CURRENCY FUT DEC26 SFZ6 Short 15.98% JPN YEN CURR FUT DEC26 JYZ6 Short 8.8% BPCURRENCY FUT DEC26 BPZ6 Long 0.77% Fixed Income Exposures as of 09/30/2026 Identifier Position %NAV JPN 10Y BOND(OSE) DEC26 JBZ6 Short 26.24% US 10YR ULTRA FUT DEC26 UXYZ6 Short 24.93% EURO -BUND FUTURE DEC26 RXZ6 Short 24.83% LONG GILT FUTURE DEC26 GZ6 Short 24.82% CAN 10YR BOND FUT DEC26 CNZ6 Short 23.44% Collateral andCurrency Management asof09/30/2026 Identifier Position Current Exposure($) %NAV Cash USD 176,492,581 176,492,581 32.17% B 10/29/26 US912797SK41 80,000,000 79,760,486 14.54% B 12/01/26 US912797VZ72 80,000,000 79,458,008 14.48% B 11/03/26 US912797VP90 75,000,000 74,732,270 13.62% B 10/20/26 US912797VM69 70,000,000 69,857,801 12.73% B 11/17/26 US912797VX25 70,000,000 69,639,140 12.69% BRITISH STERLING POUND GBP 2,708,814 3,591,496 0.65% CANADIAN DOLLAR CAD 3,782,867 2,658,094 0.48% EURO EUR 1,902,698 2,154,714 0.39% JAPANESE YEN JPY 190,129,680 1,207,748 0.22% 559,552,336 102% Holdings, futures, and collateral are subject to change. 16
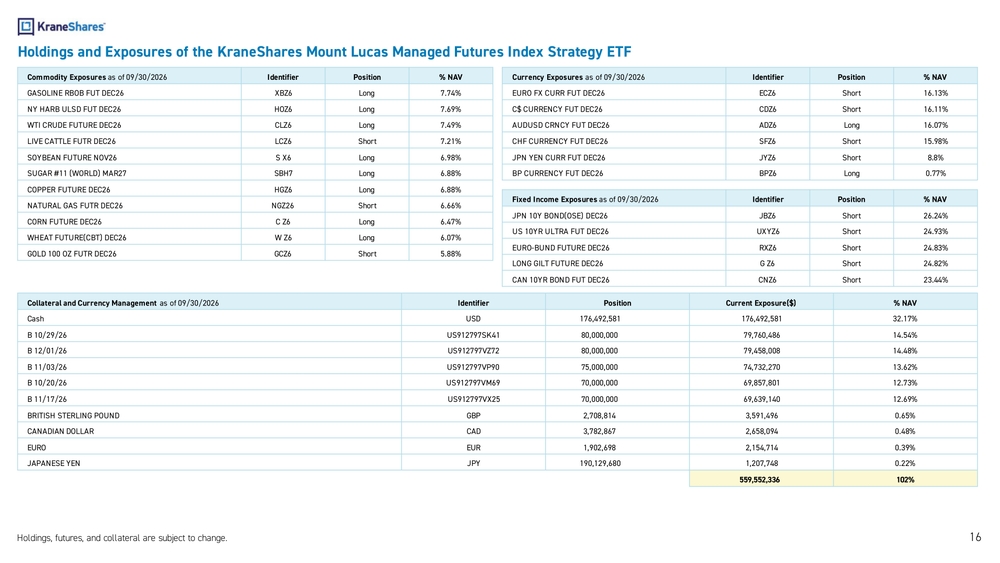
17KFA MLM Index Performance Separating the performance by distinct decades gives another way to look at asset classes and the macro environment. Data from Bloomberg and Mount Lucas from 1/1/1988 to 12/31/2025. Index returns are for illustrative purposes only and do not represent actual Fund performance. Indexes are unmanaged and one cannot invest directly in an index. Index returns do not reflect fees or other costs associated with investing. The above chart is purely hypo thetical and is not meant to inform any investment decision. Past performance does not guarantee future returns. Stocks = S&P 500 Index. Bonds = Bloomberg Barclays US Aggregate Bond Index. See the end of the pres entation for index and term definitions.1988 - 1989 1990 - 1999 2000 - 2009 2010 - 2019 2020 - 2025 2022 Full Sample KFA MLM Index 27.3% 14.1% 8.7% 0.6% 6.7% 36.7% 8.5% KFA MLM Index Realized Volatility 22.3% 16.6% 19.4% 12.1% 13.3% 20.2% 16.3% Correlation vs. 60/40 0.21 -0.28 -0.31 -0.13 -0.55 -0.63 -0.27 Bloomberg US Aggregate 11.2% 7.7% 6.3% 3.7% 0.9% -13.0% 5.4% Bloomberg US Aggregate Realized Volatility 5.1% 3.9% 3.8% 2.9% 6.0% 8.3% 4.2% Correlation vs. 60/40 0.68 0.55 0.14 -0.06 0.66 0.77 0.39 S&P 500 23.9% 18.2% -0.9% 13.6% 15.1% -18.1% 11.5% S&P 500 Realized Volatility 11.2% 13.4% 16.1% 12.5% 17.2% 23.0% 14.6% Correlation vs. 60/40 0.98 0.99 0.99 0.99 0.98 0.99 0.98 60/40 S&P 500 - US Agg 18.8% 14.1% 2.3% 9.8% 9.5% -15.8% 9.3% 60/40 S&P 500 - US Agg Realized Volatility 8.0% 8.8% 9.8% 7.3% 11.7% 16.2% 9.3%
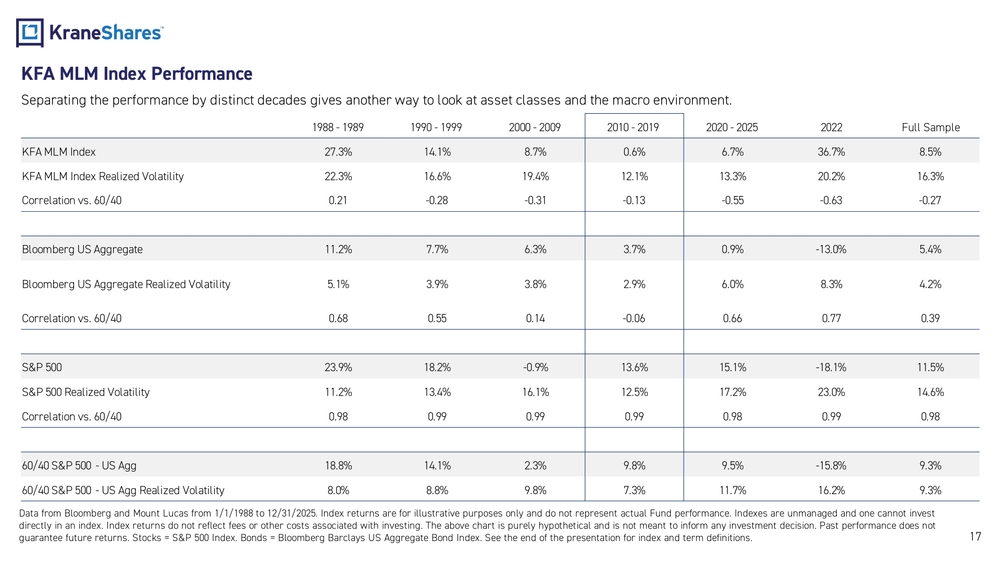
18Data from Mount Lucas Management LP as of 9/30/2026 and Morningstar. Managers represent the 6 largest Managed Futures Mutual Funds with at least 5 years of returnsManagers may have different investment objectives and strategies that could affect performance. Index returns are for illustrative purposes only and do not represent actual Fund performance. Inde x returns do not reflect management fees, transaction costs, or expenses. Indexes are unmanaged, and one cannot invest directly in an index. Past performance does not guarantee future results. Please see end of presentation for index def initions. Managed Futures Beta The KFA MLM Index was created in 1988 to represent the returns to investors in managed futures. This “beta” is the risk premium earned by investors in the futures markets who accept price risk from commercial participants who do not want to own that risk.
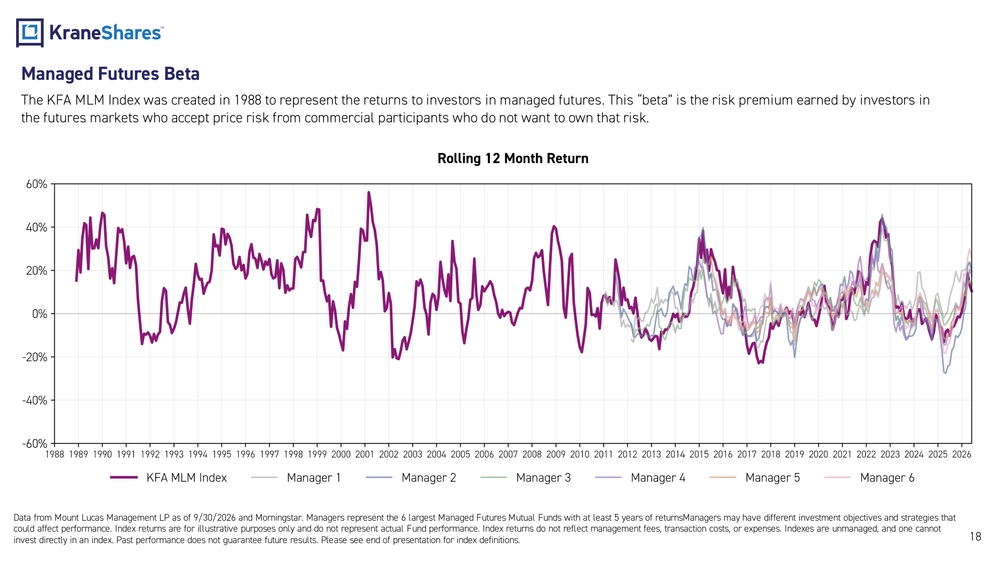
19 Data from Mount Lucas Management LP as of 9/30/2026. Index returns are for illustrative purposes only and do not represent actual Fund performance. Index returns do not reflect any management fees, transaction costs or expenses. Indexes are unmanaged and one cannot invest directly in an index. Past performance does not guarantee future results. Historical observations do not guarantee positive future returns.Historical observations of trailing 12- month returns shows average positive returns in following 12- month period in all quintile s.The Next 12 Months
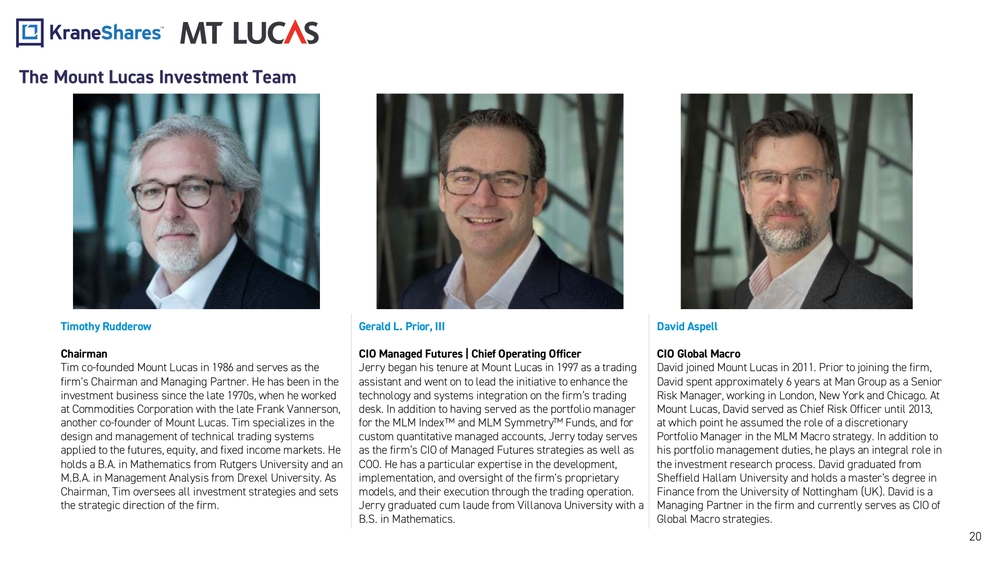
20The Mount Lucas Investment Team Timothy Rudderow Chairman Tim co -founded Mount Lucas in 1986 and serves as the firm's Chairman and Managing Partner. He has been in the investment business since the late 1970s, when he worked at Commodities Corporation with the late Frank Vannerson, another co -founder of Mount Lucas. Tim specializes in the design and management of technical trading systems applied to the futures, equity, and fixed income markets. He holds a B.A. in Mathematics from Rutgers University and an M.B.A. in Management Analysis from Drexel University. As Chairman, Tim oversees all investment strategies and sets the strategic direction of the firm.Gerald L. Prior, III CIO Managed Futures | Chief Operating Officer Jerry began his tenure at Mount Lucas in 1997 as a trading assistant and went on to lead the initiative to enhance the technology and systems integration on the firm’s trading desk. In addition to having served as the portfolio manager for the MLM Index and MLM Symmetry Funds, and for custom quantitative managed accounts, Jerry today serves as the firm’s CIO of Managed Futures strategies as well as COO. He has a particular expertise in the development, implementation, and oversight of the firm's proprietary models, and their execution through the trading operation. Jerry graduated cum laude from Villanova University with a B.S. in Mathematics.David Aspell CIO Global Macro David joined Mount Lucas in 2011. Prior to joining the firm, David spent approximately 6 years at Man Group as a Senior Risk Manager, working in London, New York and Chicago. At Mount Lucas, David served as Chief Risk Officer until 2013, at which point he assumed the role of a discretionary Portfolio Manager in the MLM Macro strategy. In addition to his portfolio management duties, he plays an integral role in the investment research process. David graduated from Sheffield Hallam University and holds a master’s degree in Finance from the University of Nottingham (UK). David is a Managing Partner in the firm and currently serves as CIO of Global Macro strategies.
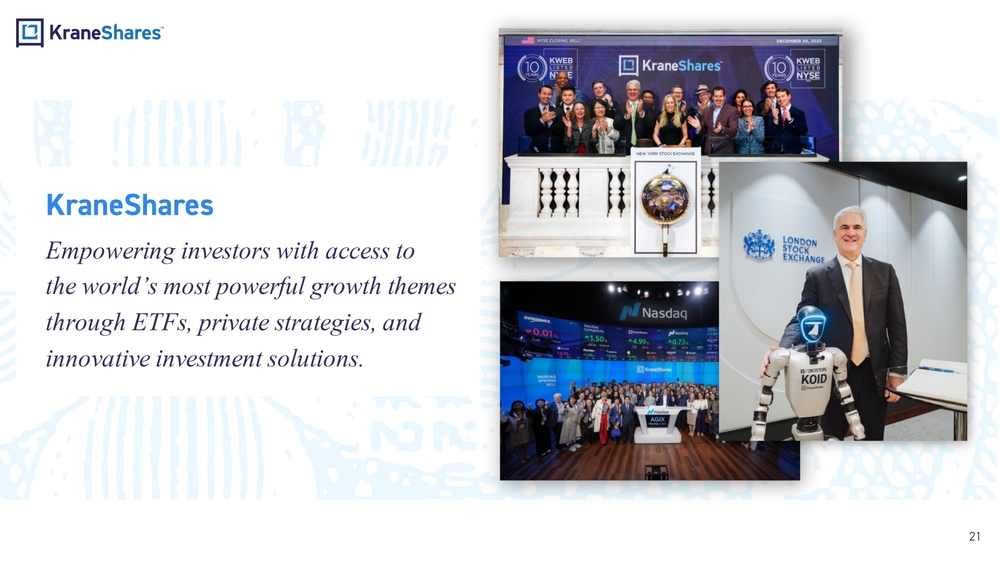
KraneShares Empowering investors with access to the world’ s most powerful growth themes through ETFs, private strategies, and innovative investment solutions. 21
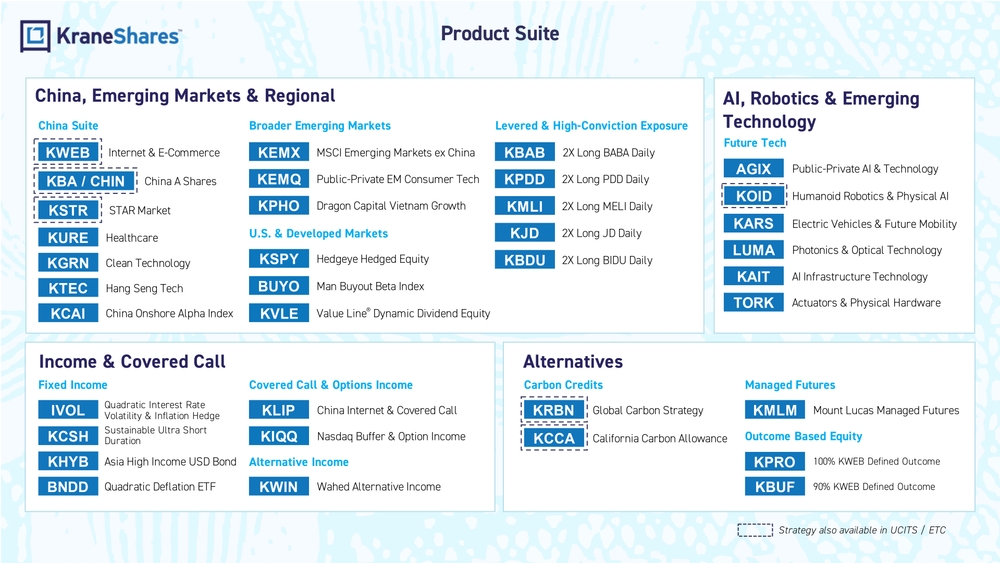
China, Emerging Markets & Regional Alternatives Income & Covered Call AI, Robotics & Emerging Technology KURE Healthcare KGRN Clean Technology KTEC Hang Seng Tech KCAI China Onshore Alpha IndexAGIX Public -Private AI & TechnologyChina Suite Future TechBroader Emerging Markets KEMQ Public -Private EM Consumer Tech KPHO Dragon Capital Vietnam GrowthKEMX MSCI Emerging Markets ex China U.S. & Developed Markets KVLE Value Line® Dynamic Dividend EquityHedgeye Hedged Equity KSPY Man Buyout Beta Index BUYO Fixed Income BNDD Quadratic Deflation ETFIVOLQuadratic Interest Rate Volatility & Inflation Hedge KHYB Asia High Income USD BondSustainable Ultra Short DurationKCSHCarbon CreditsKPDD 2X Long PDD Daily KJD 2X Long JD DailyKBAB 2X Long BABA Daily KMLI 2X Long MELI Daily Covered Call & Options Income Managed Futures KMLM Mount Lucas Managed Futures KWIN Wahed Alternative IncomeKLIP China Internet & Covered Call Outcome Based Equity KIQQ Nasdaq Buffer & Option IncomeLevered & High- Conviction Exposure KBUF 90% KWEB Defined Outcome100% KWEB Defined Outcome KPRO Alternative Income Product Suite KWEB Internet & E -Commerce KOID Humanoid Robotics & Physical AI Strategy also available in UCITS / ETCKBDU 2X Long BIDU DailyChina A Shares KBA / CHIN KSTR STAR Market Global Carbon Strategy KRBN KCCA California Carbon AllowanceElectric Vehicles & Future Mobility KARS LUMA Photonics & Optical Technology KAIT AI Infrastructure Technology TORK Actuators & Physical Hardware
23Index Definitions: S&P 500 Index: The S&P 500 Index is widely regarded as the best single gauge of large -cap U.S. equities. There is over USD 9.9 trillion indexed or benchmarked to the index, with indexed assets comprising approximately USD 3.4 trillion of this total. The index includes 500 leading companies and covers approximately 80 % of available market capitalization. The index was launched on March 4, 1957.KFA MLM Index (“KMLM’s Index”): The KFA MLM Index is a diversified trend following portfolio of commodity, currency, and glob al fixed income futures contracts traded on US and foreign exchanges. The performance data for the index is a representation of the MLM Index from 1/1/1988 to 12/31/2004, the MLM Index EV (“EV”), with enhanced Execution and Volatility characteristics, from 1/1/2005 to 11/30/2020, and, using the same methodology as the “EV,” the KFA MLM Index from 12/1/2020 on. Bloomberg Barclays US Aggregate Bond Total Return Index (“US Aggregate Bond Index”: Bloomberg Barclays US Aggregate Bond Index: The Bloomberg Barclays US Aggregate Bond Index is a broad - based flagship benchmark that measures the investment grade, US dollar -denominated, fixed -rate, taxable bond market in the Unite d States. The index includes Treasuries, government- related, and corporate securities. The index was launched on January 1, 1976 . Term Definitions: Volatility: the degree of variation of a trading price series over time as measured by the standard deviation of returns. Sta ndard deviation is a quantity calculated to indicate the extent of deviation for a group. A low standard deviation indicates that the data points tend to be close to the mean (also called the expected value) of the set, while a high standard deviation indicates that the data points are spread out over a wider range of values. Maximum Drawdown: the measure of decline from a historical peak in some variable, typically the price of a security or index.Declining Market Period: For the purposes of this presentation, a declining market period is defined as a when securities pri ces fall by 10% or more within some broad market benchmark. Synthetic Price: A price benchmark that has been created using futures or other types of derivatives to replicate the actual price performance of an asset. Price Risk: The risk of a decline in the value of a security or an investment portfolio excluding a downturn in the market, due to multiple factors. Portfolio Risk: The risk that the combination of assets or units, within the investments that you own, fail to meet financial objectives. Counter -Party Risk: The likelihood or probability that one of those involved in a transaction might default on its contractual o bligation.
Important Notes Carefully consider theFunds’ investment objectives, riskfactors, charges andexpenses before investing. This andadditional information can befound intheFunds' fullandsummary prospectus, which may beobtained byvisiting www. kraneshares .com /kmlm. Read theprospectus carefully before investing. Risk Disclosures: Investing involves risk, including possible loss of principal. There can be no assurance that a Fund will achieve its stated objectives. Indices are unmanaged and do not include the effect of fees. One cannot invest directly in an index. This information should not be relied upon as research, investment advice, or a recommendation regarding any products, strategie s, or any security in particular . This material is strictly for illustrative, educational, or informational purposes and is subject to change. Certain content represents an assessment of the market environment at a specific time and is not intended to be a for ecast of future events or a guarantee of future results; material is as of the dates noted and is subject to change without noti ce. KMLM may invest in derivatives, which are often more volatile than other investments and may magnify KMLM’s gains or losses. A derivative (i.e., futures/forward contracts, swaps, and options) is a contract that derives its value from the performance of an underlying asset. The primary risk of derivatives is that changes in the asset’s market value and the derivative may not be p roportionate, and some derivatives can have the potential for unlimited losses. Derivatives are also subject to liquidity and co unterparty risk. KMLM is subject to liquidity risk, meaning that certain investments may become difficult to purchase or sell at a reaso nable time and price. If a transaction for these securities is large, it may not be possible to initiate, which may cause KMLM t o suffer losses. Counterparty risk is the risk of loss in the event that the counterparty to an agreement fails to make required payments or otherwise comply with the terms of the derivative. Fluctuations in currency of foreign countries may have an adverse effect to domestic currency values. The use of futures contracts is subject to special risk considerations. The primary risks associated with the use of futures con tracts include: (a) an imperfect correlation between the change in market value of the reference asset and the price of the f utures contract; (b) possible lack of a liquid secondary market for a futures contract and the resulting inability to close a futures c ontract when desired; (c) losses caused by unanticipated market movements, which are potentially unlimited; (d) the inability to predict correctly the direction of market prices, interest rates, currency exchange rates and other economic factors; and (e) if KMLM has insufficient cash, it may have to sell securities or financial instruments from its portfolio to meet daily variation margi n requirements, which may lead to KMLM selling securities or financial instruments at a loss. KMLM invests through a subsidiary, and is indirectly exposed to the risks associated with the Subsidiary’s investments. Since the Subsidiary is organized under the law of the Cayman Islands and is not registered with the SEC under the Investment Company Act of 1940, as such KMLM will not receive all of the protections offered to shareholders of registered investment companies. KMLM and the Subsidiary will be considered commod ity pools upon commencement of operations, and each will be subject to regulation under the Commodity Exchange Act and CFTC rules. Commodity pools are subject to additional laws, regulations and enforcement policies, which may increase compliance costs and may affect the operations and performance of KMLM and the Subsidiary. Futures and other contracts may have to be liquidated at disadvantageous times or prices to prevent KMLM from exceeding any a pplicable position limits established by the CFTC. The value of a commodity -linked derivative investment typically is based upon the price movements of a physical commodity and may be affected by changes in overall market movements, volatility of the Index, changes in interest rates, or factors affecting a particular industry or commodity. KMLM is subject to interest rate risk, which is the chance that bonds will decline in value as interest rates rise.Narrowly focused investments typically exhibit higher volatility. KMLM’s assets are expected to be concentrated in a sector, industry, market, or group of concentrations to the extent that the Underlying Index has such concentrations. The securities or futures in that concentration could react similarly to market developments. Thus, KMLM is subject to loss due to adverse occurrences tha t affect that concentration (R_US_KS_SEI) 24