EM ETF | KEMX: Emerging Markets ex China Index ETF
by Kraneshares
Customizing China Exposure within Emerging Market Portfolios
An Overview of the KraneShares MSCI Emerging Markets ex China ETF (Ticker: KEMX)
KEMX info@kraneshares.com 12/31/2025
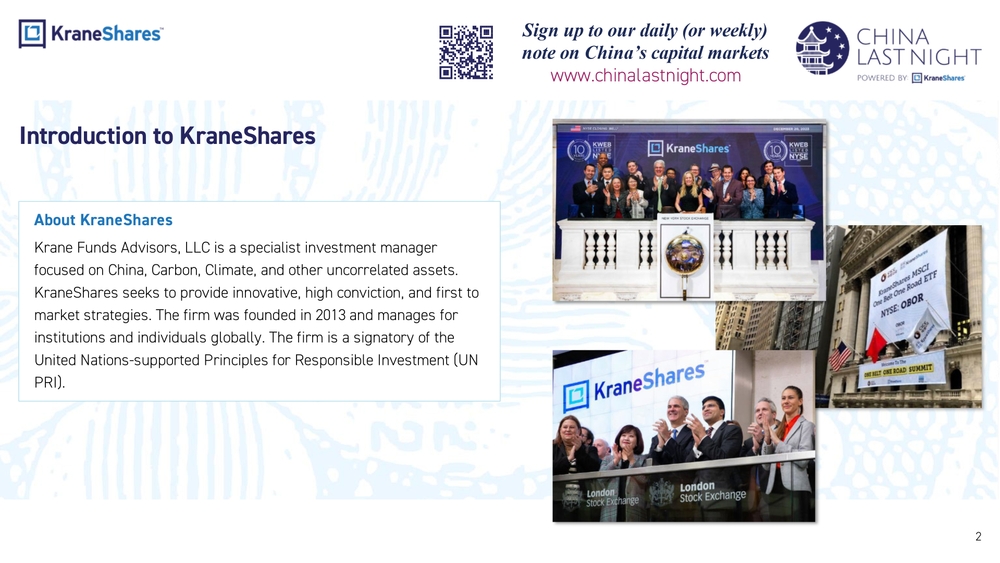
Introduction to KraneShares
Sign up to our daily (or weekly) note on China's capital markets www.chinalastnight.com
About KraneShares
Krane Funds Advisors, LLC is a specialist investment manager focused on China, Carbon, Climate, and other uncorrelated assets. KraneShares seeks to provide innovative, high conviction, and first to market strategies. The firm was founded in 2013 and manages for institutions and individuals globally. The firm is a signatory of the United Nations-supported Principles for Responsible Investment (UN PRI).
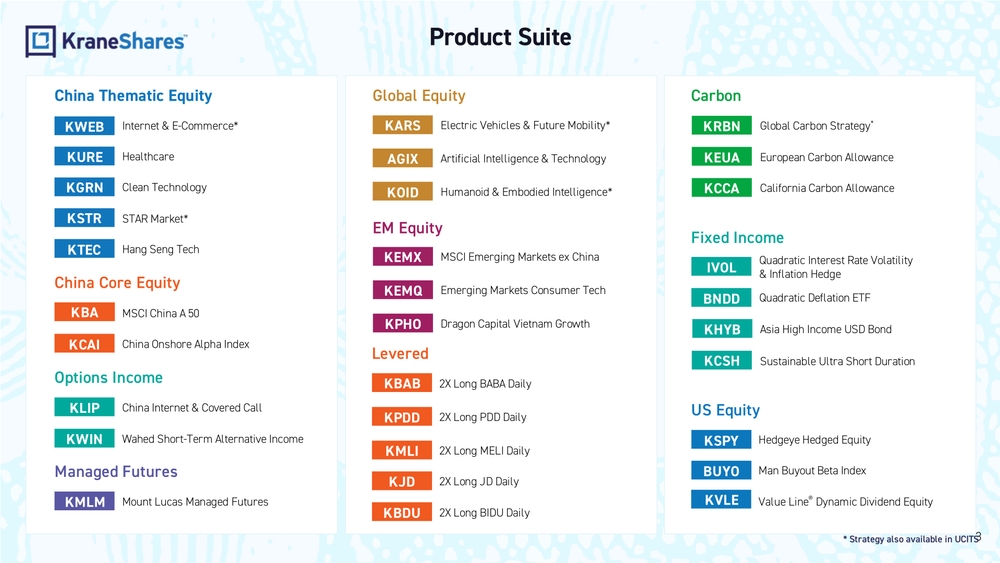
Product Suite
China Thematic Equity
- KWEB - Internet & E-Commerce*
- KURE - Healthcare
- KGRN - Clean Technology
- KSTR - STAR Market*
- KTEC - Hang Seng Tech
China Core Equity
- KBA - MSCI China A 50
- KCAI - China Onshore Alpha Index
Options Income
- KLIP - China Internet & Covered Call
- KWIN - Wahed Short-Term Alternative Income
Managed Futures
- KMLM - Mount Lucas Managed Futures
Global Equity
- KARS - Electric Vehicles & Future Mobility*
- AGIX - Artificial Intelligence & Technology
- KOID - Humanoid & Embodied Intelligence*
EM Equity
- KEMX - MSCI Emerging Markets ex China
- KEMQ - Emerging Markets Consumer Tech
- KPHO - Dragon Capital Vietnam Growth
Levered
- KBAB - 2X Long BABA Daily
- KPDD - 2X Long PDD Daily
- KMLI - 2X Long MELI Daily
- KJD - 2X Long JD Daily
- KBDU - 2X Long BIDU Daily
Carbon
- KRBN - Global Carbon Strategy*
- KEUA - European Carbon Allowance
- KCCA - California Carbon Allowance
Fixed Income
- IVOL - Quadratic Interest Rate Volatility & Inflation Hedge
- BNDD - Quadratic Deflation ETF
- KHYB - Asia High Income USD Bond
- KCSH - Sustainable Ultra Short Duration
US Equity
- KSPY - Hedgeye Hedged Equity
- BUYO - Man Buyout Beta Index
- KVLE - Value Line® Dynamic Dividend Equity
*Strategy also available in UCITS
Investment Strategy:
KEMX is benchmarked to the MSCI Emerging Markets ex China Index, which tracks large-cap and mid-cap companies within emerging market countries, excluding China. KEMX enables investors to build tailored Emerging Market (EM) portfolios when combined with exposure to China. KEMX can be paired with KraneShares' China-focused funds to establish strategic positions in China without duplicating exposures.
KEMX Features:
- Exposure to large-cap and mid-cap companies within emerging market countries, excluding China
- Benchmarked to MSCI, a global leader in international indexing
By pairing KEMX with other KraneShares China-focused funds, including the below, investors can make strategic allocations to China.
- Offshore China (Growth): The KraneShares CSI China Internet ETF (Ticker: KWEB)
- Onshore China (Growth & Value): The KraneShares Bosera MSCI China A 50 Connect Index ETF (Ticker: KBA)
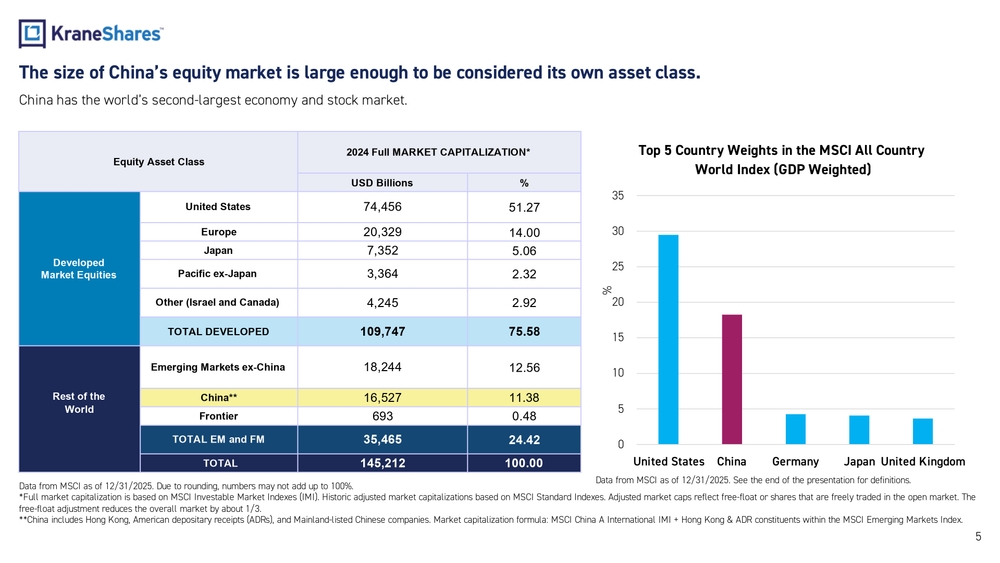
The size of China's equity market is large enough to be considered its own asset class.
China has the world's second-largest economy and stock market.
Equity Asset Class
| 2024 Full MARKET CAPITALIZATION* | ||
|---|---|---|
| USD Billions | % | |
| Developed Market Equities | ||
| United States | 74,456 | 51.27 |
| Europe | 20,329 | 14.00 |
| Japan | 7,352 | 5.06 |
| Pacific ex-Japan | 3,364 | 2.32 |
| Other (Israel and Canada) | 4,245 | 2.92 |
| TOTAL DEVELOPED | 109,747 | 75.58 |
| Rest of the World | ||
| Emerging Markets ex-China | 18,244 | 12.56 |
| China** | 16,527 | 11.38 |
| Frontier | 693 | 0.48 |
| TOTAL EM and FM | 35,465 | 24.42 |
| TOTAL | 145,212 | 100.00 |
Data from MSCI as of 12/31/2025. Due to rounding, numbers may not add up to 100%.
*Full market capitalization is based on MSCI Investable Market Indexes (IMI). Historic adjusted market capitalizations based on MSCI Standard Indexes. Adjusted market caps reflect free-float or shares that are freely traded in the open market. The free-float adjustment reduces the overall market by about 1/3.
**China includes Hong Kong, American depositary receipts (ADRs), and Mainland-listed Chinese companies. Market capitalization formula: MSCI China A International IMI + Hong Kong & ADR constituents within the MSCI Emerging Markets Index.
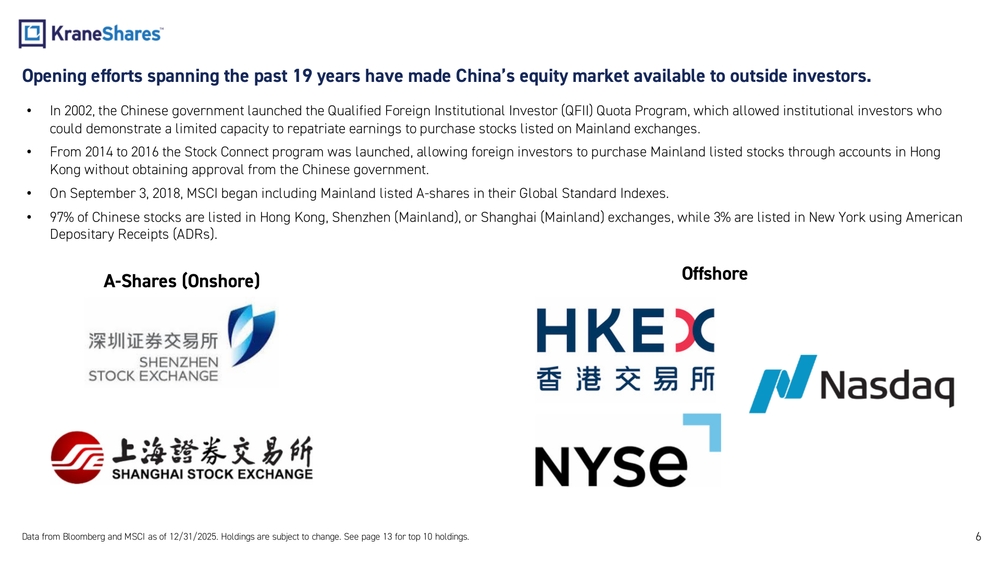
Opening efforts spanning the past 19 years have made China's equity market available to outside investors.
-
In 2002, the Chinese government launched the Qualified Foreign Institutional Investor (QFII) Quota Program, which allowed institutional investors who could demonstrate a limited capacity to repatriate earnings to purchase stocks listed on Mainland exchanges.
-
From 2014 to 2016 the Stock Connect program was launched, allowing foreign investors to purchase Mainland listed stocks through accounts in Hong Kong without obtaining approval from the Chinese government.
-
On September 3, 2018, MSCI began including Mainland listed A-shares in their Global Standard Indexes.
-
97% of Chinese stocks are listed in Hong Kong, Shenzhen (Mainland), or Shanghai (Mainland) exchanges, while 3% are listed in New York using American Depositary Receipts (ADRs).
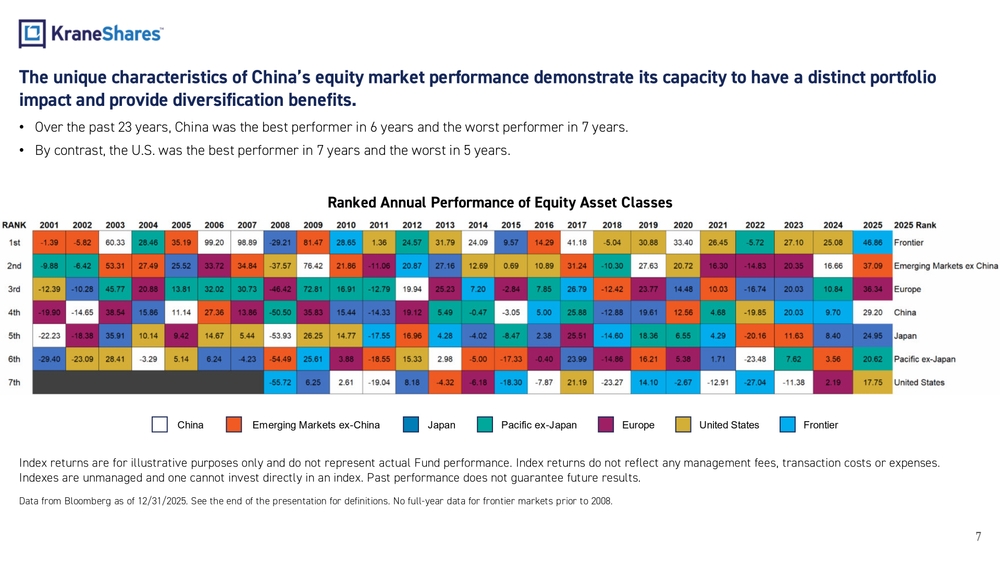
The unique characteristics of China's equity market performance demonstrate its capacity to have a distinct portfolio impact and provide diversification benefits.
- Over the past 23 years, China was the best performer in 6 years and the worst performer in 7 years.
- By contrast, the U.S. was the best performer in 7 years and the worst in 5 years.
Ranked Annual Performance of Equity Asset Classes
[Table showing ranked annual performance of equity asset classes from 2001-2025, with color-coded cells indicating performance ranking for China, Emerging Markets ex-China, Japan, Pacific ex-Japan, Europe, United States, and Frontier markets]
Index returns are for illustrative purposes only and do not represent actual Fund performance. Index returns do not reflect any management fees, transaction costs or expenses. Indexes are unmanaged and one cannot invest directly in an index. Past performance does not guarantee future results.
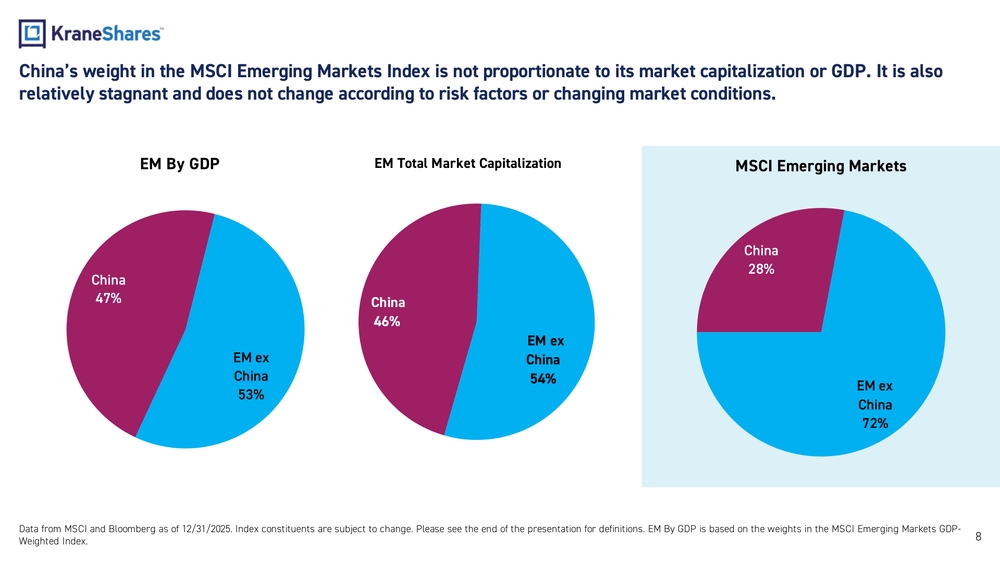
China's weight in the MSCI Emerging Markets Index is not proportionate to its market capitalization or GDP. It is also relatively stagnant and does not change according to risk factors or changing market conditions.
[Three pie charts showing:
- EM By GDP: China 47%, EM ex China 53%
- EM Total Market Capitalization: China 46%, EM ex China 54%
- MSCI Emerging Markets: China 28%, EM ex China 72%]
Data from MSCI and Bloomberg as of 12/31/2025. Index constituents are subject to change. EM By GDP is based on the weights in the MSCI Emerging Markets GDP-Weighted Index.
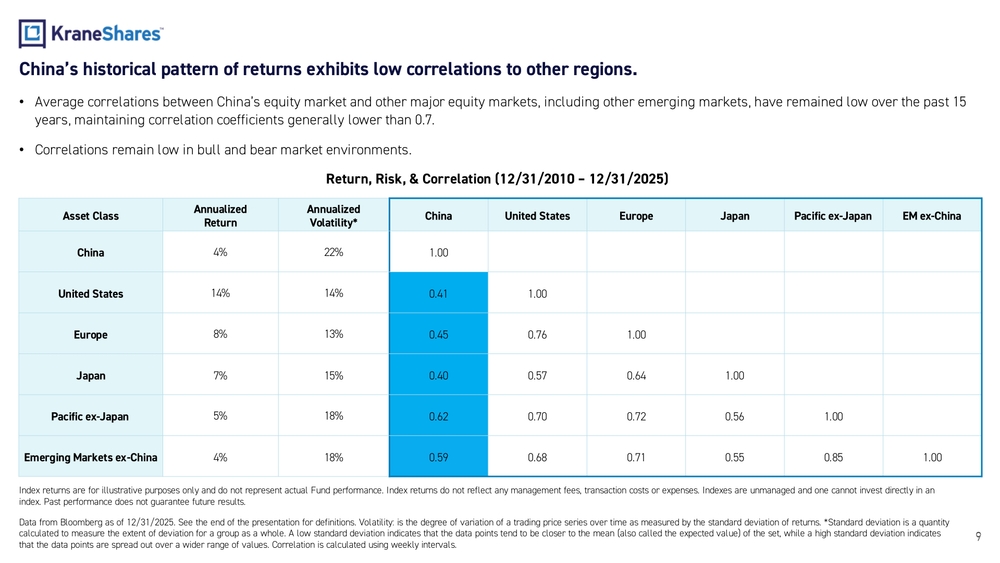
China's historical pattern of returns exhibits low correlations to other regions.
-
Average correlations between China's equity market and other major equity markets, including other emerging markets, have remained low over the past 15 years, maintaining correlation coefficients generally lower than 0.7.
-
Correlations remain low in bull and bear market environments.
Return, Risk, & Correlation (12/31/2010 – 12/31/2025)
| Asset Class | Annualized Return | Annualized Volatility* | China | United States | Europe | Japan | Pacific ex-Japan | EM ex-China |
|---|---|---|---|---|---|---|---|---|
| China | 4% | 22% | 1.00 | |||||
| United States | 14% | 14% | 0.41 | 1.00 | ||||
| Europe | 8% | 13% | 0.45 | 0.76 | 1.00 | |||
| Japan | 7% | 15% | 0.40 | 0.57 | 0.64 | 1.00 | ||
| Pacific ex-Japan | 5% | 18% | 0.62 | 0.70 | 0.72 | 0.56 | 1.00 | |
| Emerging Markets ex-China | 4% | 18% | 0.59 | 0.68 | 0.71 | 0.55 | 0.85 | 1.00 |
Index returns are for illustrative purposes only and do not represent actual Fund performance. Index returns do not reflect any management fees, transaction costs or expenses. Indexes are unmanaged and one cannot invest directly in an index. Past performance does not guarantee future results.
Data from Bloomberg as of 12/31/2025. Volatility: is the degree of variation of a trading price series over time as measured by the standard deviation of returns. *Standard deviation is a quantity calculated to measure the extent of deviation for a group as a whole. Correlation is calculated using weekly intervals.
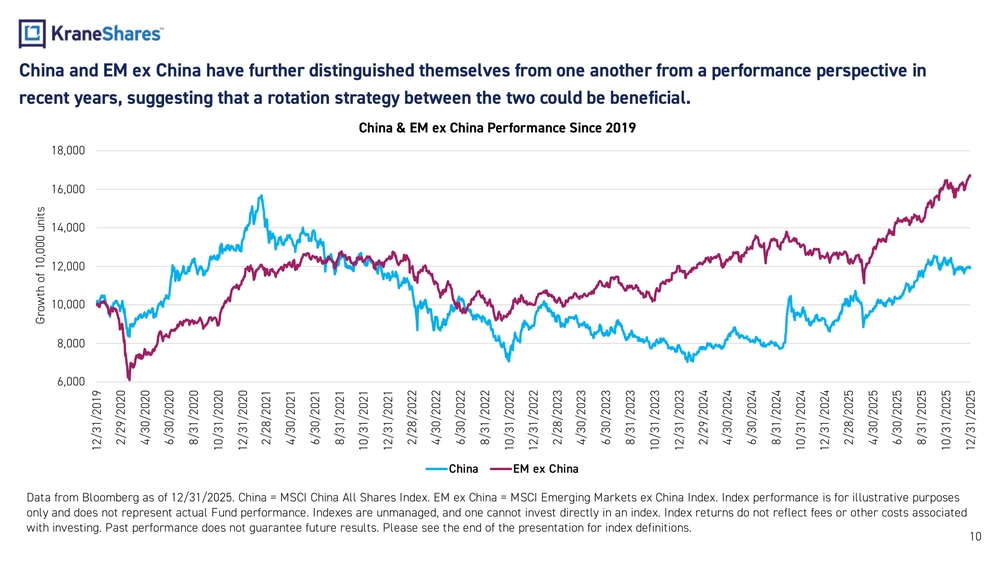
China and EM ex China have further distinguished themselves from one another from a performance perspective in recent years, suggesting that a rotation strategy between the two could be beneficial.
[Chart showing growth of 10,000 units invested in China vs. EM ex China from 12/31/2019 to 12/31/2025, with performance lines showing divergent performance patterns between the two markets]
Data from Bloomberg as of 12/31/2025. China = MSCI China All Shares Index. EM ex China = MSCI Emerging Markets ex China Index. Index performance is for illustrative purposes only and does not represent actual Fund performance. Indexes are unmanaged, and one cannot invest directly in an index. Index returns do not reflect fees or other costs associated with investing. Past performance does not guarantee future results.
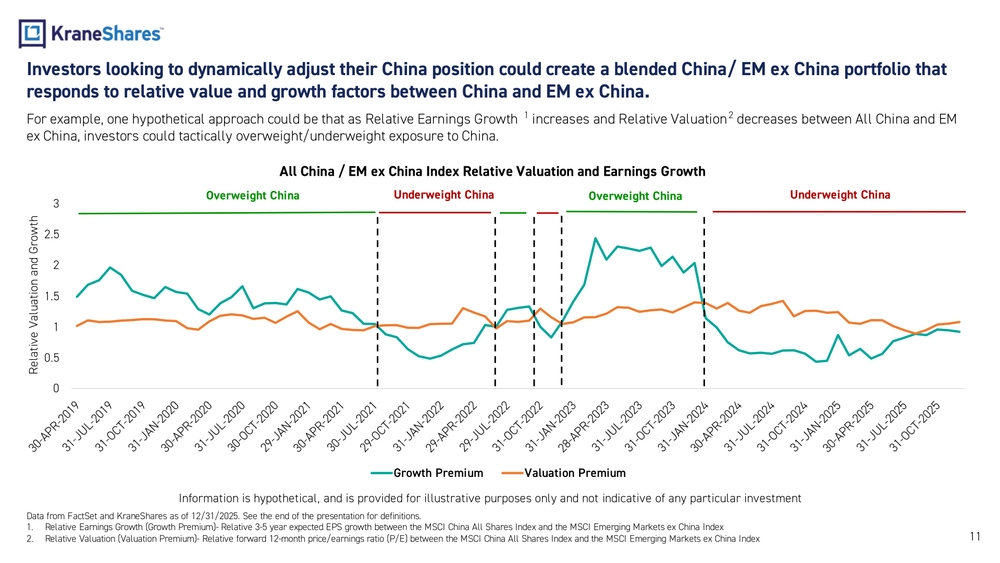
Relative Valuation and Growth
![Chart showing Growth Premium and Valuation Premium between China and EM ex China markets from 2019-2025]
Investors looking to dynamically adjust their China position could create a blended China/ EM ex China portfolio that responds to relative value and growth factors between China and EM ex China.
For example, one hypothetical approach could be that as Relative Earnings Growth increases and Relative Valuation decreases between All China and EM ex China, investors could tactically overweight/underweight exposure to China.
All China / EM ex China Index Relative Valuation and Earnings Growth
Information is hypothetical, and is provided for illustrative purposes only and not indicative of any particular investment
Data from FactSet and KraneShares as of 12/31/2025. See the end of the presentation for definitions.
- Relative Earnings Growth (Growth Premium)- Relative 3-5 year expected EPS growth between the MSCI China All Shares Index and the MSCI Emerging Markets ex China Index
- Relative Valuation (Valuation Premium)- Relative forward 12-month price/earnings ratio (P/E) between the MSCI China All Shares Index and the MSCI Emerging Markets ex China Index
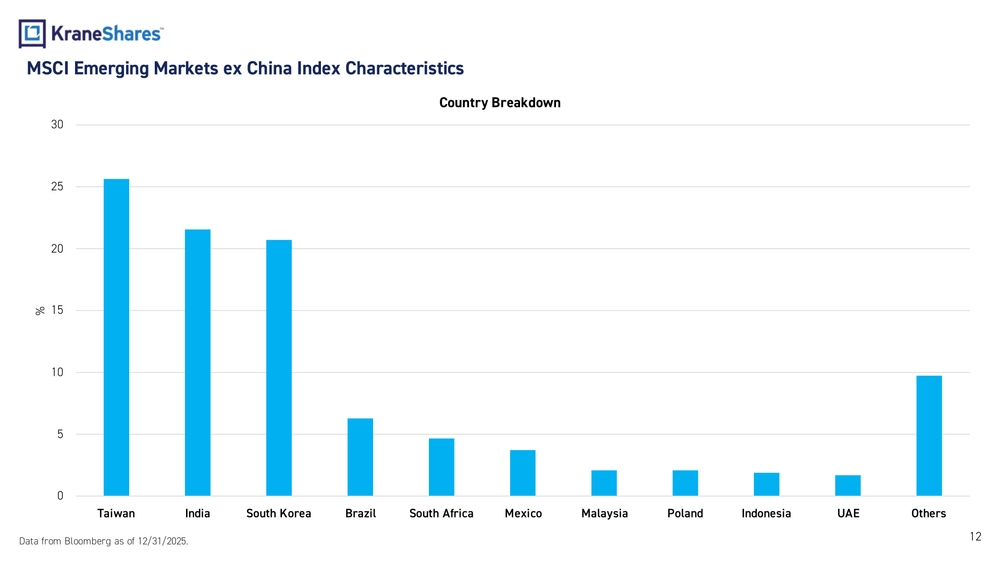
MSCI Emerging Markets ex China Index Characteristics
Country Breakdown
![Bar chart showing country breakdown percentages in the MSCI Emerging Markets ex China Index]
The chart shows the following approximate country allocations:
- Taiwan: ~25%
- India: ~21%
- South Korea: ~20%
- Brazil: ~6%
- South Africa: ~5%
- Mexico: ~4%
- Malaysia: ~2%
- Poland: ~2%
- Indonesia: ~2%
- UAE: ~2%
- Others: ~10%
Data from Bloomberg as of 12/31/2025.
KraneShares MSCI Emerging Markets ex China Index ETF
Investment Strategy:
KEMX is benchmarked to the MSCI Emerging Markets ex China Index, which tracks mid-cap and large-cap companies within emerging market countries, excluding China. KEMX enables investors to build tailored EM portfolios with adjusted exposure to China. KEMX can be paired with KraneShares China-focused core and thematic funds to make a strategic investment in China without duplicating exposures.
KEMX Performance History as of 12/31/2025:
The performance data quoted represents past performance. Past performance does not guarantee future results. The investment return and principal value of an investment will fluctuate so that an investors shares, when sold or redeemed, may be worth more or less than their original cost and current performance may be lower or higher than the performance quoted. For performance data current to the most recent month end, please visit www.kraneshares.com/kemx.
Index returns are for illustrative purposes only. Index performance returns do not reflect any management fees, transaction costs or expenses. Indexes are unmanaged and one cannot invest directly in an index.
Fee waivers are contractual and in effect until August 1, 2026
Fund Details Data as of 12/31/2025
| Primary Exchange | NYSE Arca, Inc. |
| CUSIP | 500767769 |
| ISIN | US5007677694 |
| Total Annual Fund Operating Expense (Gross) | 0.59% |
| Total Annual Fund Operating Expense (Net)* | 0.24% |
| Inception Date | 04/11/2019 |
| Distribution Frequency | Annual |
| Underlying Index | MSCI Emerging Markets ex China Index |
| Net Assets | $70,900,401 |
| Number of Holdings | 300 |
Top 10 Holdings as of 12/31/2025
Holdings are subject to change.
| Holdings | % |
|---|---|
| TAIWAN SEMICONDUCTOR MANUFAC | 15.01 |
| SAMSUNG ELECTRONICS CO LTD | 4.57 |
| S K HYNIX INC | 2.36 |
| RELIANCE INDUSTRIES LIMITED | 1.60 |
| NASPERS LTD-N SHS | 1.50 |
| HDFC BANK LIMITED | 1.39 |
| ICICI BANK LTD | 1.35 |
| INFOSYS LTD-SP ADR | 1.25 |
| MEDIATEK INC | 1.25 |
| HON HAI PRECISION INDUSTRY | 1.23 |
Performance Table
| Cumulative % | Average Annualized % | |||||
|---|---|---|---|---|---|---|
| 3 Mo | 6 Mo | Since Inception | 1 Yr | 3 Yr | 5 Yr | |
| Fund NAV | 11.68% | 19.43% | 85.52% | 37.58% | 19.43% | 8.36% |
| Closing Price | 10.72% | 18.82% | 84.19% | 38.29% | 18.73% | 8.35% |
| Underlying Index | 10.22% | 17.54% | 77.77% | 34.61% | 18.72% | 8.25% |
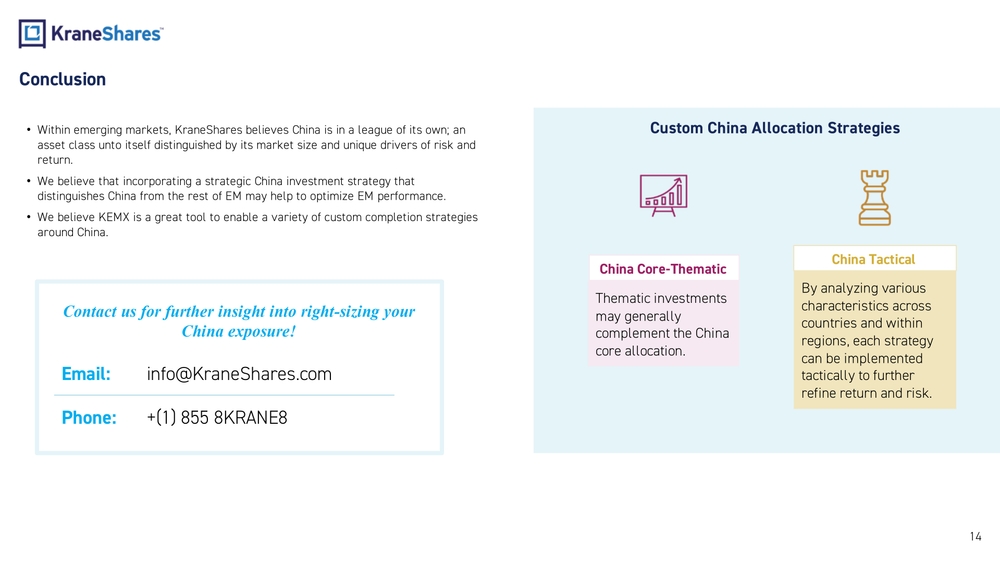
Conclusion
-
Within emerging markets, KraneShares believes China is in a league of its own; an asset class unto itself distinguished by its market size and unique drivers of risk and return.
-
We believe that incorporating a strategic China investment strategy that distinguishes China from the rest of EM may help to optimize EM performance.
-
We believe KEMX is a great tool to enable a variety of custom completion strategies around China.
Custom China Allocation Strategies
China Core-Thematic
Thematic investments may generally complement the China core allocation.
China Tactical
By analyzing various characteristics across countries and within regions, each strategy can be implemented tactically to further refine return and risk.
Contact us for further insight into right-sizing your China exposure!
Email: info@KraneShares.com
Phone: +(1) 855 8KRANE8
Index Definitions:
MSCI ACWI GDP Weighted (USD Gross) Index: This index is based on the flagship MSCI ACWI Index, its parent index, and includes large and mid cap stocks across 23 Developed Markets (DM) and 24 Emerging Markets (EM) countries. The index uses a different weighting scheme than its cap weighted parent index, however. The weight of each country in the index is derived from its economic size (using GDP data) rather than the size of its equity market. Over time, GDP data tends to have more stability than equity market prices.
MSCI China (USD Net) Index: The index captures large and mid-cap representation across offshore listings of Chinese companies in the form of H shares, B shares, Red chips, P chips, and foreign listings such as ADRs. With 447 constituents, the index covers about 85% of this China equity universe. Currently, the index also includes Large Cap A shares, represented at 2.5% of their free float adjusted market capitalization.
China's Equity (Stock) Market: For the purposes of this presentation, this refers to the superset of investments including the Mainland, Hong Kong, and overseas listed securities found in the MSCI China All Shares Index. Note that others may use a different definition and, as such, the data provided by other sources may not match ours as it may exclude shares listed in certain places.
Index Definitions (continued):
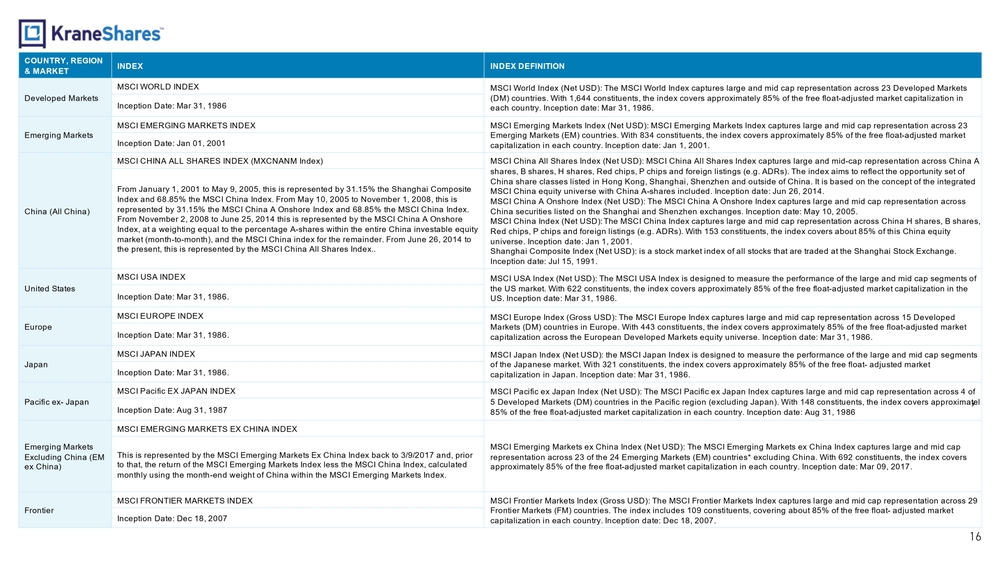
COUNTRY, REGION & MARKET INDEX DEFINITION
Developed Markets
MSCI WORLD INDEX: MSCI World Index (Net USD): The MSCI World Index captures large and mid cap representation across 23 Developed Markets (DM) countries. With 1,644 constituents, the index covers approximately 85% of the free float-adjusted market capitalization in each country. Inception date: Mar 31, 1986.
Emerging Markets
MSCI EMERGING MARKETS INDEX: MSCI Emerging Markets Index (Net USD): MSCI Emerging Markets Index captures large and mid cap representation across 23 Emerging Markets (EM) countries. With 834 constituents, the index covers approximately 85% of the free float-adjusted market capitalization in each country. Inception date: Jan 1, 2001.
China (All China)
MSCI CHINA ALL SHARES INDEX (MXCNANM Index): MSCI China All Shares Index (Net USD): MSCI China All Shares Index captures large and mid-cap representation across China A shares, B shares, H shares, Red chips, P chips and foreign listings (e.g. ADRs). The index aims to reflect the opportunity set of China share classes listed in Hong Kong, Shanghai, Shenzhen and outside of China. It is based on the concept of the integrated MSCI China equity universe with China A-shares included. Inception date: Jun 26, 2014.
From January 1, 2001 to May 9, 2005, this is represented by 31.15% the Shanghai Composite Index and 68.85% the MSCI China Index. From May 10, 2005 to November 1, 2008, this is represented by 31.15% the MSCI China A Onshore Index and 68.85% the MSCI China Index. From November 2, 2008 to June 25, 2014 this is represented by the MSCI China A Onshore Index, at a weighting equal to the percentage A-shares within the entire China investable equity market (month-to-month), and the MSCI China index for the remainder. From June 26, 2014 to the present, this is represented by the MSCI China All Shares Index.
United States
MSCI USA INDEX: MSCI USA Index (Net USD): The MSCI USA Index is designed to measure the performance of the large and mid cap segments of the US market. With 622 constituents, the index covers approximately 85% of the free float-adjusted market capitalization in the US. Inception date: Mar 31, 1986.
Europe
MSCI EUROPE INDEX: MSCI Europe Index (Gross USD): The MSCI Europe Index captures large and mid cap representation across 15 Developed Markets (DM) countries in Europe. With 443 constituents, the index covers approximately 85% of the free float-adjusted market capitalization across the European Developed Markets equity universe. Inception date: Mar 31, 1986.
Japan
MSCI JAPAN INDEX: MSCI Japan Index (Net USD): the MSCI Japan Index is designed to measure the performance of the large and mid cap segments of the Japanese market. With 321 constituents, the index covers approximately 85% of the free float-adjusted market capitalization in Japan. Inception date: Mar 31, 1986.
Pacific ex-Japan
MSCI Pacific EX JAPAN INDEX: MSCI Pacific ex Japan Index (Net USD): The MSCI Pacific ex Japan Index captures large and mid cap representation across 4 of 5 Developed Markets (DM) countries in the Pacific region (excluding Japan). With 148 constituents, the index covers approximately 85% of the free float-adjusted market capitalization in each country. Inception date: Aug 31, 1986.
Emerging Markets Excluding China (EM ex China)
MSCI EMERGING MARKETS EX CHINA INDEX: MSCI Emerging Markets ex China Index (Net USD): The MSCI Emerging Markets ex China Index captures large and mid cap representation across 23 of the 24 Emerging Markets (EM) countries* excluding China. With 692 constituents, the index covers approximately 85% of the free float-adjusted market capitalization in each country. Inception date: Mar 09, 2017.
This is represented by the MSCI Emerging Markets Ex China Index back to 3/9/2017 and, prior to that, the return of the MSCI Emerging Markets Index less the MSCI China Index, calculated monthly using the month-end weight of China within the MSCI Emerging Markets Index.
Frontier
MSCI FRONTIER MARKETS INDEX: MSCI Frontier Markets Index (Gross USD): The MSCI Frontier Markets Index captures large and mid cap representation across 29 Frontier Markets (FM) countries. The index includes 109 constituents, covering about 85% of the free float-adjusted market capitalization in each country. Inception date: Dec 18, 2007.
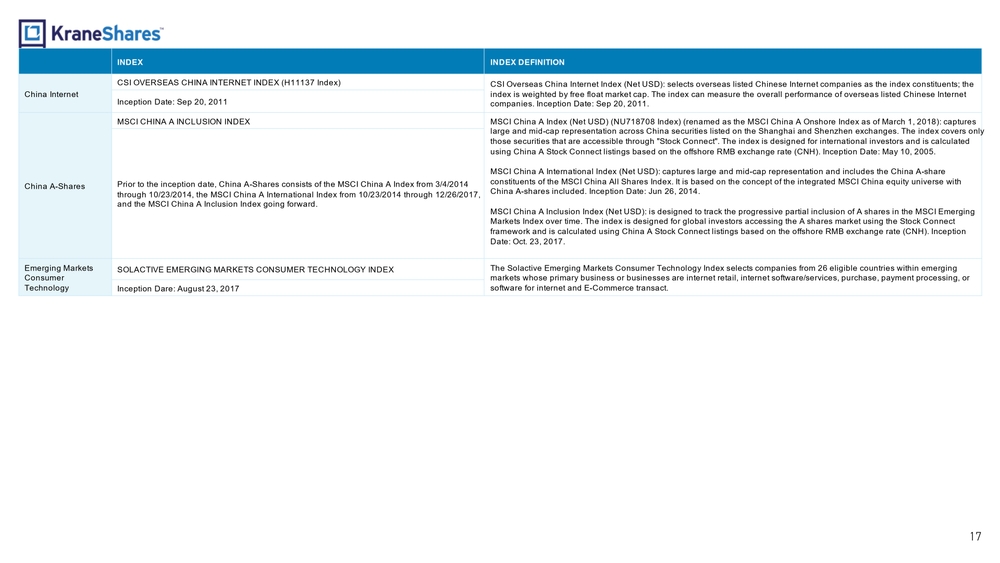
Index Definitions (continued):
China Internet
CSI OVERSEAS CHINA INTERNET INDEX (H11137 Index): CSI Overseas China Internet Index (Net USD): selects overseas listed Chinese Internet companies as the index constituents; the index is weighted by free float market cap. The index can measure the overall performance of overseas listed Chinese Internet companies. Inception Date: Sep 20, 2011.
China A-Shares
MSCI CHINA A INCLUSION INDEX:
MSCI China A Index (Net USD) (NU718708 Index) (renamed as the MSCI China A Onshore Index as of March 1, 2018): captures large and mid-cap representation across China securities listed on the Shanghai and Shenzhen exchanges. The index covers only those securities that are accessible through "Stock Connect". The index is designed for international investors and is calculated using China A Stock Connect listings based on the offshore RMB exchange rate (CNH). Inception Date: May 10, 2005.
MSCI China A International Index (Net USD): captures large and mid-cap representation and includes the China A-share constituents of the MSCI China All Shares Index. It is based on the concept of the integrated MSCI China equity universe with China A-shares included. Inception Date: Jun 26, 2014.
MSCI China A Inclusion Index (Net USD): is designed to track the progressive partial inclusion of A shares in the MSCI Emerging Markets Index over time. The index is designed for global investors accessing the A shares market using the Stock Connect framework and is calculated using China A Stock Connect listings based on the offshore RMB exchange rate (CNH). Inception Date: Oct. 23, 2017.
Prior to the inception date, China A-Shares consists of the MSCI China A Index from 3/4/2014 through 10/23/2014, the MSCI China A International Index from 10/23/2014 through 12/26/2017, and the MSCI China A Inclusion Index going forward.
Emerging Markets Consumer Technology
SOLACTIVE EMERGING MARKETS CONSUMER TECHNOLOGY INDEX: The Solactive Emerging Markets Consumer Technology Index selects companies from 26 eligible countries within emerging markets whose primary business or businesses are internet retail, internet software/services, purchase, payment processing, or software for internet and E-Commerce transact. Inception Date: August 23, 2017.
Important Notes:
Carefully consider the Funds' investment objectives, risk factors, charges and expenses before investing. This and additional information can be found in the Funds' full and summary prospectus, which may be obtained by visiting www.kraneshares.com/kemx, www.kraneshares.com/kweb, & www.kraneshares.com/kba. Read the prospectus carefully before investing.
Risk Disclosures:
Investing involves risk, including possible loss of principal. There can be no assurance that a Fund will achieve its stated objectives. Indices are unmanaged and do not include the effect of fees. One cannot invest directly in an index.
This information should not be relied upon as research, investment advice, or a recommendation regarding any products, strategies, or any security in particular. This material is strictly for illustrative, educational, or informational purposes and is subject to change. Certain content represents an assessment of the market environment at a specific time and is not intended to be a forecast of future events or a guarantee of future results; material is as of the dates noted and is subject to change without notice.
The Funds may invest in derivatives, which are often more volatile than other investments and may magnify the Funds' gains or losses. A derivative (i.e., futures/forward contracts, swaps, and options) is a contract that derives its value from the performance of an underlying asset. The primary risk of derivatives is that changes in the asset's market value and the derivative may not be proportionate, and some derivatives can have the potential for unlimited losses. Derivatives are also subject to liquidity and counterparty risk. The Funds are subject to liquidity risk, meaning that certain investments may become difficult to purchase or sell at a reasonable time and price. If a transaction for these securities is large, it may not be possible to initiate, which may cause the Funds to suffer losses. Counterparty risk is the risk of loss in the event that the counterparty to an agreement fails to make required payments or otherwise comply with the terms of the derivative.
The ability of KBA and KWEB to achieve their respective investment objectives is dependent, in part, on the continuous availability of A Shares and the ability to obtain, if necessary, additional A Shares quota. If the Funds are unable to obtain sufficient exposure to limited availability of A Share quota, the Funds could seek exposure to the component securities of the Underlying Index by investment in other types of securities.
KBA and KWEB are subject to political, social or economic instability within China which may cause a decline in value. KEMX is subject to the political, social or economic instability associated with investing internationally which may cause a decline in value. Emerging markets involve heightened risk related to the same factors as well as increase volatility and lower trading volume. Fluctuations in currency of foreign countries may have an adverse effect to domestic currency values. The Funds may invest in Initial Public Offerings (IPOs). Securities issued in IPOs have no trading history, and information about the companies may be available for very limited periods. In addition, the prices of securities sold in IPOs may be highly volatile. In addition, as the Funds increases in size, the impact of IPOs on the Funds' performance will generally decrease.
Narrowly focused investments typically exhibit higher volatility. The Funds' assets are expected to be concentrated in a sector, industry, market, or group of concentrations to the extent that the Underlying Index has such concentrations. The securities or futures in that concentration could react similarly to market developments. Thus, the Funds are subject to loss due to adverse occurrences that affect that concentration. In addition to the normal risks associated with investing, investments in smaller companies typically exhibit higher volatility. KWEB is non-diversified.
ETF shares are bought and sold on an exchange at market price (not NAV) and are not individually redeemed from the Fund. However, shares may be redeemed at NAV directly by certain authorized broker-dealers (Authorized Participants) in very large creation/redemption units. The returns shown do not represent the returns you would receive if you traded shares at other times. Shares may trade at a premium or discount to their NAV in the secondary market. Brokerage commissions will reduce returns. Beginning 12/23/2020, market price returns are based on the official closing price of an ETF share or, if the official closing price isn't available, the midpoint between the national best bid and national best offer ("NBBO") as of the time the ETF calculates the current NAV per share. Prior to that date, market price returns were based on the midpoint between the Bid and Ask price. NAVs are calculated using prices as of 4:00 PM Eastern Time.
The KraneShares ETFs and KFA Funds ETFs are distributed by SEI Investments Distribution Company (SIDCO), 1 Freedom Valley Drive, Oaks, PA 19456, which is not affiliated with Krane Funds Advisors, LLC, the Investment Adviser for the Funds, or any sub-advisers for the Funds.
[R_US_KS_SEI]