KSTR: China STAR Market ETF | KraneShares
by Kraneshares
info@kraneshares.comKSTR 6/30/2026 1Capturing China’s Brightest Science & Technology STARs Overview of the KraneShares China Technology & Semiconductor STAR 50 Index ETF ( Ticker: KSTR)
Investment Strategy:
KSTR seeks to track the performance of the Shanghai Stock Exchange (SSE) Science and Technology Innovation Board 50 Index (STAR 50
Index). The Index is comprised of the 50 largest companies listed on the SSE Science and Technology Innovation Board (STAR Marke t) as
determined by market capitalization and liquidity.
STAR Market Highlights:
•Facilitates the fast -tracking of private science and technology companies to an initial public offering (IPO).
•Since its establishment in July 2019, the STAR Market has become one of the largest IPO markets globally1 and a premier listing venue
for prominent Chinese unicorns (privately held startup companies valued at over $1 billion).
•Recent increases in fund- raising activity on Chinese exchanges can largely be attributed to the STAR Market, which accounted for
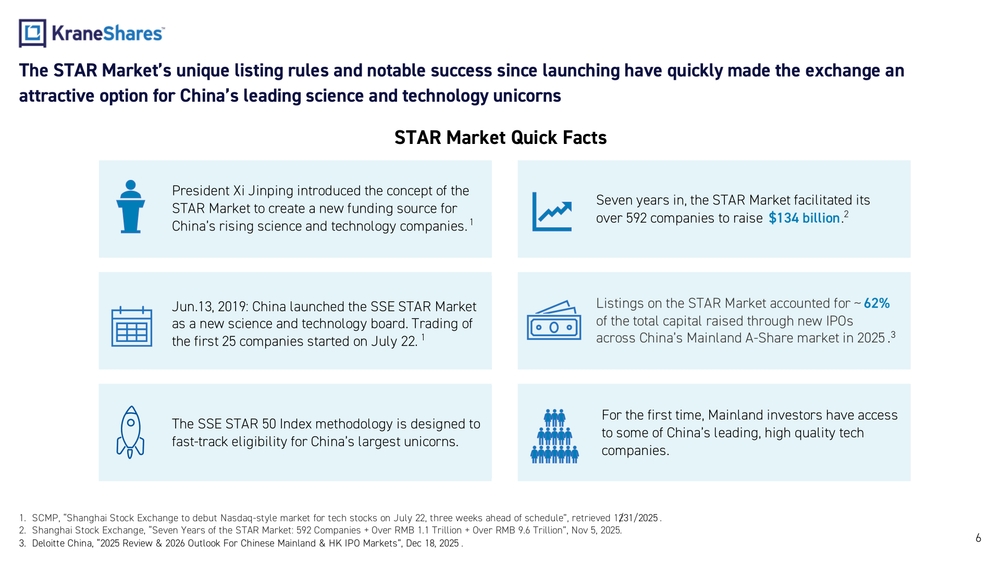
approximately 62% of total capital raised through new IPOs across China’s Mainland A -Share market in 2025.2
•Potential inclusion in the SSE Composite Index and Shanghai -Hong Kong Stock Connect could result in greater flows for STAR Marke t
securities.
KSTR Features:
•Exposure to companies poised to be China’s future leaders across industries that could represent the growth engine of China f or
decades to come.
•Innovation- driven science and technology companies in China that offer a potential source of uncorrelated, long- term growth.
•Includes companies from industries such as new -generation information technology, biomedicine, new energy, and environmental
protection.KSTR
KraneShares China
Technology &
Semiconductor STAR 50
Index ETF
21.YiCai Global, “China’s Year -Old Star Market Outshines the Venerable Nasdaq”, retrieved 12/31/2025.
2.Deloitte China, “2025 Review & 2026 Outlook For Chinese Mainland & HK IPO Markets”, Dec 18, 2025.
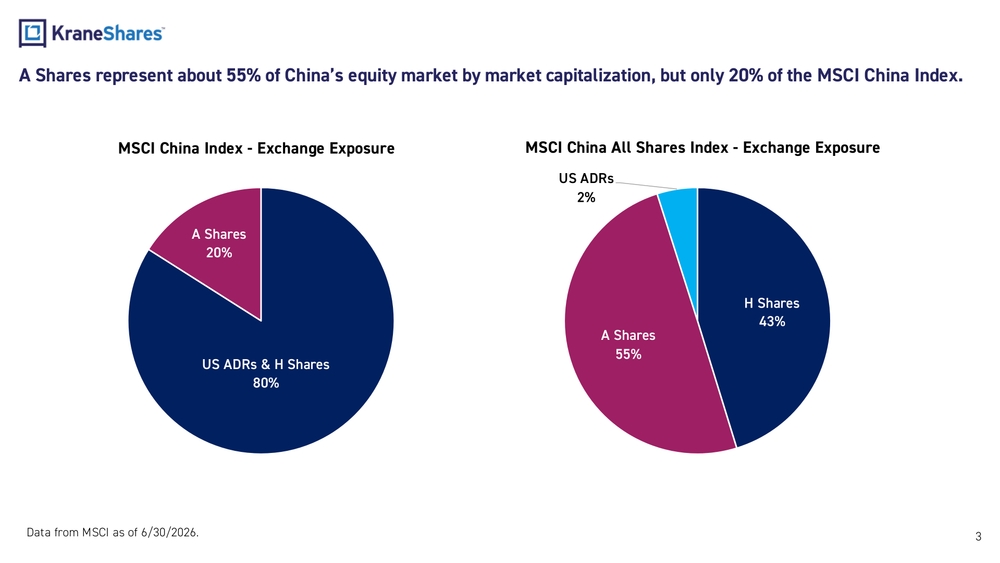
3H Shares 43% A Shares 55%US ADRs 2%MSCI China All Shares Index - Exchange Exposure Data from MSCI as of 6/30/2026.A Shares represent about 55% of China’s equity market by market capitalization, but only 20% of the MSCI China Index. US ADRs & H Shares 80%A Shares 20%MSCI China Index - Exchange Exposure
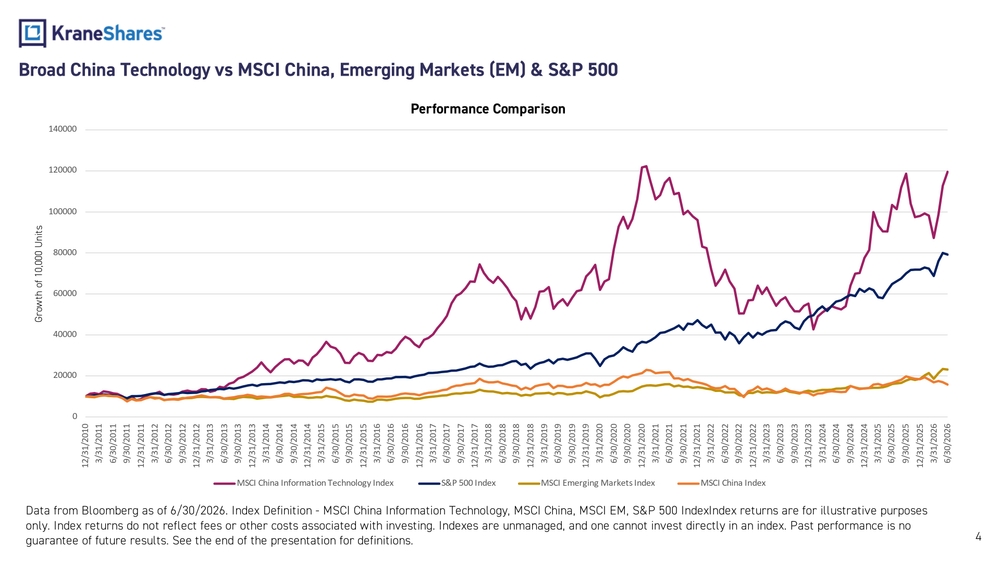
Broad China Technology vs MSCI China, Emerging Markets (EM) & S&P 500 Data from Bloomberg as of 6/30/2026. Index Definition - MSCI China Information Technology, MSCI China, MSCI EM, S&P 500 Index Index returns are for illustrative purposes only. Index returns do not reflect fees or other costs associated with investing. Indexes are unmanaged, and one cannot invest directly in an index. Past performance is no guarantee of future results. See the end of the presentation for definitions. 4020000400006000080000100000120000140000 12/31/2010 3/31/2011 6/30/2011 9/30/2011 12/31/2011 3/31/2012 6/30/2012 9/30/2012 12/31/2012 3/31/2013 6/30/2013 9/30/2013 12/31/2013 3/31/2014 6/30/2014 9/30/2014 12/31/2014 3/31/2015 6/30/2015 9/30/2015 12/31/2015 3/31/2016 6/30/2016 9/30/2016 12/31/2016 3/31/2017 6/30/2017 9/30/2017 12/31/2017 3/31/2018 6/30/2018 9/30/2018 12/31/2018 3/31/2019 6/30/2019 9/30/2019 12/31/2019 3/31/2020 6/30/2020 9/30/2020 12/31/2020 3/31/2021 6/30/2021 9/30/2021 12/31/2021 3/31/2022 6/30/2022 9/30/2022 12/31/2022 3/31/2023 6/30/2023 9/30/2023 12/31/2023 3/31/2024 6/30/2024 9/30/2024 12/31/2024 3/31/2025 6/30/2025 9/30/2025 12/31/2025 3/31/2026 6/30/2026Growth of 10,000 UnitsPerformance Comparison MSCI China Information Technology Index S&P 500 Index MSCI Emerging Markets Index MSCI China Index
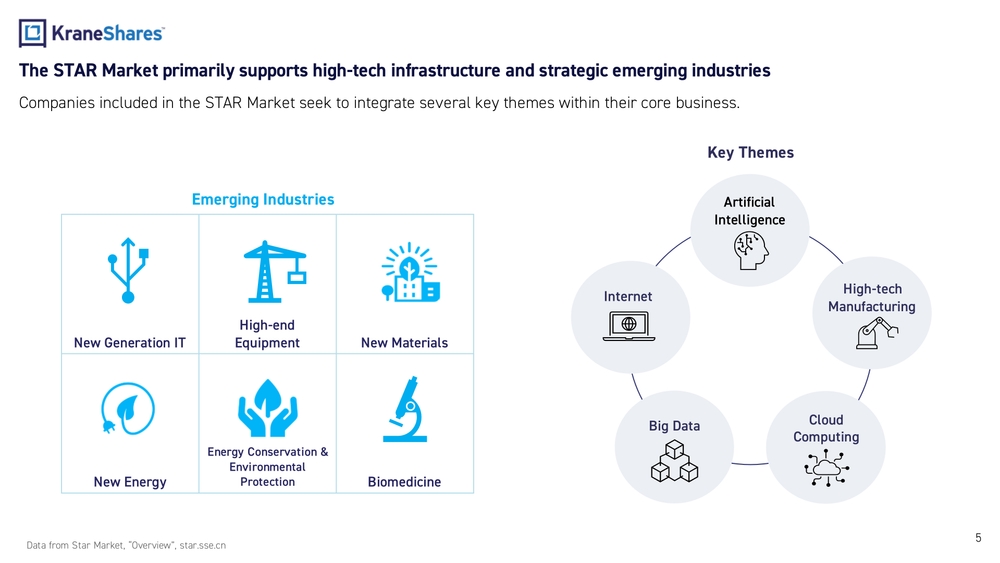
New Generation ITHigh -end Equipment New Materials New EnergyEnergy Conservation & Environmental Protection Biomedicine 5Cloud ComputingInternetArtificial Intelligence Big DataHigh -tech Manufacturing Emerging IndustriesCompanies included in the STAR Market seek to integrate several key themes within their core business. Data from Star Market, “Overview”, star.sse.cnKey ThemesThe STAR Market primarily supports high- tech infrastructure and strategic emerging industries
6The STAR Market’s unique listing rules and notable success since launching have quickly made the exchange an attractive option for China’s leading science and technology unicorns STAR Market Quick Facts President Xi Jinping introduced the concept of the STAR Market to create a new funding source for China’s rising science and technology companies. 1 Listings on the STAR Market accounted for ~ 62% of the total capital raised through new IPOs across China’s Mainland A -Share market in 2025. 3Jun.13, 2019: China launched the SSE STAR Market as a new science and technology board. Trading of the first 25 companies started on July 22. 1Seven years in, the STAR Market facilitated its over 592 companies to raise $134 billion . 2 For the first time, Mainland investors have access to some of China’s leading, high quality tech companies.The SSE STAR 50 Index methodology is designed to fast-track eligibility for China’s largest unicorns. 1.SCMP, “Shanghai Stock Exchange to debut Nasdaq -style market for tech stocks on July 22, three weeks ahead of schedule”, retrieved 12 /31/2025. 2.Shanghai Stock Exchange, “Seven Years of the STAR Market: 592 Companies + Over RMB 1.1 Trillion + Over RMB 9.6 Trillion”, Nov 5, 2025. 3.Deloitte China, “2025 Review & 2026 Outlook For Chinese Mainland & HK IPO Markets”, Dec 18, 2025.
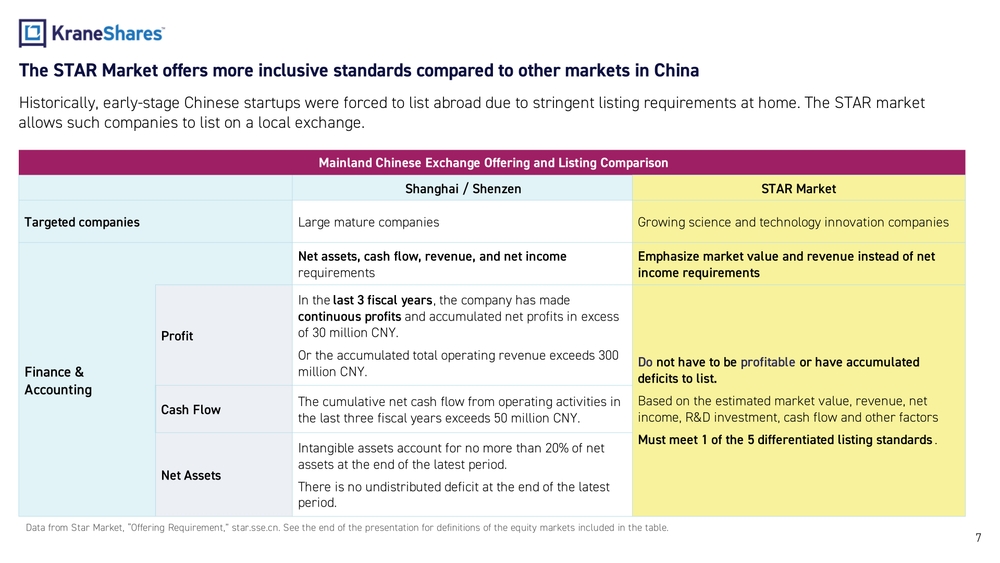
7Data from Star Market, “Offering Requirement,” star.sse.cn. See the end of the presentation for definitions of the equity mar kets included in the table. The STAR Market offers more inclusive standards compared to other markets in China Mainland Chinese Exchange Offering and Listing Comparison Shanghai / Shenzen STAR Market Targeted companies Large mature companies Growing science and technology innovation companies Finance & AccountingNet assets, cash flow, revenue, and net income requirementsEmphasize market value and revenue instead of net income requirements ProfitIn the last 3 fiscal years , the company has made continuous profits and accumulated net profits in excess of 30 million CNY. Or the accumulated total operating revenue exceeds 300 million CNY.Do not have to be profitable or have accumulated deficits to list. Based on the estimated market value, revenue, net income, R&D investment, cash flow and other factors Must meet 1 of the 5 differentiated listing standards .Cash FlowThe cumulative net cash flow from operating activities in the last three fiscal years exceeds 50 million CNY. Net AssetsIntangible assets account for no more than 20% of net assets at the end of the latest period. There is no undistributed deficit at the end of the latest period.Historically, early -stage Chinese startups were forced to list abroad due to stringent listing requirements at home. The STAR ma rket allows such companies to list on a local exchange.
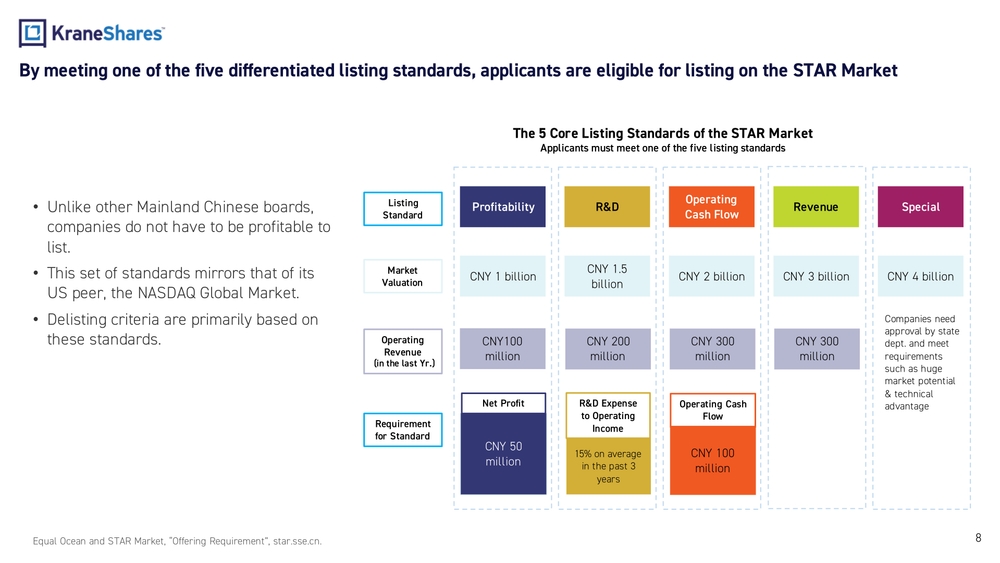
8The 5 Core Listing Standards of the STAR Market Applicants must meet one of the five listing standards •Unlike other Mainland Chinese boards, companies do not have to be profitable to list. •This set of standards mirrors that of its US peer, the NASDAQ Global Market. •Delisting criteria are primarily based on these standards. Equal Ocean and STAR Market, “Offering Requirement”, star.sse.cn.Market Valuation Operating Revenue (in the last Yr.) Requirement for StandardProfitability R&DOperating Cash FlowRevenue Special CNY 1 billionCNY 1.5 billionCNY 2 billion CNY 3 billion CNY 4 billion CNY100 millionCNY 200 millionCNY 300 millionCNY 300 millionCompanies need approval by state dept. and meet requirements such as huge market potential & technical advantage CNY 50 millionNet Profit 15% on average in the past 3 yearsR&D Expense to Operating Income CNY 100 millionOperating Cash FlowListing StandardBy meeting one of the five differentiated listing standards, applicants are eligible for listing on the STAR Market
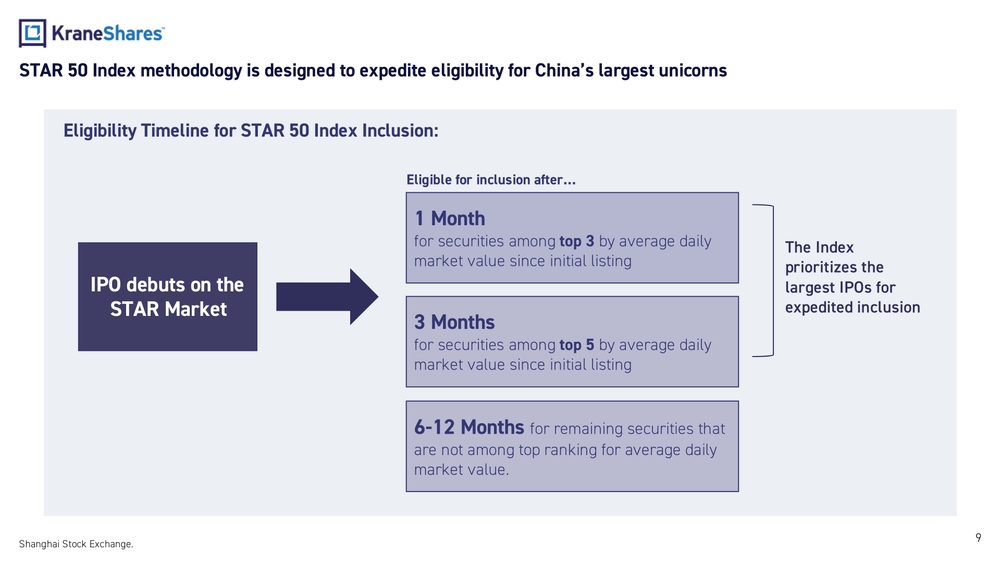
9Shanghai Stock Exchange.3 Months for securities among top 5 by average daily market value since initial listing1 Month for securities among top 3 by average daily market value since initial listing 6-12 Months for remaining securities that are not among top ranking for average daily market value.STAR 50 Index methodology is designed to expedite eligibility for China’s largest unicorns The Index prioritizes the largest IPOs for expedited inclusionEligibility Timeline for STAR 50 Index Inclusion: IPO debuts on the STAR MarketEligible for inclusion after…
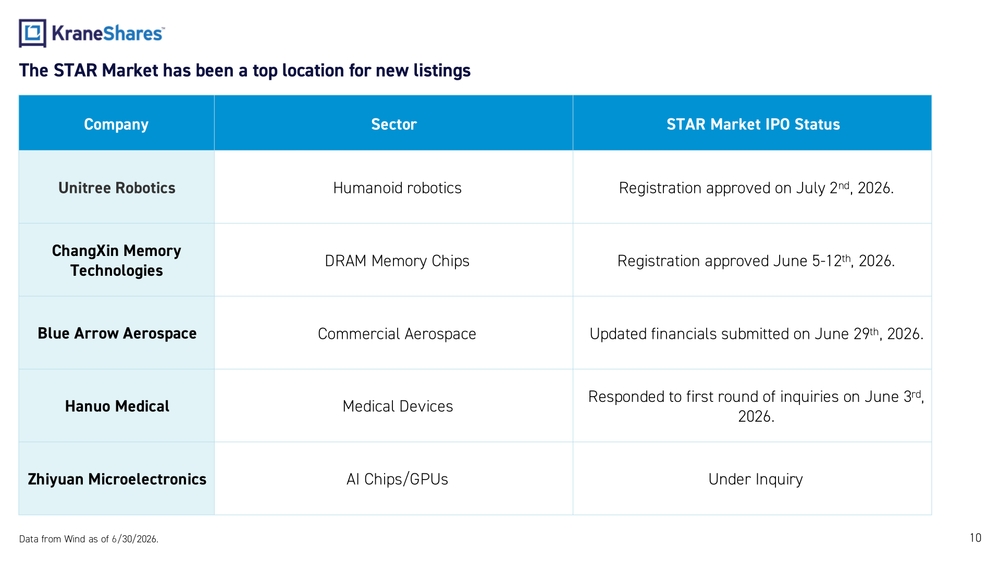
10The STAR Market has been a top location for new listings Data from Wind as of 6 /30/2026.Company Sector STAR Market IPO Status Unitree Robotics Humanoid robotics Registration approved on July 2nd, 2026. ChangXin Memory TechnologiesDRAM Memory Chips Registration approved June 5 -12th, 2026. Blue Arrow Aerospace Commercial Aerospace Updated financials submitted on June 29th, 2026. Hanuo Medical Medical DevicesResponded to first round of inquiries on June 3rd, 2026. Zhiyuan Microelectronics AI Chips/GPUs Under Inquiry
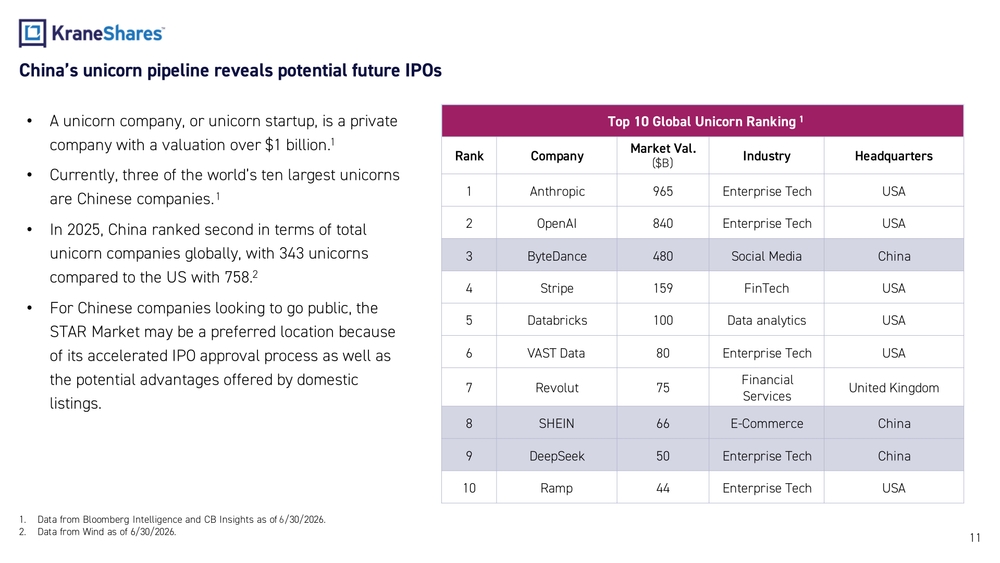
111.Data from Bloomberg Intelligence and CB Insights as of 6/30/2026. 2.Data from Wind as of 6/30/2026.•A unicorn company, or unicorn startup, is a private company with a valuation over $1 billion.1 •Currently, three of the world’s ten largest unicorns are Chinese companies. 1 •In 2025, China ranked second in terms of total unicorn companies globally, with 343 unicorns compared to the US with 758. 2 •For Chinese companies looking to go public, the STAR Market may be a preferred location because of its accelerated IPO approval process as well as the potential advantages offered by domestic listings. Top 10 Global Unicorn Ranking1 Rank CompanyMarket Val. ($B)Industry Headquarters 1 Anthropic 965 Enterprise Tech USA 2 OpenAI 840 Enterprise Tech USA 3 ByteDance 480 Social Media China 4 Stripe 159 FinTech USA 5 Databricks 100 Data analytics USA 6 VAST Data 80 Enterprise Tech USA 7 Revolut 75Financial ServicesUnited Kingdom 8 SHEIN 66 E-Commerce China 9 DeepSeek 50 Enterprise Tech China 10 Ramp 44 Enterprise Tech USAChina’s unicorn pipeline reveals potential future IPOs
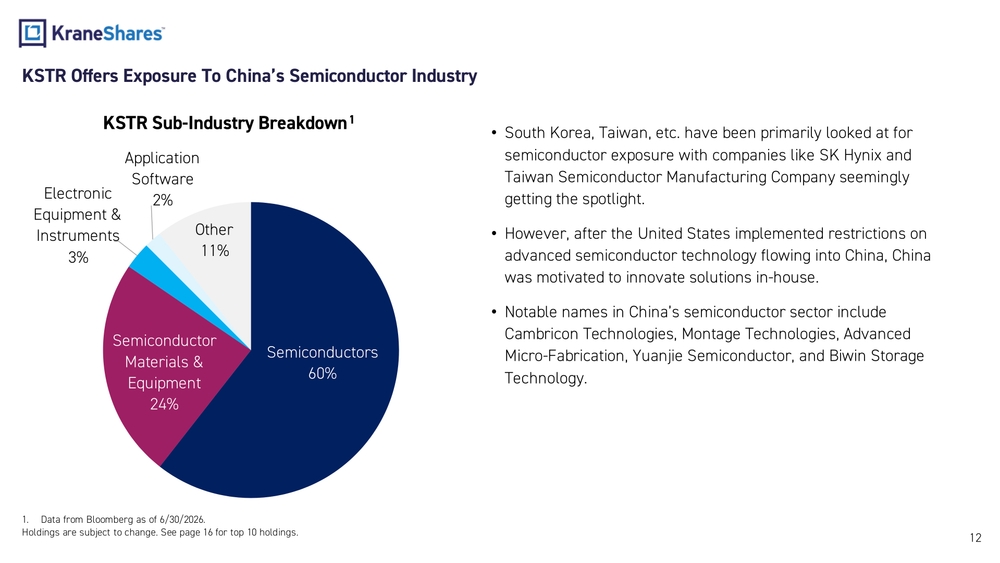
KSTR Offers Exposure To China’s Semiconductor Industry 12•South Korea, Taiwan, etc. have been primarily looked at for semiconductor exposure with companies like SK Hynix and Taiwan Semiconductor Manufacturing Company seemingly getting the spotlight. •However, after the United States implemented restrictions on advanced semiconductor technology flowing into China, China was motivated to innovate solutions in- house. •Notable names in China’s semiconductor sector include Cambricon Technologies, Montage Technologies, Advanced Micro -Fabrication, Yuanjie Semiconductor, and Biwin Storage Technology. 1.Data from Bloomberg as of 6/30/2026. Holdings are subject to change. See page 16 for top 10 holdings.Semiconductors 60%Semiconductor Materials & Equipment 24%Electronic Equipment & Instruments 3%Application Software 2% Other 11%KSTR Sub -Industry Breakdown1
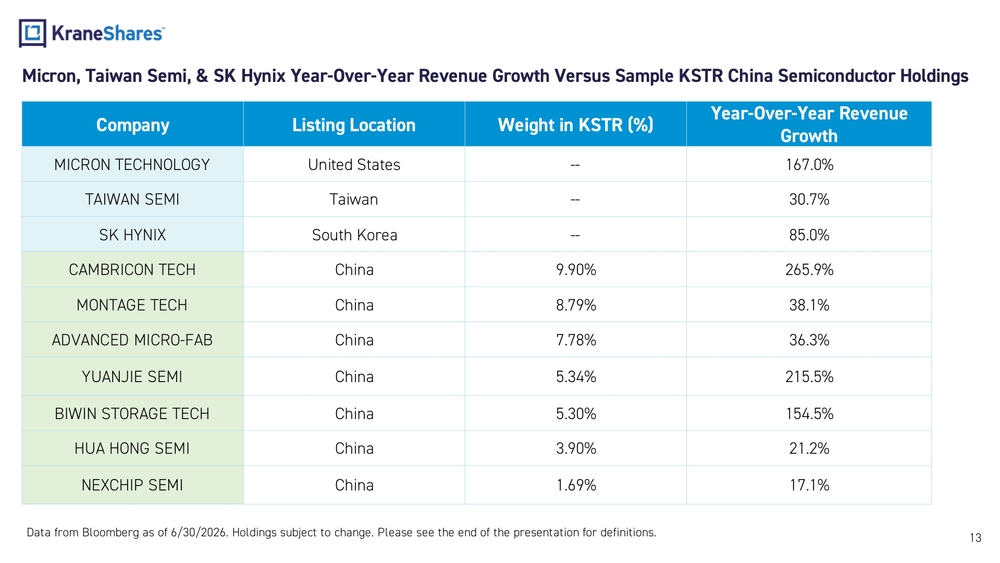
Micron, Taiwan Semi, & SK Hynix Year -Over- Year Revenue Growth Versus Sample KSTR China Semiconductor Holdings 13Company Listing Location Weight in KSTR (%)Year -Over- Year Revenue Growth MICRON TECHNOLOGY United States -- 167.0% TAIWAN SEMI Taiwan -- 30.7% SK HYNIX South Korea -- 85.0% CAMBRICON TECH China 9.90% 265.9% MONTAGE TECH China 8.79% 38.1% ADVANCED MICRO -FAB China 7.78% 36.3% YUANJIE SEMI China 5.34% 215.5% BIWIN STORAGE TECH China 5.30% 154.5% HUA HONG SEMI China 3.90% 21.2% NEXCHIP SEMI China 1.69% 17.1% Data from Bloomberg as of 6/30/2026. Holdings subject to change. Please see the end of the presentation for definitions.
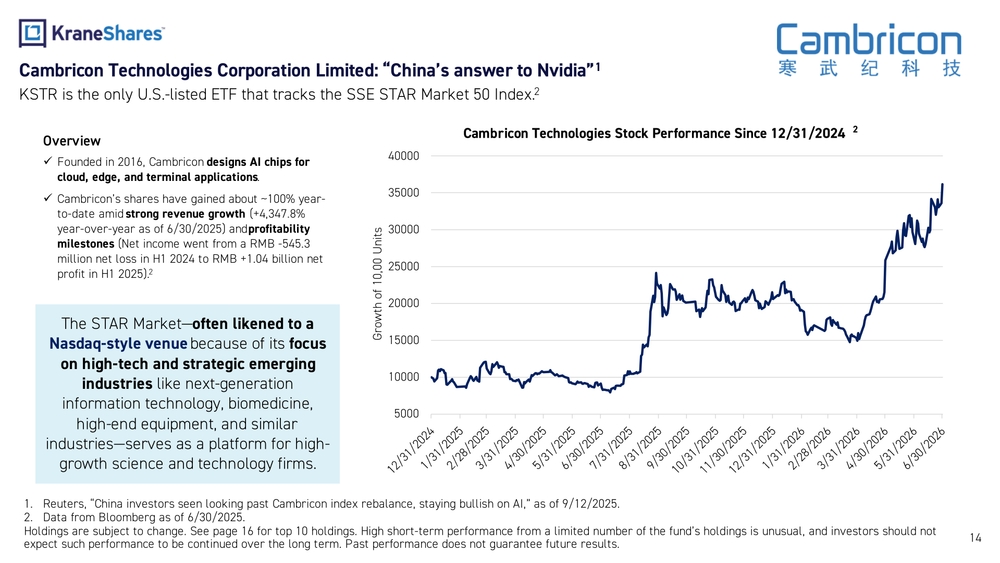
141.Reuters, “China investors seen looking past Cambricon index rebalance, staying bullish on AI,” as of 9/12/2025. 2.Data from Bloomberg as of 6/30/2025. Holdings are subject to change. See page 16 for top 10 holdings. High short -term performance from a limited number of the fund’s holdings is unusual, and investors should not expect such performance to be continued over the long term. Past performance does not guarantee future results.Overview Founded in 2016, Cambricon designs AI chips for cloud, edge, and terminal applications . Cambricon’s shares have gained about ~100% year - to-date amid strong revenue growth (+4,347.8% year-over-year as of 6/30/2025) and profitability milestones (Net income went from a RMB - 545.3 million net loss in H1 2024 to RMB +1.04 billion net profit in H1 2025).2Cambricon Technologies Corporation Limited: “China’s answer to Nvidia”1 KSTR is the only U.S. -listed ETF that tracks the SSE STAR Market 50 Index.2 The STAR Market —often likened to a Nasdaq- style venue because of its focus on high- tech and strategic emerging industries like next -generation information technology, biomedicine, high- end equipment, and similar industries —serves as a platform for high - growth science and technology firms. 500010000150002000025000300003500040000Growth of 10,00 UnitsCambricon Technologies Stock Performance Since 12/31/20242
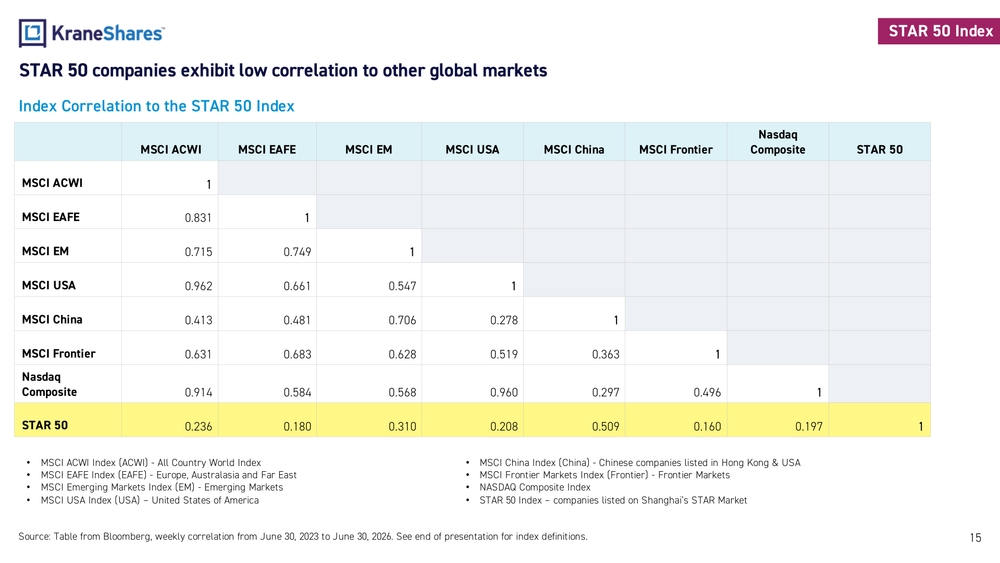
15STAR 50 companies exhibit low correlation to other global markets
MSCI ACWI MSCI EAFE MSCI EM MSCI USA MSCI China MSCI FrontierNasdaq
Composite STAR 50
MSCI ACWI 1
MSCI EAFE 0.831 1
MSCI EM 0.715 0.749 1
MSCI USA 0.962 0.661 0.547 1
MSCI China 0.413 0.481 0.706 0.278 1
MSCI Frontier 0.631 0.683 0.628 0.519 0.363 1
Nasdaq
Composite 0.914 0.584 0.568 0.960 0.297 0.496 1
STAR 50 0.236 0.180 0.310 0.208 0.509 0.160 0.197 1Index Correlation to the STAR 50 Index
•MSCI ACWI Index (ACWI) - All Country World Index
•MSCI EAFE Index (EAFE) - Europe, Australasia and Far East
•MSCI Emerging Markets Index (EM) - Emerging Markets
•MSCI USA Index (USA) – United States of America
Source: Table from Bloomberg, weekly correlation from June 30, 2023 to June 30, 2026. See end of presentation for index definitions.•MSCI China Index (China) - Chinese companies listed in Hong Kong & USA
•MSCI Frontier Markets Index (Frontier) - Frontier Markets
•NASDAQ Composite Index
•STAR 50 Index – companies listed on Shanghai’s STAR MarketSTAR 50 Index
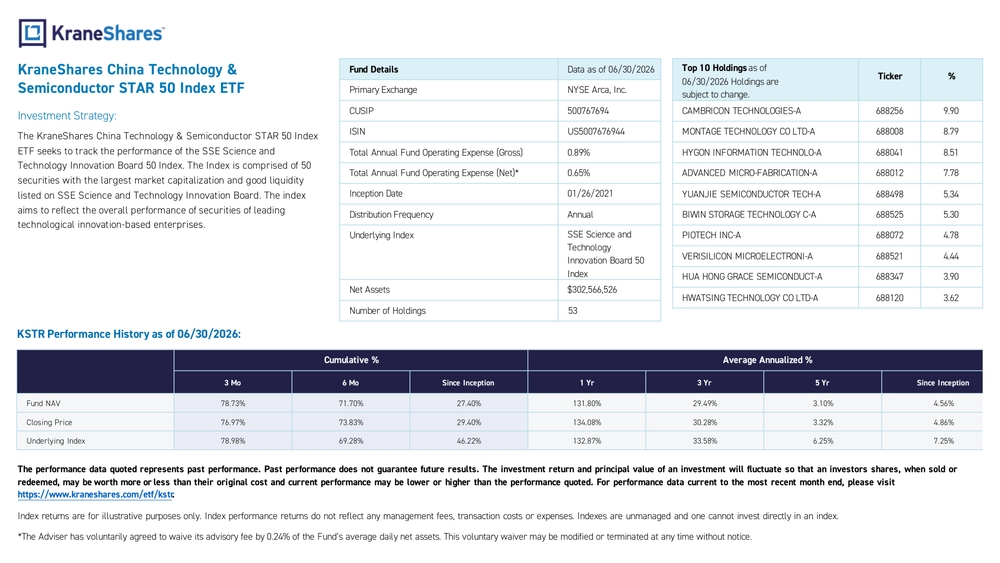
Fund Details Data asof06/30/2026 Primary Exchange NYSE Arca, Inc. CUSIP 500767694 ISIN US5007676944 Total Annual Fund Operating Expense (Gross) 0.89% Total Annual Fund Operating Expense (Net)* 0.65% Inception Date 01/26/2021 Distribution Frequency Annual Underlying Index SSE Science and Technology Innovation Board 50 Index Net Assets $302,566,526 Number ofHoldings 53 KSTR Performance History asof06/30/2026: Cumulative % Average Annualized % 3Mo 6Mo Since Inception 1Yr 3Yr 5Yr Since Inception Fund NAV 78.73% 71.70% 27.40% 131.80% 29.49% 3.10% 4.56% Closing Price 76.97% 73.83% 29.40% 134.08% 30.28% 3.32% 4.86% Underlying Index 78.98% 69.28% 46.22% 132.87% 33.58% 6.25% 7.25%KraneShares China Technology & Semiconductor STAR 50 Index ETF Investment Strategy: TheKraneShares China Technology & Semiconductor STAR 50 Index ETF seeks totrack the performance oftheSSE Science and Technology Innovation Board 50 Index. TheIndex iscomprised of50 securities with thelargest market capitalization andgood liquidity listed onSSE Science andTechnology Innovation Board. Theindex aims toreflect theoverall performance of securities ofleading technological innovation-based enterprises.Top10Holdings asof 06/30/2026 Holdings are subject tochange.Ticker % CAMBRICON TECHNOLOGIES -A 688256 9.90 MONTAGE TECHNOLOGY COLTD-A 688008 8.79 HYGON INFORMATION TECHNOLO -A 688041 8.51 ADVANCED MICRO -FABRICATION -A 688012 7.78 YUANJIE SEMICONDUCTOR TECH -A 688498 5.34 BIWIN STORAGE TECHNOLOGY C-A 688525 5.30 PIOTECH INC-A 688072 4.78 VERISILICON MICROELECTRONI -A 688521 4.44 HUA HONG GRACE SEMICONDUCT -A 688347 3.90 HWATSING TECHNOLOGY COLTD-A 688120 3.62 Theperformance data quoted represents past performance. Past performance does notguarantee future results. Theinvestment return andprincipal value ofaninvestment willfluctuate sothat aninvestors shares, when sold or redeemed, may beworth more orless than their original cost andcurrent performance may belower orhigher than theperformance quoted. Forperformance data current tothemost recent month end, please visit https://www.kraneshares.com/etf/kstr . Index returns areforillustrative purposes only. Index performance returns donotreflect anymanagement fees, transaction costs orexpenses. Indexes areunmanaged andonecannot invest directly inanindex. *The Adviser has voluntarily agreed to waive its advisory fee by 0.24% of the Fund’s average daily net assets. This voluntary waiver may be modified or terminated at any time without notice.
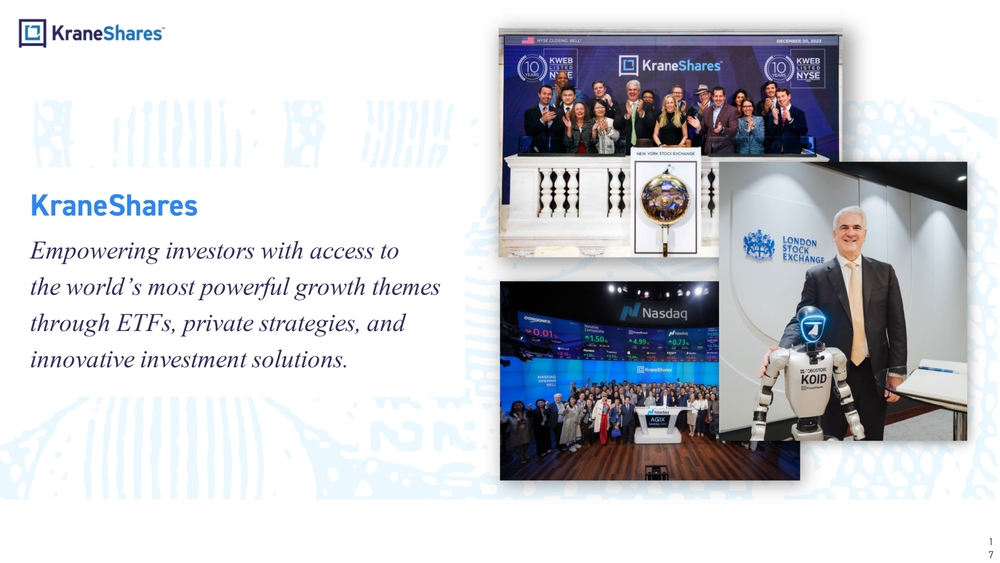
KraneShares Empowering investors with access to the world’ s most powerful growth themes through ETFs, private strategies, and innovative investment solutions. 1 7
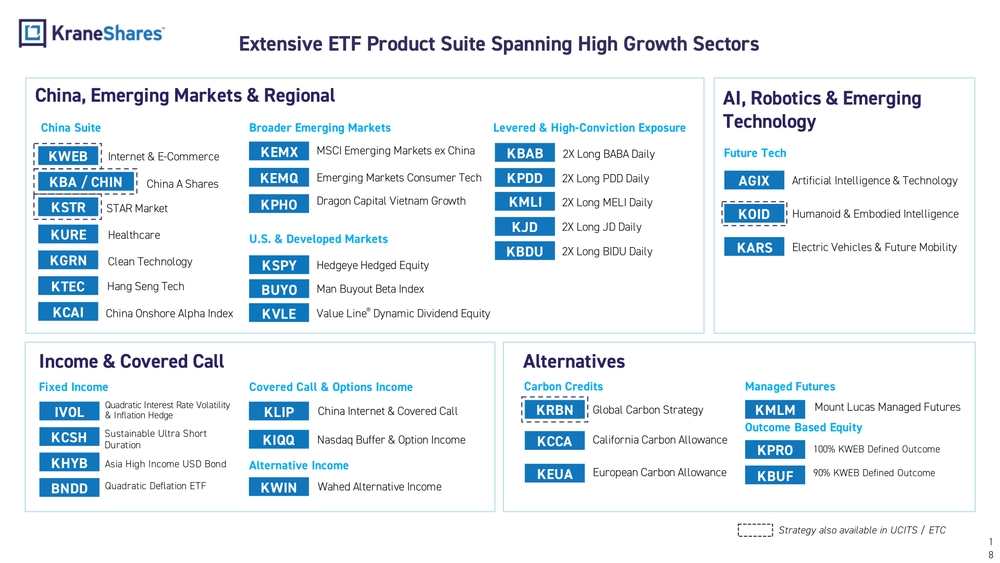
China, Emerging Markets & Regional Alternatives Income & Covered Call AI, Robotics & Emerging Technology KURE Healthcare KGRN Clean TechnologyKSTR STAR Market KTEC Hang Seng TechKWEB Internet & E -Commerce China A Shares KBA / CHIN KCAI China Onshore Alpha IndexAGIX Artificial Intelligence & Technology KOID Humanoid & Embodied Intelligence Electric Vehicles & Future Mobility KARSChina Suite Future TechBroader Emerging Markets KEMQ Emerging Markets Consumer Tech KPHODragon Capital Vietnam GrowthKEMX MSCI Emerging Markets ex China U.S. & Developed Markets KVLE Value Line® Dynamic Dividend EquityHedgeye Hedged Equity KSPY Man Buyout Beta Index BUYO Fixed Income BNDDQuadratic Deflation ETFIVOLQuadratic Interest Rate Volatility & Inflation Hedge KHYB Asia High Income USD BondSustainable Ultra Short DurationKCSH KEUA European Carbon AllowanceGlobal Carbon Strategy KRBNCarbon CreditsKPDD 2X Long PDD Daily KJD 2X Long JD DailyKBAB 2X Long BABA Daily KMLI 2X Long MELI Daily Covered Call & Options Income Managed Futures KMLMMount Lucas Managed Futures KWIN Wahed Alternative IncomeKLIP China Internet & Covered Call Outcome Based Equity KIQQ Nasdaq Buffer & Option IncomeLevered & High- Conviction Exposure KBUF90% KWEB Defined Outcome100% KWEB Defined Outcome KPRO Alternative Income KCCA California Carbon AllowanceExtensive ETF Product Suite Spanning High Growth Sectors Strategy also available in UCITS / ETCKBDU 2X Long BIDU Daily 1 8
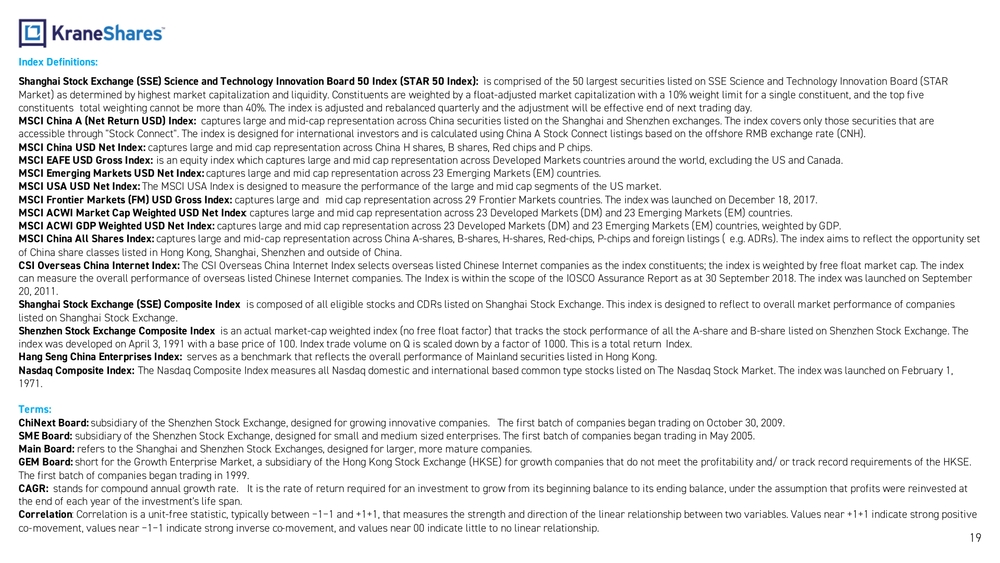
19Index Definitions:
Shanghai Stock Exchange (SSE) Science and Technology Innovation Board 50 Index (STAR 50 Index): is comprised of the 50 largest securities listed on SSE Science and Technology Innovation Board (STAR
Market) as determined by highest market capitalization and liquidity. Constituents are weighted by a float -adjusted market capitalization with a 10% weight limit for a single constituent, and the top five
constituents total weighting cannot be more than 40%. The index is adjusted and rebalanced quarterly and the adjustment will be effective end of next trading day.
MSCI China A (Net Return USD) Index: captures large and mid -cap representation across China securities listed on the Shanghai and Shenzhen exchanges. The index cover s only those securities that are
accessible through "Stock Connect". The index is designed for international investors and is calculated using China A Stock C onnect listings based on the offshore RMB exchange rate (CNH).
MSCI China USD Net Index: captures large and mid cap representation across China H shares, B shares, Red chips and P chips.
MSCI EAFE USD Gross Index: is an equity index which captures large and mid cap representation across Developed Markets countries around the world, exclu ding the US and Canada.
MSCI Emerging Markets USD Net Index: captures large and mid cap representation across 23 Emerging Markets (EM) countries.
MSCI USA USD Net Index: The MSCI USA Index is designed to measure the performance of the large and mid cap segments of the US market. MSCI Frontier Markets (FM) USD Gross Index: captures large and mid cap representation across 29 Frontier Markets countries. The index was launched on December 18, 2017.
MSCI ACWI Market Cap Weighted USD Net Index : captures large and mid cap representation across 23 Developed Markets (DM) and 23 Emerging Markets (EM) countries.
MSCI ACWI GDP Weighted USD Net Index : captures large and mid cap representation across 23 Developed Markets (DM) and 23 Emerging Markets (EM) countries, weighted by G DP.
MSCI China All Shares Index : captures large and mid -cap representation across China A‐shares, B‐shares, H‐shares, Red‐chips, P‐chips and foreign listings ( e.g. ADRs). The index aims to reflect the opportunity set
of China share classes listed in Hong Kong, Shanghai, Shenzhen and outside of China.CSI Overseas China Internet Index: The CSI Overseas China Internet Index selects overseas listed Chinese Internet companies as the index constituents; the index is weighted by free float market cap. The index
can measure the overall performance of overseas listed Chinese Internet companies. The Index is within the scope of the IOSCO Assurance Report as at 30 September 2018. The index was launched on September
20, 2011.Shanghai Stock Exchange (SSE) Composite Index is composed of all eligible stocks and CDRs listed on Shanghai Stock Exchange. This index is designed to reflect to overall m arket performance of companies
listed on Shanghai Stock Exchange.Shenzhen Stock Exchange Composite Index is an actual market -cap weighted index (no free float factor) that tracks the stock performance of all the A -share and B -share listed on Shenzhen Stock Exchange. The
index was developed on April 3, 1991 with a base price of 100. Index trade volume on Q is scaled down by a factor of 1000. This is a total return Index.
Hang Seng China Enterprises Index : serves as a benchmark that reflects the overall performance of Mainland securities listed in Hong Kong.
Nasdaq Composite Index: The Nasdaq Composite Index measures all Nasdaq domestic and international based common type stocks listed on The Nasdaq Stock Market. The index was launched on February 1,
1971.
Terms:
ChiNext Board: subsidiary of the Shenzhen Stock Exchange, designed for growing innovative companies. The first batch of companies began tra ding on October 30, 2009.
SME Board: subsidiary of the Shenzhen Stock Exchange, designed for small and medium sized enterprises. The first batch of companies bega n trading in May 2005.
Main Board: refers to the Shanghai and Shenzhen Stock Exchanges, designed for larger, more mature companies.
GEM Board: short for the Growth Enterprise Market, a subsidiary of the Hong Kong Stock Exchange (HKSE) for growth companies that do not mee t the profitability and/ or track record requirements of the HKSE.
The first batch of companies began trading in 1999.
CAGR: stands for compound annual growth rate. It is the rate of return required for an investment to grow from its beginning balan ce to its ending balance, under the assumption that profits were reinvested at
the end of each year of the investment's life span.Correlation : Correlation is a unit -free statistic, typically between −1−1 and +1+1, that measures the strength and direction of the linear relationship between two variables. Values near +1+1 indicate strong positive
co-movement, values near −1−1 indicate strong inverse co -movement, and values near 00 indicate little to no linear relationship.
Important Notes: Carefully consider the Funds’ investment objectives, risk factors, charges and expenses before investing. This and additional information can be found in the Funds' full and summary prospectus, which may be obtained by visiting www.kraneshares.com /kstr .Read the prospectus carefully before investing. Risk Disclosures: Investing involves risk, including possible loss of principal. There can be no assurance that a Fund will achieve its stated objectives. Indices are unmanaged and do not include the effect of fees. One cannot invest directly in an index. This information should not be relied upon as research, investment advice, or a recommendation regarding any products, strate gies, or any security in particular . This material is strictly for illustrative, educational, or informational purposes and is subject to change. Certain content represents an assessment of the market environment at a specific time and is not intended to be a forecast of future events or a guarantee of future results; material is as of the dates noted and is subject to change without notice. A-Shares are issued by companies in mainland China and traded on local exchanges. They are available to domestic and certain fo reign investors, including QFIs and those participating in Stock Connect Programs like Shanghai -Hong Kong and Shenzhen- Hong Kong. Foreign investments in A -Shares face various regulations and restrictions, including limits on asset repatr iation. A -Shares may experience frequent trading halts and illiquidity, which can lead to volatility in the Fund’s share price and increased trading halt risks. The Chinese economy is an emerging market, vulnerable to domestic and regional econom ic and political changes, often showing more volatility than developed markets. Companies face risks from potential government interventions, and the export -driven economy is sensitive to downturns in key trading partners, impacting the Fund. U .S.-China tensions raise concerns over tariffs and trade restrictions, which could harm China’s exports and the Fund. China's regulatory standards are less stringent than in the U.S., resulting in limited information about issuers. Tax laws ar e unclear and subject to change, potentially impacting the Fund and leading to unexpected liabilities for foreign investors. Fluctuations in currency of foreign countries may have an adverse effect to domestic currency values. The Fund may invest in derivatives, which are often more volatile than other investments and may magnify the Fund’s gains or losses. A derivative (i.e., futures/forward contracts, swaps, and options) is a contract that derives its value from the performance of an underlying asset. The primary risk of derivatives is that changes in the asset’s market value and the deriv ative may not be proportionate, and some derivatives can have the potential for unlimited losses. Derivatives are also subject to liquidity and counterparty risk. The Fund is subject to liquidity risk, meaning that certain investments may becom e difficult to purchase or sell at a reasonable time and price. If a transaction for these securities is large, it may not be possible to initiate, which may cause the Fund to suffer losses. Counterparty risk is the risk of loss in the event that the counterparty to an agreement fails to make required payments or otherwise comply with the terms of the derivative. The Fund may invest in Initial Public Offerings (IPOs). Securities issued in IPOs have no trading history, and information ab out the companies may be available for very limited periods. In addition, the prices of securities sold in IPOs may be highly volatile. In addition, as the Fund increases in size, the impact of IPOs on the Fund’s performance will generally decrease. N arrowly focused investments typically exhibit higher volatility. The Fund’s assets are expected to be concentrated in a sector, industry, market, or group of concentrations to the extent that the Underlying Index has such concentrations. The securities or futures in that concentration could react similarly to market developments. Thus, the Fund is subject to loss due to adverse occurrences that affect that concentration. In addition to the normal risks associated with investing, investments in smaller companies typically exhibit higher volatility. KSTR is non- diversified. ETF shares are bought and sold on an exchange at market price (not NAV) and are not individually redeemed from the Fund. Howe ver, shares may be redeemed at NAV directly by certain authorized broker -dealers (Authorized Participants) in very large creation/redemption units. The returns shown do not represent the returns you would receive if you traded shares at other times. Shares may trade at a premium or discount to their NAV in the secondary market. Brokerage commissions will reduce returns. Beginning 12/23/2020, market price returns are based on the official closing price of an ETF share or, if the official closing price isn't available, the midpoint between the national best bid and national best offer ("NBBO") as of the time the ETF calculates the current NAV per share. Prior to that date, market price returns were based on the midpoint betwee n the Bid and Ask price. NAVs are calculated using prices as of 4:00 PM Eastern Time. The KraneShares ETFs and KFA Funds ETFs are distributed by SEI Investments Distribution Company (SIDCO), 1 Freedom Valley Dri ve, Oaks, PA 19456, which is not affiliated with Krane Funds Advisors, LLC, the Investment Adviser for the Funds, or any sub -advisers for the Funds.