2026_summer_internet_report (3)
by Kraneshares
info@kraneshares.com +1 (212) 933 0393Summer 2026 China Internet Quarterly Earnings Report

2 kraneshares.com info@kraneshares.com +1 (212) 933 0393 Back to Top ↑Introducing The KraneShares China/Emerging Markets Internet & Consumer Technology ETF Suite Option Income KLIP KWEB Covered Calls providing monthly distributions*Growth KWEB China Internet & Consumer TechnologyKEMQ Broad Emerging Markets Internet & Consumer Technology Distributions are not guaranteed and may vary. KLIP's covered-call strategy limits upside participation while remaining subject to market declines. **KPRO and KBUF differ from traditional investment products because their potential gains and lloss buffers apply over a specified Outcome Period. Purchasing or selling shares during that period may result in different outcomes, the buffers may not protect against all losses, and gains are subject to a cap. The Funds may not be suitable for all investors. Please read the Funds' prospectuses, including "Investor Suitabiulity Considerations".BufferKPRO Defined Outcome Exposure to KWEB Outcome Period Ending January 2027KBUF Defined Outcome Exposure to KWEB Outcome Period Ending January 2027
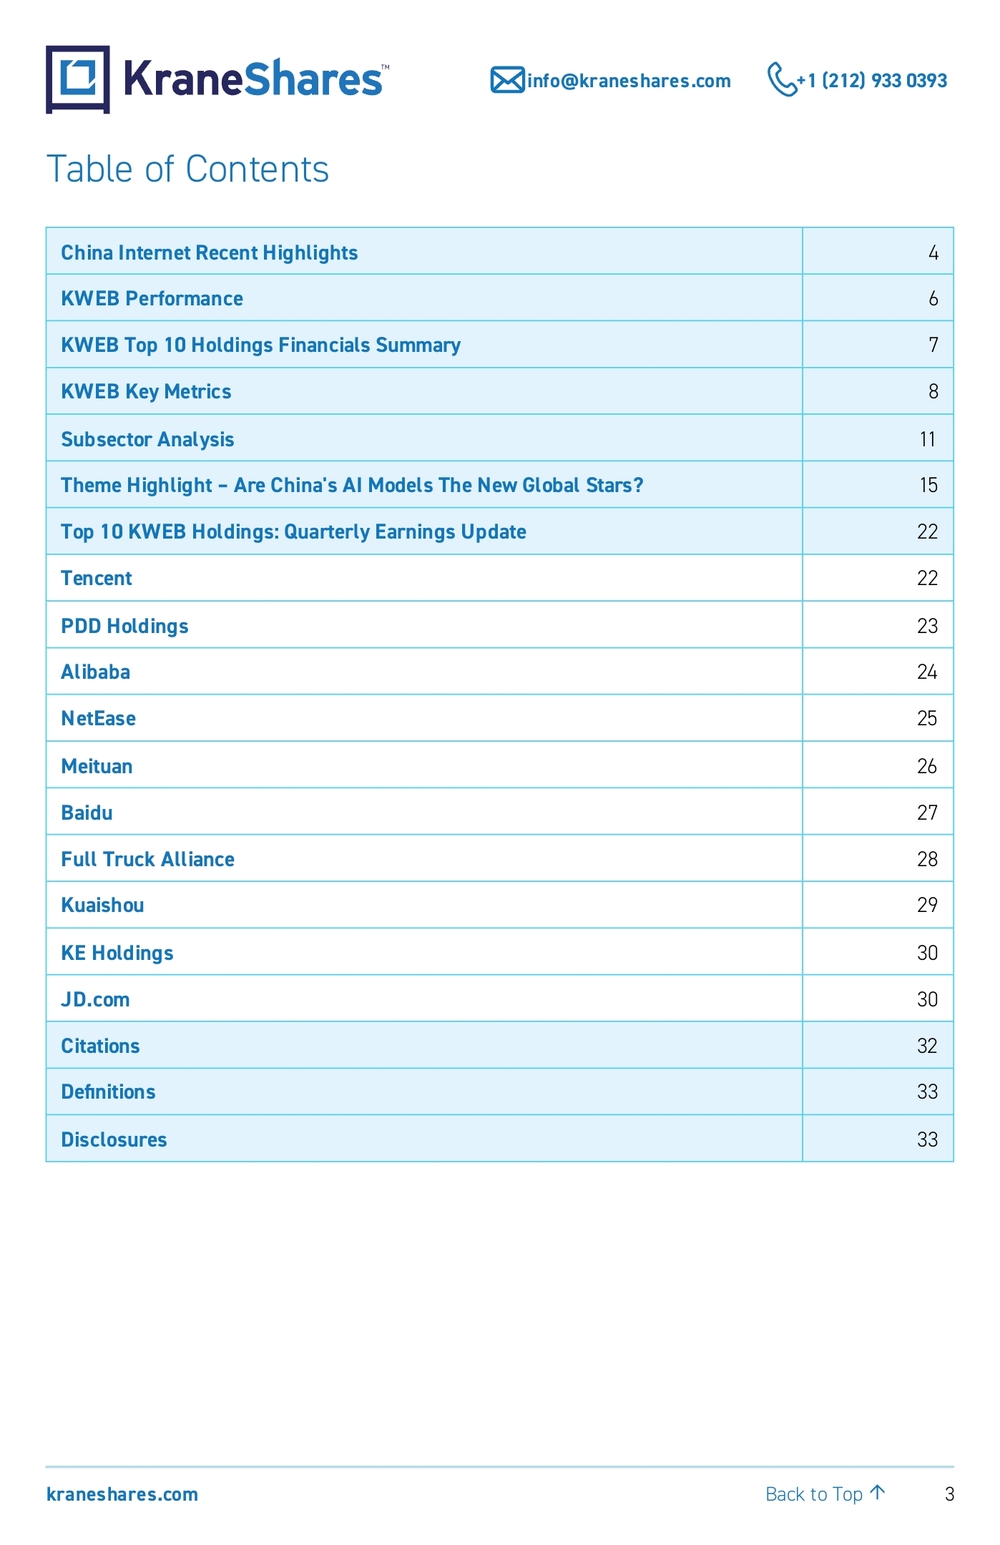
3 kraneshares.com info@kraneshares.com +1 (212) 933 0393 Back to Top ↑Table of Contents China Internet Recent Highlights 4 KWEB Performance 6 KWEB Top 10 Holdings Financials Summary 7 KWEB Key Metrics 8 Subsector Analysis 11 Theme Highlight – Are China's AI Models The New Global Stars? 15 Top 10 KWEB Holdings: Quarterly Earnings Update 22 Tencent 22 PDD Holdings 23 Alibaba 24 NetEase 25 Meituan 26 Baidu 27 Full Truck Alliance 28 Kuaishou 29 KE Holdings 30 JD.com 30 Citations 32 Definitions 33 Disclosures 33
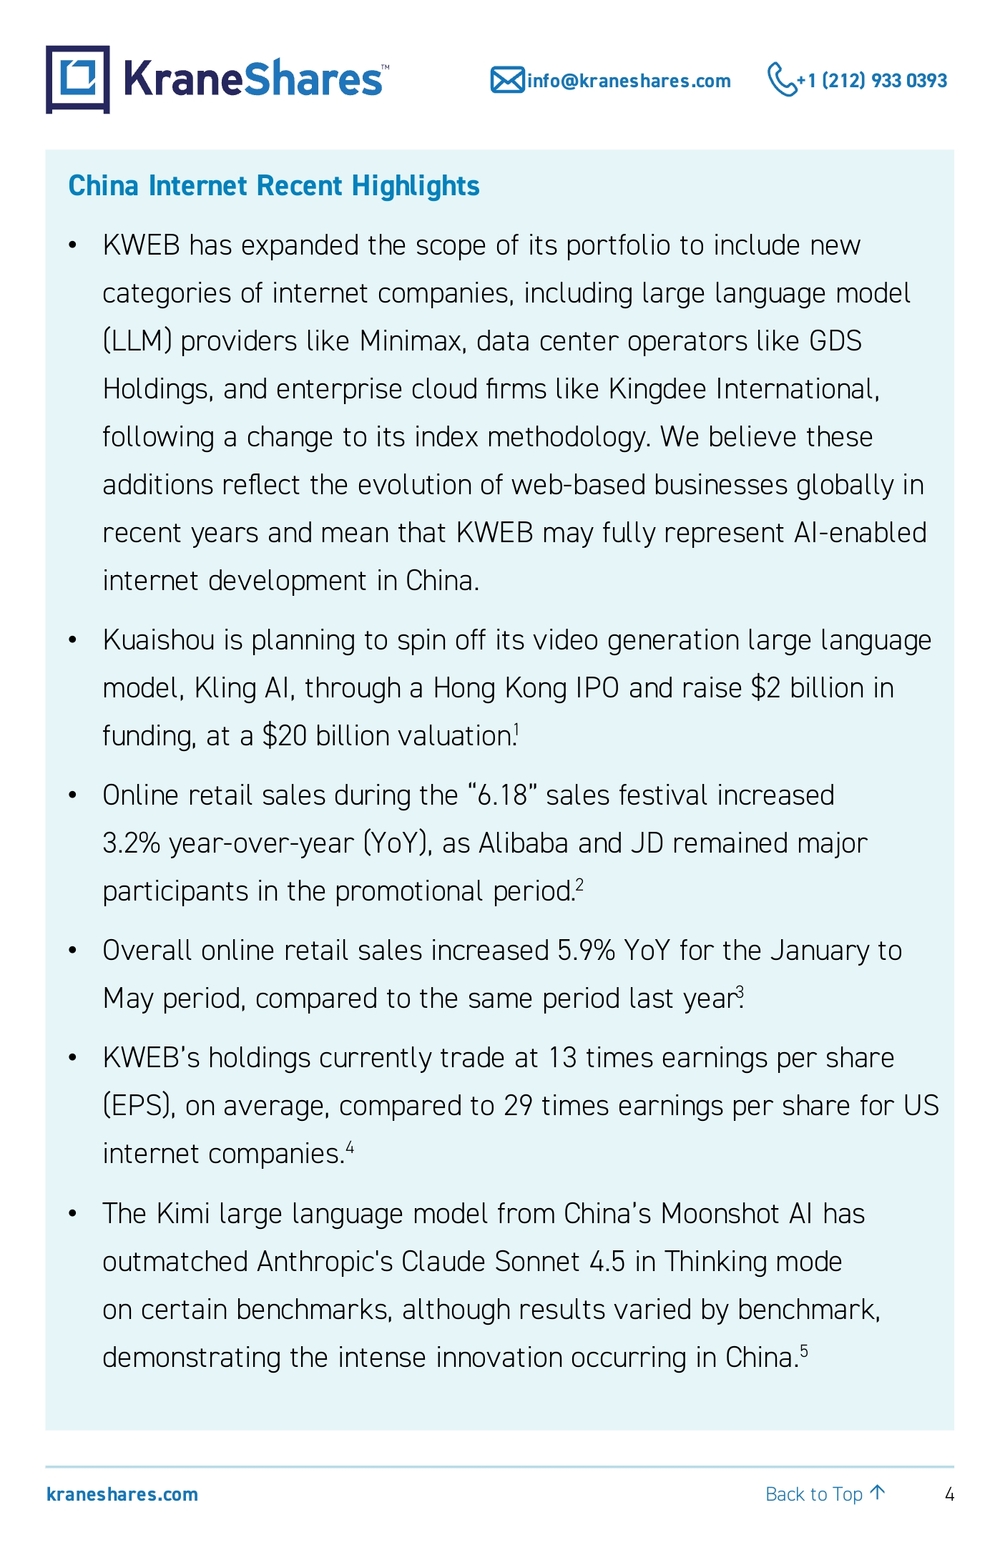
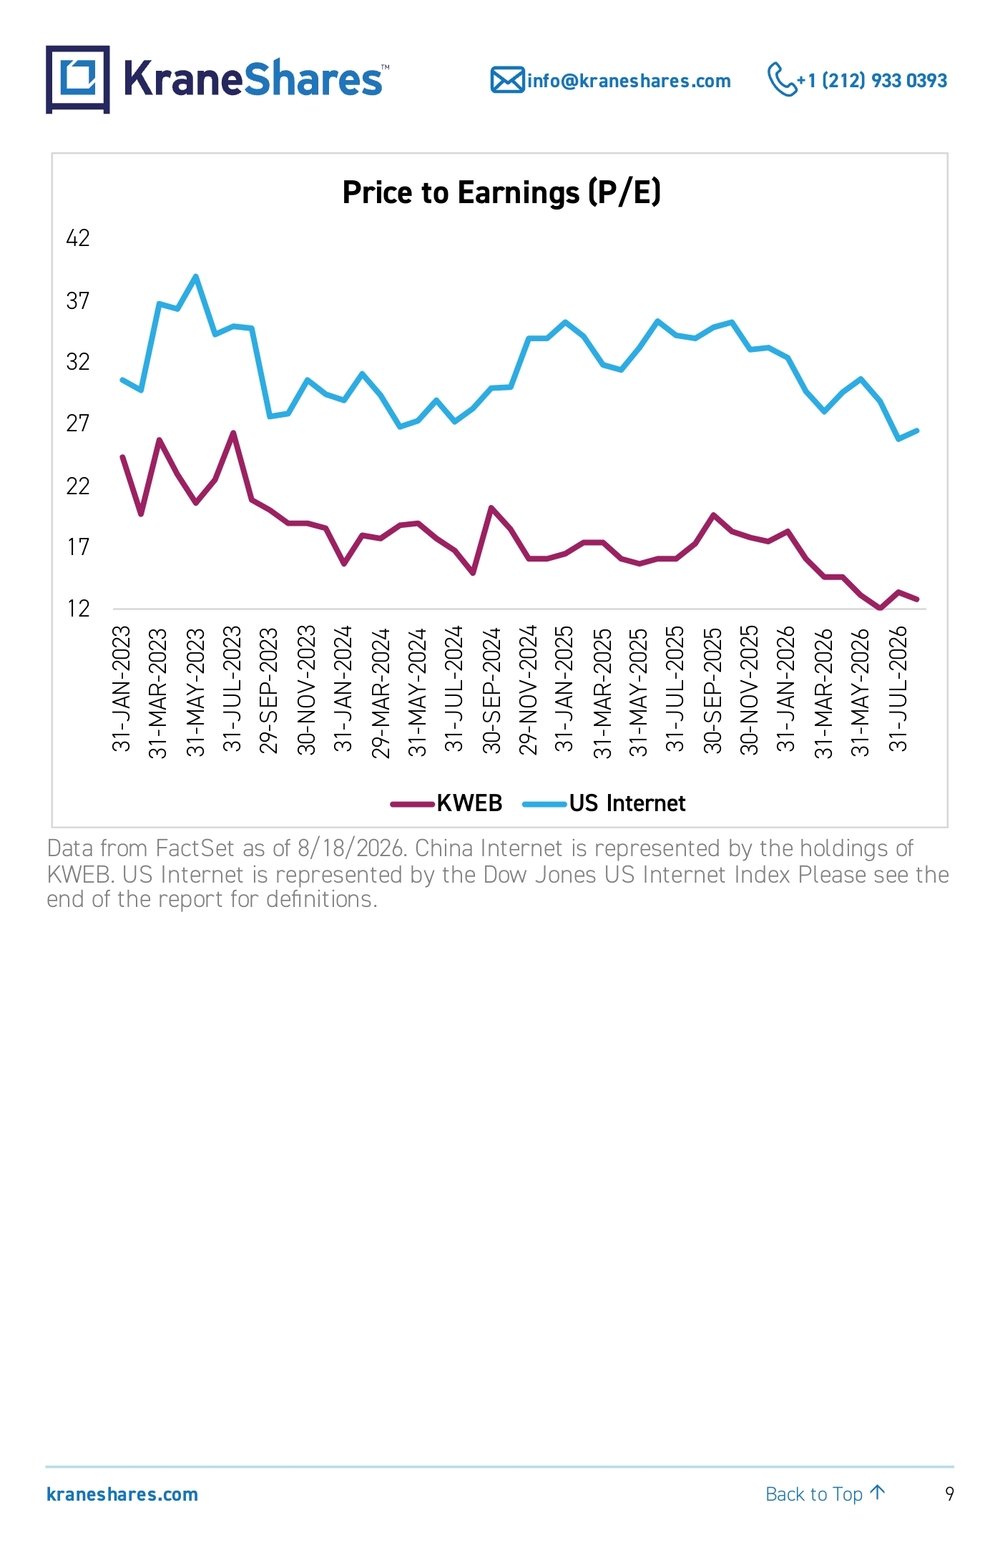
4 kraneshares.com info@kraneshares.com +1 (212) 933 0393 Back to Top ↑China Internet Recent Highlights •KWEB has expanded the scope of its portfolio to include new categories of internet companies, including large language model (LLM) providers like Minimax, data center operators like GDS Holdings, and enterprise cloud firms like Kingdee International, following a change to its index methodology. We believe these additions reflect the evolution of web-based businesses globally in recent years and mean that KWEB may fully represent AI-enabled internet development in China. •Kuaishou is planning to spin off its video generation large language model, Kling AI, through a Hong Kong IPO and raise $2 billion in funding, at a $20 billion valuation.1 •Online retail sales during the “6.18” sales festival increased 3.2% year-over-year (YoY), as Alibaba and JD remained major participants in the promotional period.2 •Overall online retail sales increased 5.9% YoY for the January to May period, compared to the same period last year.3 •KWEB’s holdings currently trade at 13 times earnings per share (EPS), on average, compared to 29 times earnings per share for US internet companies.4 •The Kimi large language model from China’s Moonshot AI has outmatched Anthropic's Claude Sonnet 4.5 in Thinking mode on certain benchmarks, although results varied by benchmark, demonstrating the intense innovation occurring in China.5
5 kraneshares.com info@kraneshares.com +1 (212) 933 0393 Back to Top ↑ •Alibaba's Qwen model achieved over 3 billion downloads in the six-month period through mid-August, surpassing those of models from Meta and Google over the same period.13 •The World Artificial Intelligence Conference (WAIC), held in July in Shanghai, featured an address from President Xi extolling the value of China’s open-source approach to AI.6 •In this edition’s theme highlight, we examine the growing trend of global businesses diversifying the AI models they use with more cost-effective, open-weight, China-developed models and what this means for investors and China’s internet sector.
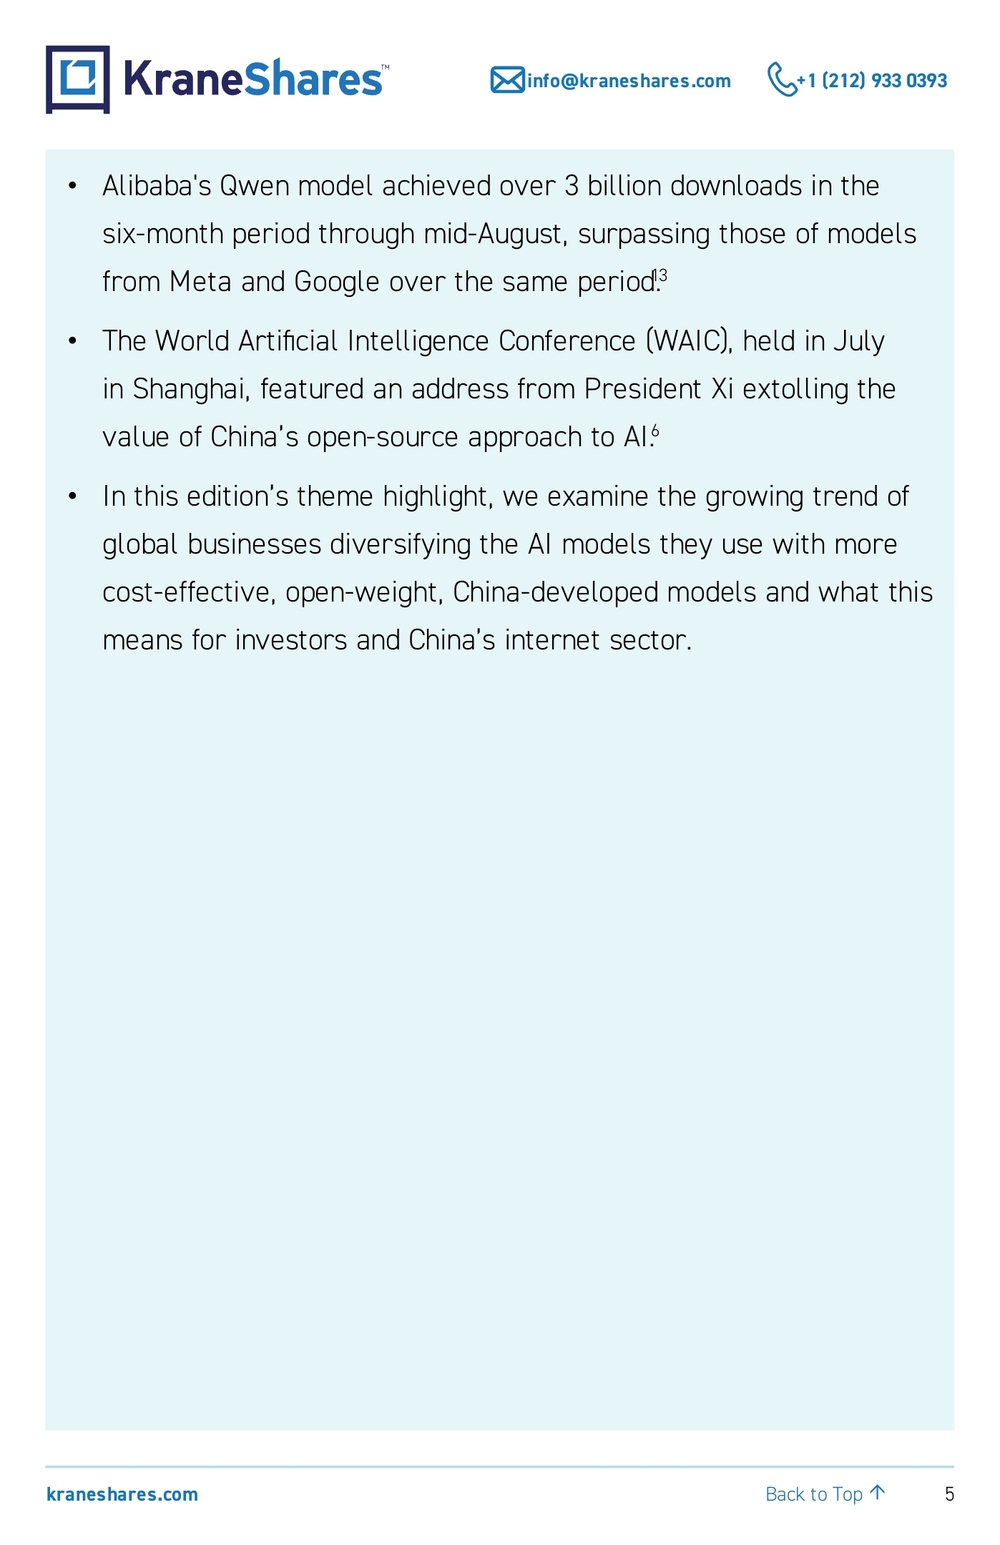
6 kraneshares.com info@kraneshares.com +1 (212) 933 0393 Back to Top ↑KraneShares CSI China Internet ETF (Ticker: KWEB) Performance Cumulative % Data as of: 08/31/2026 Fund NAV Closing Price Index 1 Month -7.27% -9.41% -7.28% 3 Month -2.10% -3.44% -2.21% 6 Month -16.37% -16.90% -16.95% YTD -23.64% -24.20% -24.14% Since Inception 34.29% 32.45% 34.50% Avg Annualized % Data as of month end: 08/31/2026 Fund NAV Closing Price Index 1 Year -25.85% -28.32% -26.32% 3 Year 0.65% 0.08% 0.00% 5 Year -9.22% -9.50% -9.44% 10 Year -1.65% -1.80% -1.64% Since Inception 2.28% 2.17% 2.29% KWEB’s gross expense ratio is 0.70%. Inception Date: 7/31/2013. KWEB Index is the CSI Overseas China Internet Index. The performance data quoted represents past performance. Past performance does not guarantee future results. The investment return and principal value of an investment will fluctuate so that an investor’s shares, when sold or redeemed, may be worth more or less than their original cost, and current performance may be lower or higher than the performance quoted. For performance data current to the most recent month end, please call +(1) 855 8KRANE8 or visit our website at www. kraneshares.com/kweb .
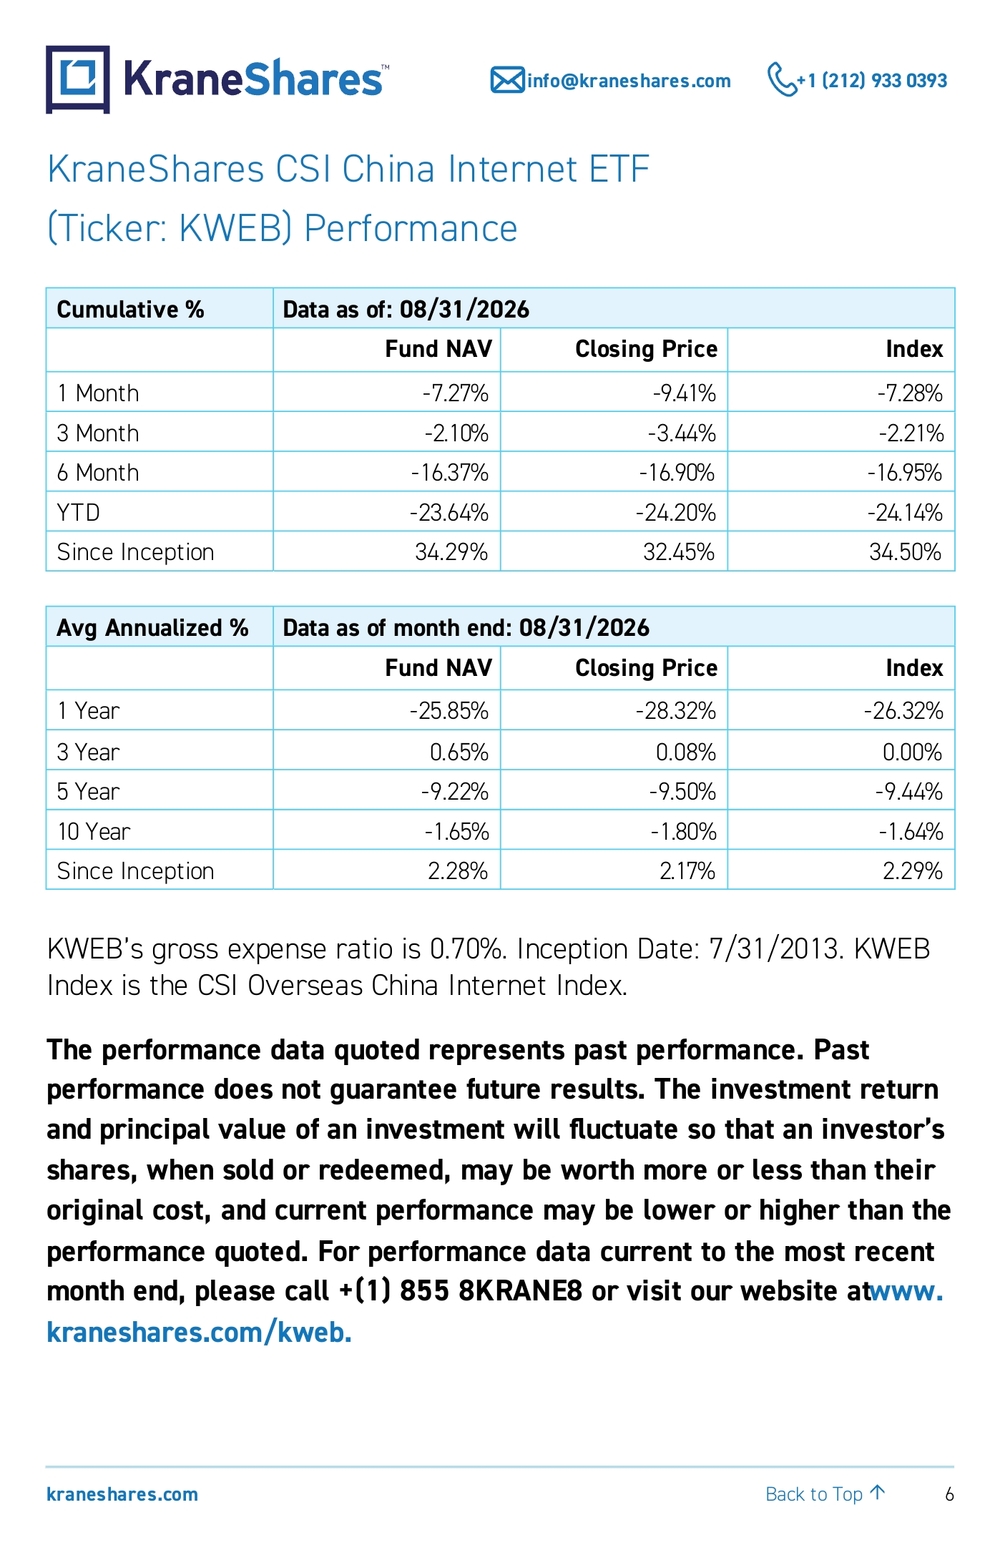
7 kraneshares.com info@kraneshares.com +1 (212) 933 0393 Back to Top ↑KWEB Top 10 Holdings Financials Summary Top 10 KWEB HoldingsKWEB Weight (%)Revenue ($ B)Net Income ($ B)Revenue Growth (%)Net Margin (%)Earnings per Share ($) Tencent 10.44 30.1 15.0 11 50 1.6 PDD Holdings 7.92 16.7 4.1 10 25 2.8 Alibaba 7.70 40.0 2.1 9 5 0.8 NetEase 6.97 4.5 1.4 8 31 2.1 Meituan 6.83 15.6 0.4 14 3 0.1 Baidu 4.19 4.7 0.2 -4 4 0.6 Full Truck Alliance4.15 0.5 0.2 4 40 0.2 Kuaishou 4.08 5.3 0.5 3 9 0.1 KE Holdings 3.89 3.6 0.4 -6 11 0.4 JD.com 3.88 51.4 1.1 -3 2 0.4 Total Weighted Average Total 60.05 172.4 25.4 4% 13 9.1 Data from KraneShares and Bloomberg as of 06/30/2026. Revenue, adjusted net income, adjusted net margin, and adjusted earnings per share are based on company- reported results and may reflect non-GAAP measures that vary by issuer. Non-GAAP measures exclude certain items included in the most directly comparable GAAP measures. Please refer to each company's financial disclosures for definitions and reconciliations to the most comparable GAAP measures. Percentage changes are year- over-yyear unless otherwise indicated. Holdings are subject to change.
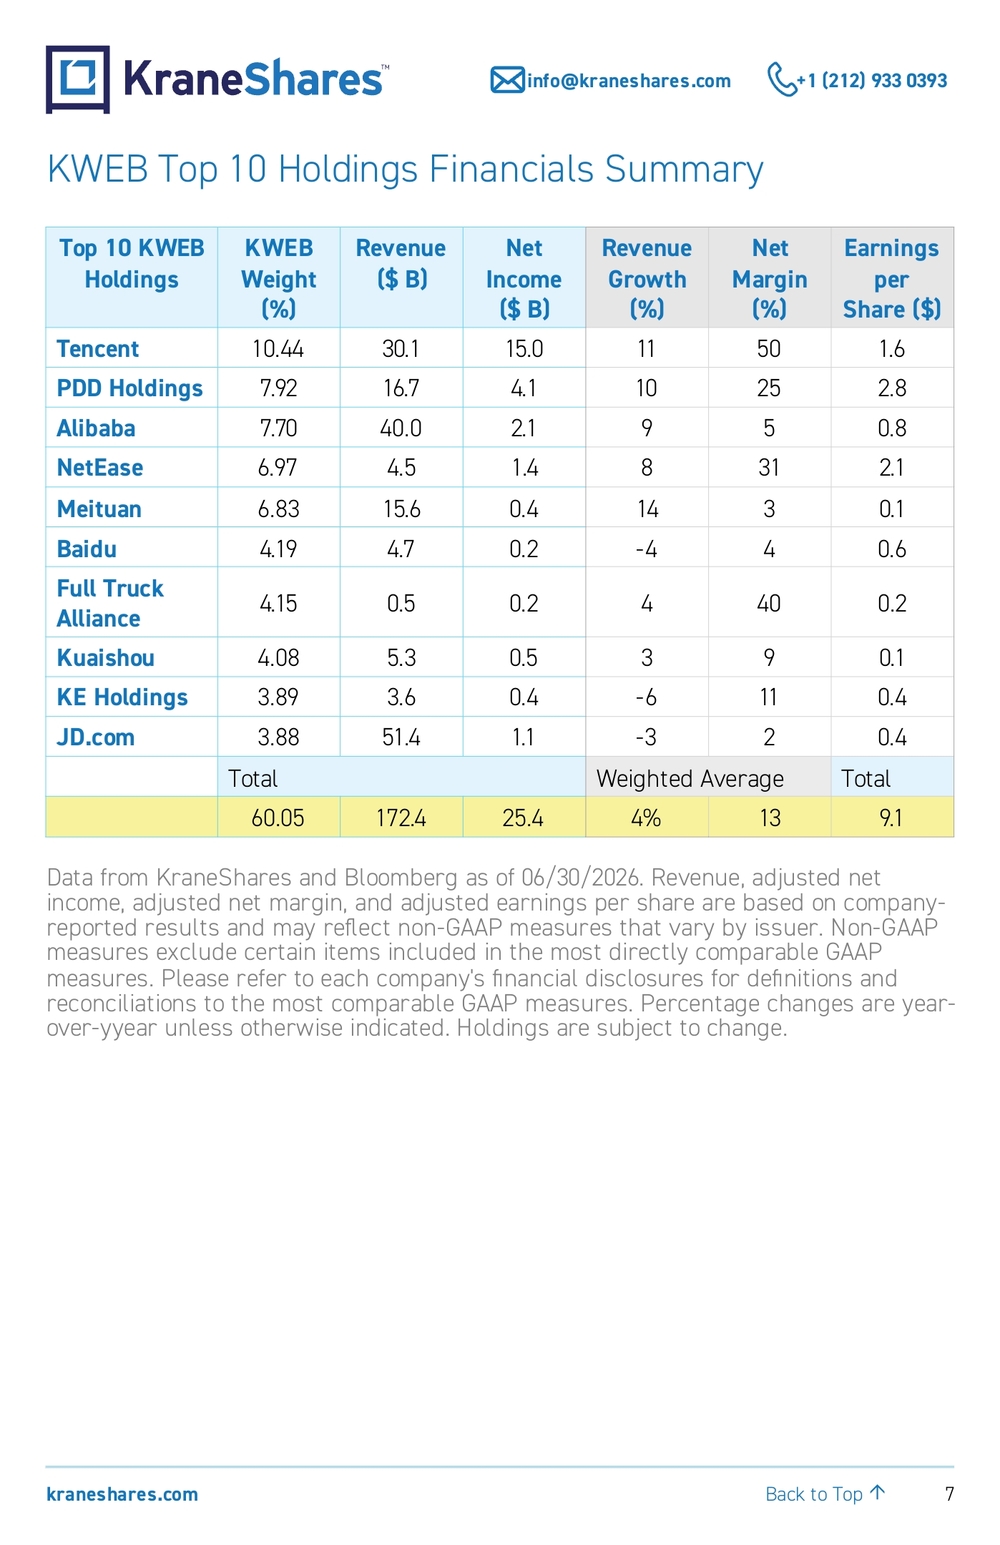
8 kraneshares.com info@kraneshares.com +1 (212) 933 0393 Back to Top ↑KWEB Key Metrics E-Commerce 23% Entertainment 12% Gaming 11%Local Services 8%Travel 7%Social Media 6%Healthcare 6%AI & Cloud 5%FInTech 5%Real Estate 4%Recruitment 4%Education 4%Live Streaming 3%Traditional SearchAutoKWEB Subsector Breakdown 1%1% Data from KraneShares as of 6/30/2026. Based on estimated revenue sources for KWEB holdings in cases where the underlying companies do not break out revenue precisely into the above categories.
9 kraneshares.com info@kraneshares.com +1 (212) 933 0393 Back to Top ↑12172227323742 31-JAN-2023 31-MAR-2023 31-MAY-2023 31-JUL-2023 29-SEP-2023 30-NOV-2023 31-JAN-2024 29-MAR-2024 31-MAY-2024 31-JUL-2024 30-SEP-2024 29-NOV-2024 31-JAN-2025 31-MAR-2025 31-MAY-2025 31-JUL-2025 30-SEP-2025 30-NOV-2025 31-JAN-2026 31-MAR-2026 31-MAY-2026 31-JUL-2026Price to Earnings (P/E) KWEB US Internet Data from FactSet as of 8/18/2026. China Internet is represented by the holdings of KWEB. US Internet is represented by the Dow Jones US Internet Index Please see the end of the report for definitions.
10 kraneshares.com info@kraneshares.com +1 (212) 933 0393 Back to Top ↑Data from Bloomberg, Vestigia Labs, and KraneShares as of 6/30/2026. For NetEase Music, Ali Health, XD, and Zhong An Insurance, semi-annual results for the first half of 2026 are used. Q2 2026 year-over-year changes are used for all others.-40-30-20-100102030405060 AI & Cloud Education Travel Local Services Social Media Recruitment Healthcare Gaming Logistics FinTech Live Streaming E-Commerce Entertainment Traditional Search Real EstateAutos% Change year -over-yearSubsector Revenue Growth
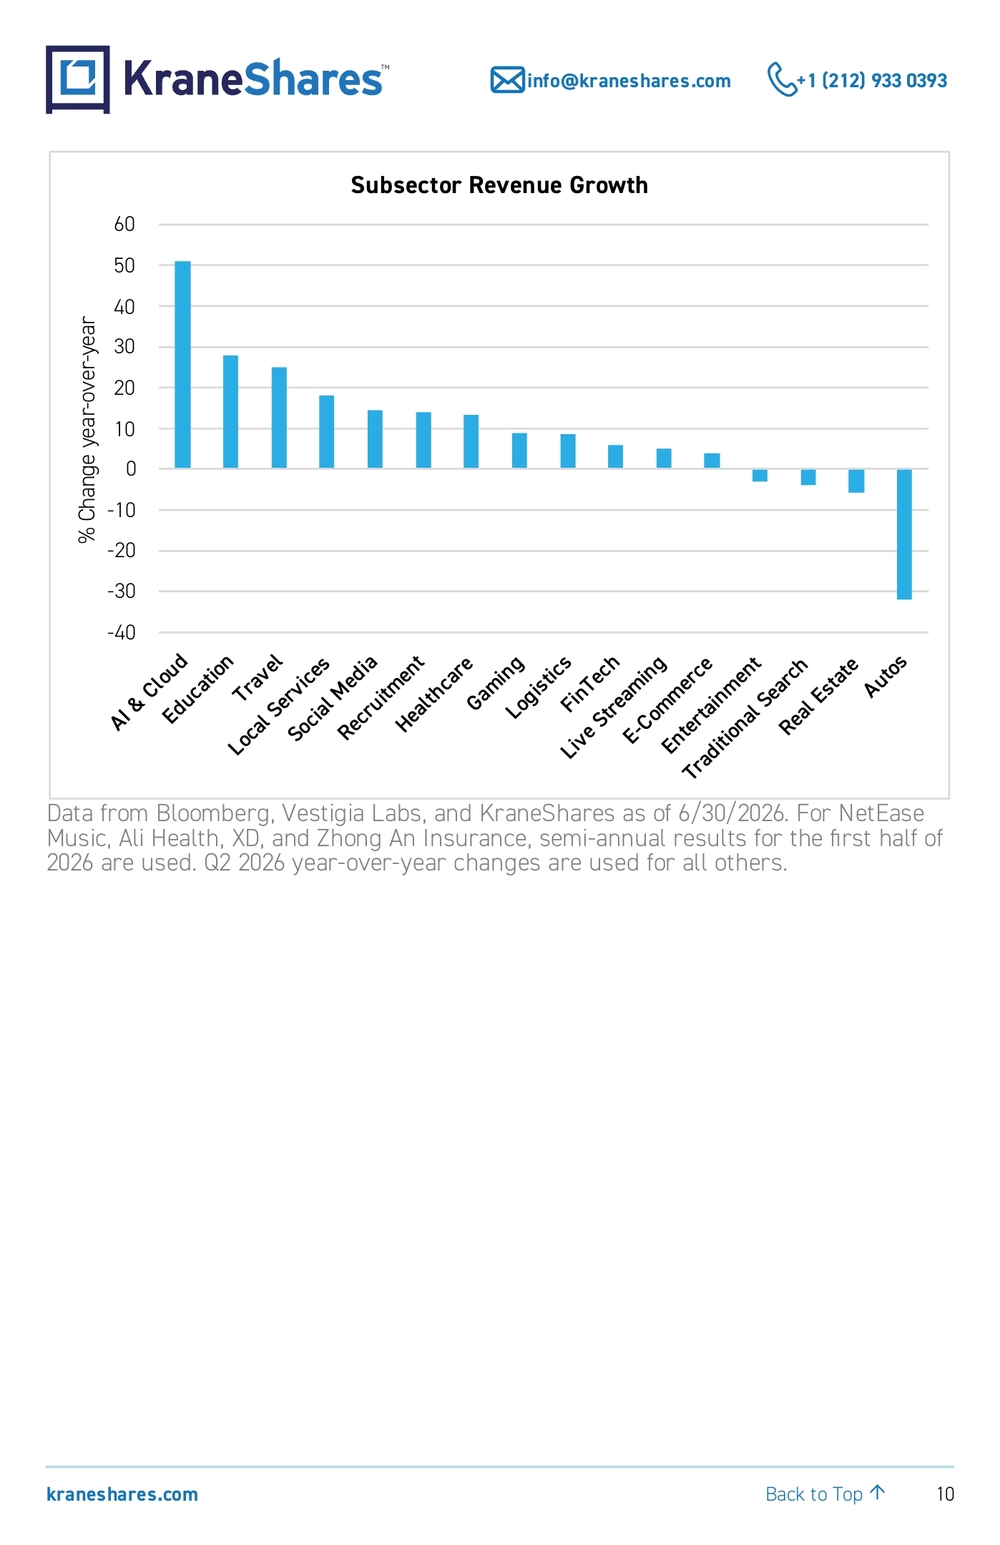
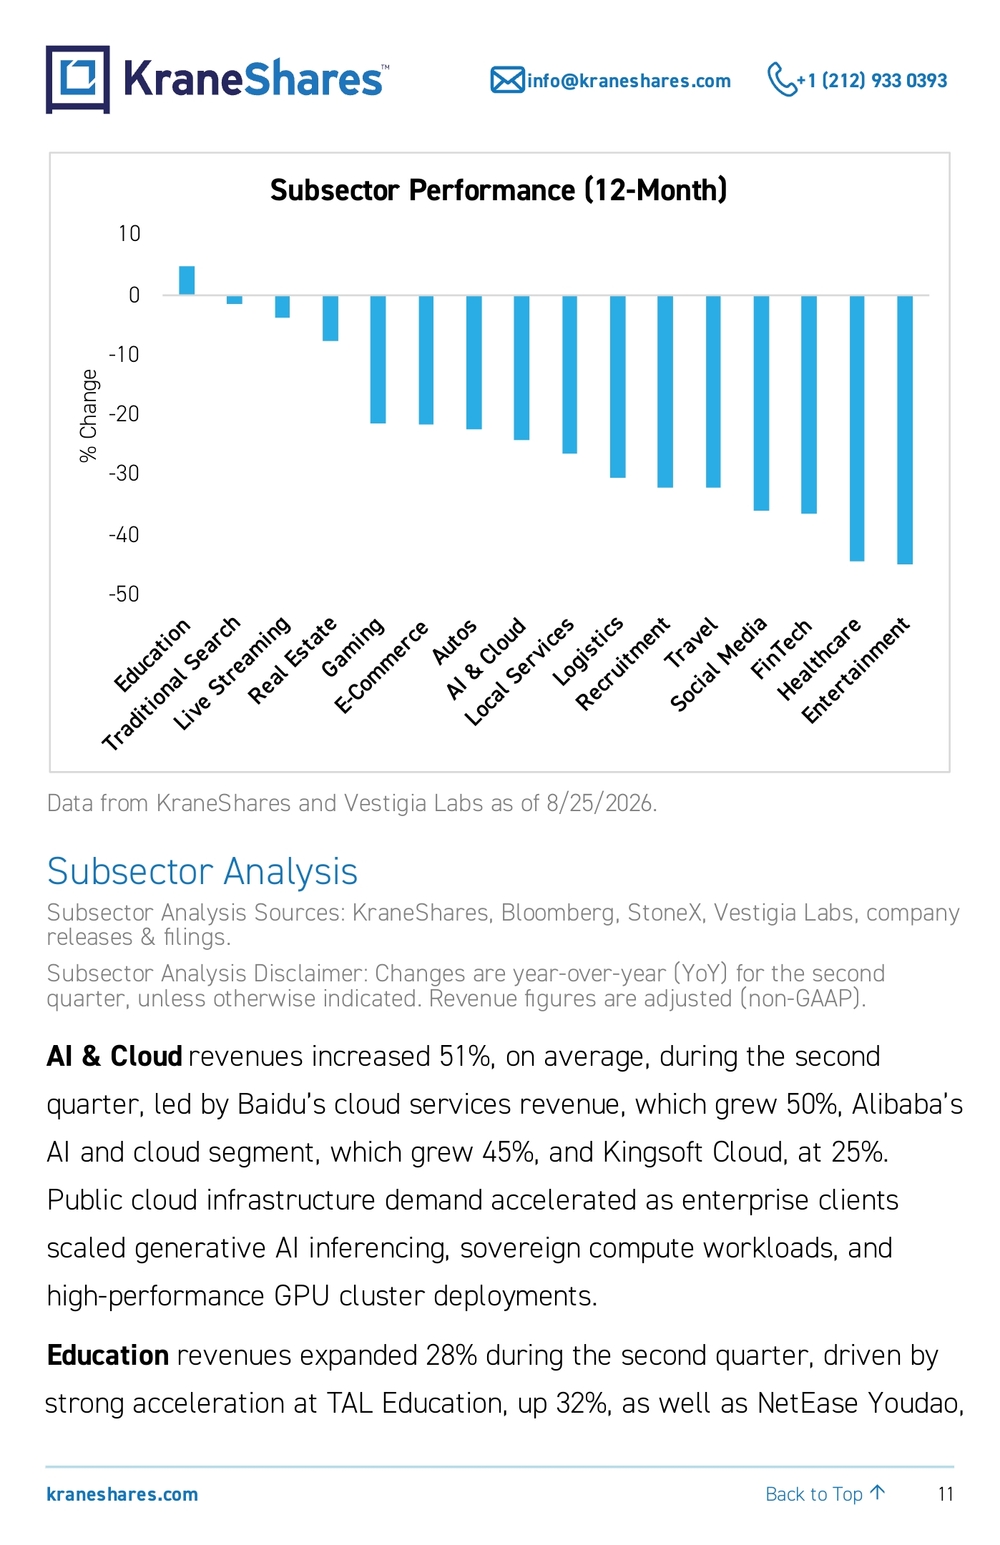
11 kraneshares.com info@kraneshares.com +1 (212) 933 0393 Back to Top ↑-50-40-30-20-10010 Education Traditional Search Live Streaming Real Estate Gaming E-Commerce Autos AI & Cloud Local Services Logistics Recruitment Travel Social Media FinTech Healthcare Entertainment% ChangeSubsector Performance (12-Month) Data from KraneShares and Vestigia Labs as of 8/25/2026. Subsector Analysis Subsector Analysis Sources: KraneShares, Bloomberg, StoneX, Vestigia Labs, company releases & filings. Subsector Analysis Disclaimer: Changes are year-over-year (YoY) for the second quarter, unless otherwise indicated. Revenue figures are adjusted (non-GAAP). AI & Cloud revenues increased 51%, on average, during the second quarter, led by Baidu’s cloud services revenue, which grew 50%, Alibaba’s AI and cloud segment, which grew 45%, and Kingsoft Cloud, at 25%. Public cloud infrastructure demand accelerated as enterprise clients scaled generative AI inferencing, sovereign compute workloads, and high-performance GPU cluster deployments. Education revenues expanded 28% during the second quarter, driven by strong acceleration at TAL Education, up 32%, as well as NetEase Youdao,
12 kraneshares.com info@kraneshares.com +1 (212) 933 0393 Back to Top ↑up 4%. Growth may have been supported by surging institutional and individual demand for AI-enabled learning devices, algorithmic tutoring hardware, and offline learning centers. Travel revenues advanced 25%, likely supported by surging cross-border mobility at Trip.com, up 17%, and Tongcheng Travel, up 14%. Hotel and flight bookings across Southeast Asia, Japan, and Europe surpassed baseline levels, supported by expanded visa-free bilateral travel agreements. Local Services revenues increased 18%, anchored by Alibaba’s instant commerce division, up 45% in Q1, though JD’s New Businesses division, which includes instant commerce, contracted -48%. For Meituan and other platforms, in-store merchant dining and lifestyle service vouchers drove robust transaction volume growth across Tier-1 through Tier-4 cities during the quarter. Social Media revenues advanced 15% during the second quarter, likely lifted by targeted algorithmic advertising spending across Tencent’s marketing services, up 22 %, Bilibili, up 30%, JOYY’s social platform, up +31%, and Kuaishou, up 4.4%. Ad load optimization across Weixin Video Accounts and social feed formats may have contributed to strong brand and performance advertising spend. Recruitment subsector platform revenues grew 14% during the second quarter. Kanzhun’s BOSS Zhipin platform, which saw paid enterprise customer counts reach a record high. Its expansion was supported by strong hiring demand across blue-collar services, advanced manufacturing, and supply chain logistics.
13 kraneshares.com info@kraneshares.com +1 (212) 933 0393 Back to Top ↑Healthcare revenues advanced 13%, anchored by digital pharmacy expansion at JD Health International, up 16% YoY in the first half of 2026, alongside Ali Health, up 12% in the first half of 2026. Growth may have been supported by an increase in online sales of chronic disease prescription drugs, the expansion of many corporate healthcare benefit programs, and the establishment of more 30-minute on-demand pharmaceutical delivery zones. Gaming revenues expanded 9%, underpinned by an acceleration in legacy titles for Tencent, which saw a 12% increase in gaming revenue globally and 17% domestically, and NetEase, up 10%. Established franchise titles generated resilient cash flows, while newly launched anime and action titles contributed to the incremental summer engagement. Logistics subsector revenues increased 9% during the reporting cycle, reflecting supply chain delivery volume at JD Logistics, up 24%, and freight monetization at Full Truck Alliance, up 4%. Full Truck Alliance expanded active shipper counts as standardized road transport contracts, and digital toll integration helped the platform attract more customers. FinTech revenues advanced 6%, supported by commercial payment volume resilience at payments giant Tencent, up 9%, strong growth at lender Qfin, up 25%, and Zhong An Insurance, up 6%. Transaction processing fees may have benefited from steady consumer daily spending volumes and increased offline merchant payment penetration. Live Streaming revenues managed 5% growth. Strong E-Commerce live streaming expansion at East Buy, up 30% in the 12 months ended June 30, 2026, and Joyy, up 4%, were partially offset by a -14% contraction in Kuaishou's live streaming segment.
14 kraneshares.com info@kraneshares.com +1 (212) 933 0393 Back to Top ↑E-Commerce revenues grew 4%, anchored by Alibaba, up 4%, PDD Holdings, up 11%, East Buy, up 30%, and Vipshop, up 1%. Meanwhile, JD.com, NetEase, and Bilibili experienced declines in their E-Commerce revenue. Consumption dynamics resulted in strength in price-competitive value merchandising, benefiting PDD, while a slowdown in sales of appliances and other large-ticket items weighed on JD.com. Meanwhile, the quarter also saw steady expansion in cross-border digital retail for multiple platforms. Entertainment revenues declined -3%, mostly due to a signidicant revenue decline for China Ruyi Holdings. However, digital content monetization was positive across Tencent Music, up 6%, Bilibili, up 4%, NetEase Cloud Music, up 3%, and ticketing platform Damai Entertainment, up 20%. Paying user conversion rates reached record highs across digital audio and long-form video platforms, supported by proprietary artist releases and theatrical concert ticketing. Traditional Search revenue declined -4% amidst ongoing AI conversational search integration. Real Estate platform KE Holdings, whose revenue was down -6%, experienced a particular contraction in home renovation and rental property management services. However, the transaction volume of new and existing home sales picked up during the quarter, which we believe to be a positive sign for China’s real estate market overall. Auto sales platform Autohome’s revenues contracted -32% as lead generation services and online marketplace vehicle sales fell due to intense domestic price competition across original equipment manufacturers (OEMs).
15 kraneshares.com info@kraneshares.com +1 (212) 933 0393 Back to Top ↑Theme Highlight – Are China’s AI Models The New Global Stars? China’s AI models may be becoming the new global stars. Certain US and global technology firms have reported using lower-cost, China-developed large language models (LLMs) for certain applications. We believe this development could significantly benefit China’s internet sector by providing AI leaders, including KWEB holdings Minimax, Z.ai, Alibaba, and Tencent, with a stable and diversified revenue stream. It may also lead global markets to recognize these firms for the central roles they play not only in China’s AI ecosystem, but also in AI development globally. Meanwhile, China-based models may benefit from increasing pricing power, while US-based models may become less profitable if they must lower prices to compete. Why China’s LLMs? China’s LLM providers, such as Alibaba’s Qwen, DeepSeek, Tencent’s Hunyuan, Baidu’s Ernie Bot, Z.ai, and Minimax, offer what they ,may see as an attractive value proposition to global corporations. We believe LLMs
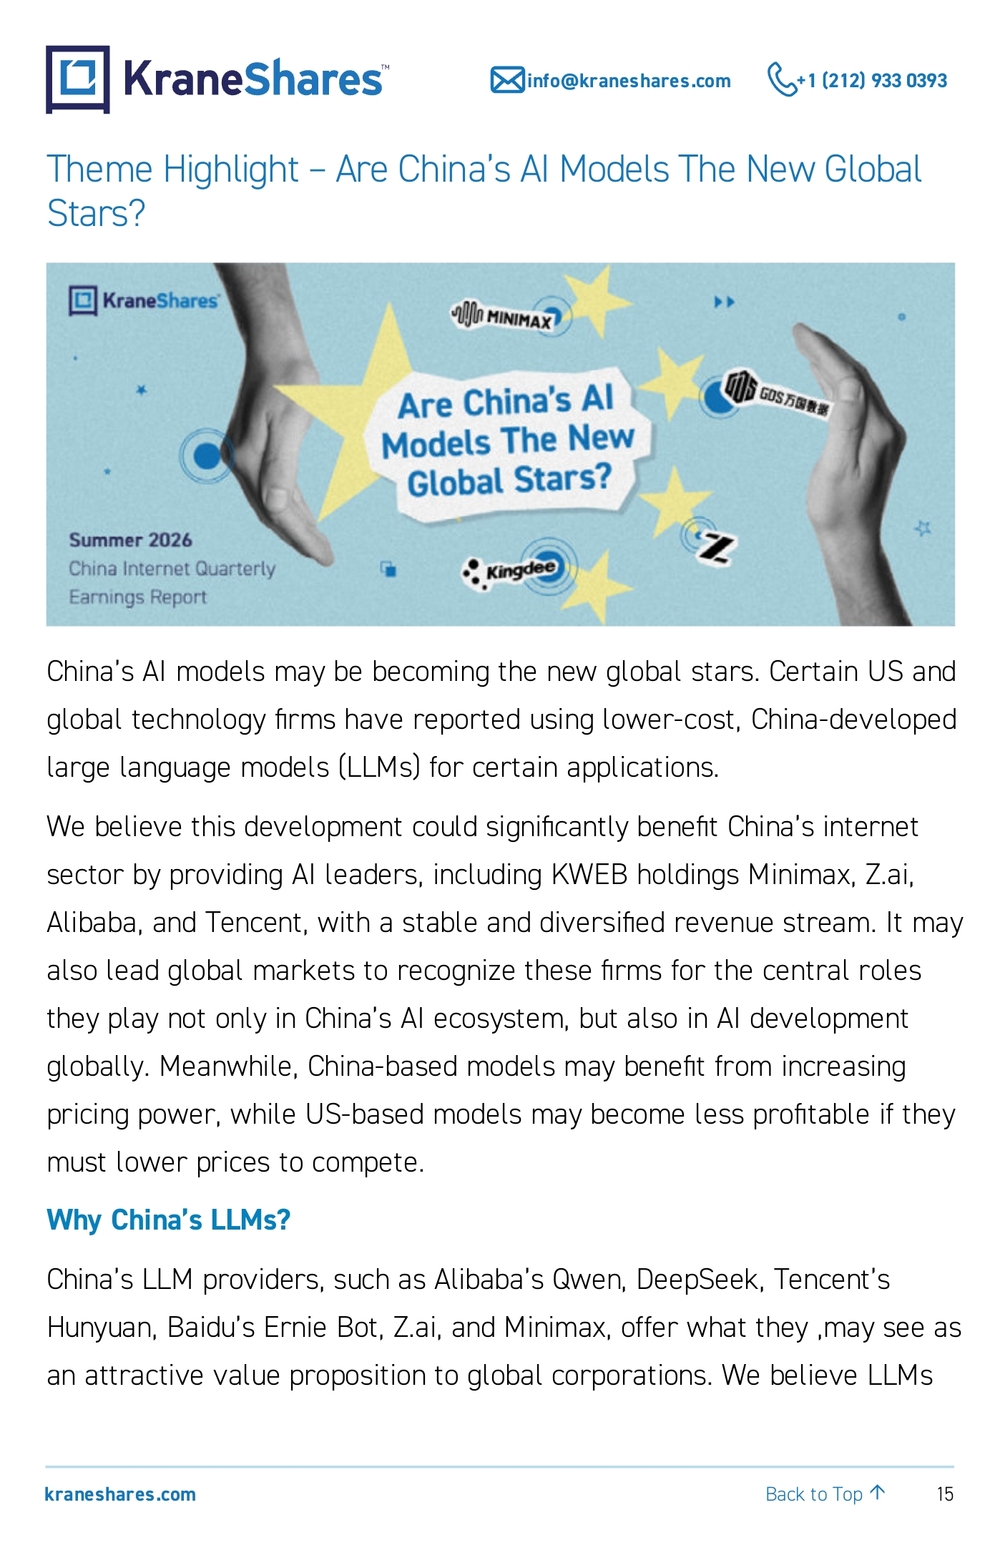
16 kraneshares.com info@kraneshares.com +1 (212) 933 0393 Back to Top ↑from these providers generally offer greater versatility, open architecture, and significantly lower token pricing than their US counterparts, like Anthropic and OpenAI. Earlier this year, businesses worldwide expressed concerns about rapidly rising bills from Anthropic and OpenAI. Many are now shifting their workloads toward cheaper alternatives, which often include China-based, open-source, and open-weight models.7 Based on published token pricing data, China-based models are charging as little as 18 cents per million tokens, compared to an average of around $4 for top U.S. models.8 00.511.522.533.544.5 China-Based Mo dels US Models$Average Token Cost Data from Hugging Face as of 6/30/2026. Based on comparisons of Qwen, DeepSeek, GLM, GPT, and Claude. Assumes token purchasing power parity. Of course, in life as in business, you tend to get what you pay for and China’s LLMs are not always the most cutting-edge. However, in our view, they offer unique advantages that make for a compelling overall value proposition for certain customers.
17 kraneshares.com info@kraneshares.com +1 (212) 933 0393 Back to Top ↑Most China-based models, including Alibaba’s Qwen, are highly versatile and can be customized down to the parameter level, a feature also called being “open weight”. This means that companies can run them on their own infrastructure, fine-tune them internally, and avoid paying premium compute prices for every workload. That matters, especially for coding assistants, customer service, enterprise search, and internal automation tasks, where the absolute best, most cutting-edge model is not always economically justified. Using the most cutting-edge LLM to direct calls, for example, is comparable to buying a Ferrari just to take trips to the grocery store. A simple, reliable model works just fine for this task, which is unlikely to become more complicated or even benefit at all from updates. Evidence of U.S. and Global Adoption Thousands of US-based startups, companies, and academic researchers are now relying on Chinese open-source models, based on data from Hugging Face.8 At the same time, many of Silicon Valley’s AI startups have built applications at least partly on open-source models from DeepSeek, Moonshot AI, and Z.ai.12 Shopify and Airbnb have touted the benefits of Alibaba’s Qwen 3 for scaling AI features. Meanwhile, Airbnb’s CEO Brian Chesky said that the booking site relies heavily on Alibaba’s Qwen because it is “very good, fast, and cheap.”10 Lastly, cryptocurrency platform Coinbase said it has begun using open-weight models from Z.ai to cut nearly half its AI spending, despite increased token use.11
18 kraneshares.com info@kraneshares.com +1 (212) 933 0393 Back to Top ↑Price Advantage & Segmentation Companies are likely to reserve premium U.S. models for high-stakes reasoning and frontier use cases. At the same time, we believe they will increasingly shift routine generation, support, and coding tasks to cheaper, open-weight models developed in China. This means that while China-based models are likely to see increasing demand from global corporations, they are unlikely to fully replace existing, premium models in key areas. Why Now? Several structural forces are converging all at the same time: •Cost Inflation in Frontier AI: Seemingly, certain enterprises are reacting to rising inference bills from premium U.S. models by shifting noncritical workloads to lower-cost alternatives. •Geopolitical Fragmentation: Export controls and procurement restrictions are creating parallel technology stacks, which increases the value and diversity of non-U.S. options. •Cap-Ex Strategy Divergence: While US hyperscalers are investing heavily in their underlying semiconductor supply chain, their China- based counterparts have focused more on users’ needs today, providing them with subsidies and concessions and, in some cases, foregoing near-term profitability.In our view, this has led to a glut of affordable models and compute coming from China.
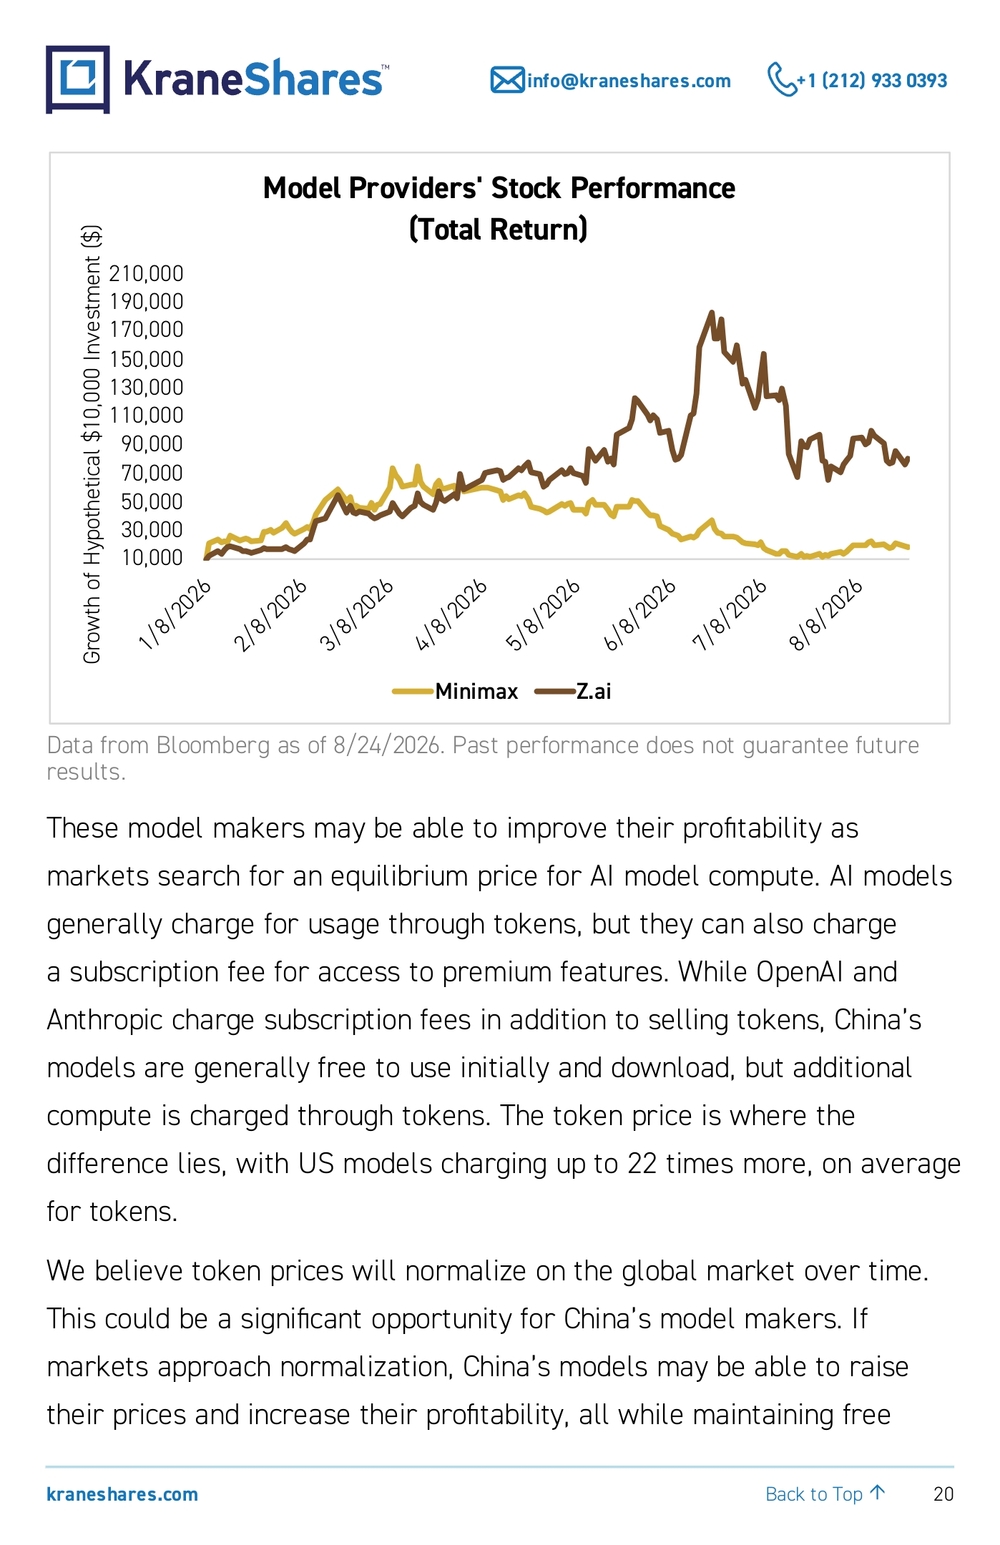
19 kraneshares.com info@kraneshares.com +1 (212) 933 0393 Back to Top ↑Implications for Investors For investors, we believe the key takeaway is that China AI is moving from a domestic substitution story to a global price-disruption story, especially in model inference. The direct beneficiaries may include the China-based open-weight model developers and cloud providers that support those models. These include Minimax, Z.ai, Alibaba, and Tencent, which are companies that KWEB currently offers exposure to. Markets have already placed a premium on China’s model makers, leading to strong performance that we believe has been driven by the assumption that they can compete with major US models on cost and efficiency. Current KWEB holdings Minimax and Z.ai, which focus exclusively on delivering and customizing models, are up 88% and 661%, respectively, since their IPOs on January 9th and 8th of this year, respectively, as of August 24, 2026.
20 kraneshares.com info@kraneshares.com +1 (212) 933 0393 Back to Top ↑10,00030,00050,00070,00090,000110,000130,000150,000170,000190,000210,000 1/8/2026 2/8/2026 3/8/2026 4/8/2026 5/8/2026 6/8/2026 7/8/2026 8/8/2026Growth of Hypothetical $10,000 Investment ($)Model Providers' Stock Performance (Total Return) Minimax Z.ai Data from Bloomberg as of 8/24/2026. Past performance does not guarantee future results. These model makers may be able to improve their profitability as markets search for an equilibrium price for AI model compute. AI models generally charge for usage through tokens, but they can also charge a subscription fee for access to premium features. While OpenAI and Anthropic charge subscription fees in addition to selling tokens, China’s models are generally free to use initially and download, but additional compute is charged through tokens. The token price is where the difference lies, with US models charging up to 22 times more, on average for tokens. We believe token prices will normalize on the global market over time. This could be a significant opportunity for China’s model makers. If markets approach normalization, China’s models may be able to raise their prices and increase their profitability, all while maintaining free
21 kraneshares.com info@kraneshares.com +1 (212) 933 0393 Back to Top ↑access and free downloads to keep their flexibility and competitive edge. We believe US-based models may need to lower their token prices, which could negatively impact their profitability. Conclusion We believe China’s AI models have become the latest global AI stars as US and global technology firms seem to be increasingly using them for simple workloads, taking advantage of significant cost savings. We believe this development could significantly benefit China’s internet sector by providing AI leaders, including KWEB holdings Minimax, Alibaba, and Tencent, with a diversified revenue stream. It may also help global markets recognize these firms for the central roles they play not only in China’s AI ecosystem, but also in AI development globally. Meanwhile, China’s model makers may have a chance to increase their token prices as the global market searches for an equilibrium price.
22 kraneshares.com info@kraneshares.com +1 (212) 933 0393 Back to Top ↑KWEB Top 10 Holdings Earnings Update Sources: Bloomberg, CICC Research, The Benchmark Company, company releases & filings, KraneShares. Changes are year-over-year unless otherwise indicated. All figures are adjusted (non-GAAP) Tencent Tencent is a diversi fied consumer technology company with businesses in social media, AI cloud services, payments, and online advertising. Tencent’s most well-known product is WeChat, one of China’s premier social media platforms, with over 1 billion monthly active users (MAUs). Tencent’s Hunyuan chatbot is also available through WeChat. Tencent By The Numbers (Q2 2026) •Revenue +11% to RMB 204.8B ($30.1B) •Net Income RMB 101.0B ($15.0B) •Net Margin 50% •Earnings per Share RMB 11.0 ($1.6) Tencent’s bottom line disappointed. However, we believe one of the most notable aspects of Tencent's release was the company’s free cash flow statement. Free cash flow was RMB -13.8 billion after executing RMB 59.3 billion in capital expenditures, up 60% from the second quarter, which the company mostly attributed to stepped-up purchases of AI computing power. For illustrative purposes, free cash flow excluding the RMB 51.7 billion in AI compute procurement spending would have been positive RMB 37.9 billion. This is a KraneShares calculation and is not a company-reported measure of free cash flow. By comparison, Alphabet generated $39 billion in operating cash flow in the second quarter and spent $45 billion on capital expenditure, resulting in free cash flow of
23 kraneshares.com info@kraneshares.com +1 (212) 933 0393 Back to Top ↑-$6 billion. Investors reacted poorly to the ramp-up in spending for Tencent. However, we believe that viewing these expenditures, whether by Tencent or Alphabet, as entirely negative is like declaring a restaurant unprofitable because it used the cash from its first location to open a second. It confuses the cash-flow profile of growth with the quality of the underlying assets. Meanwhile, Tencent demonstrated significant growth in revenue, which may be attributed to AI-driven advertising, as marketing services revenue increased by 22%. Merchants are increasingly using Tencent- native AI tools to target advertisements within Tencent's vast network that includes WeChat, one of China's most popular social media and messaging platform. Domestic games revenue was also a bright spot, increasing 17% amid a slew of new games approvals. PDD Holdings PDD is an innovative global E-Commerce platform focused on the user experience and was one of the fi rst to embrace a social media-like model for online shopping. The company’s apps are known for their group-buying capabilities, inserting gaming into shopping and earning coupons, and discounted prices for private-label goods. PDD is also famous for pioneering to lower overhead costs through an on-demand manufacturing model. PDD operates under the name “Pinduoduo” in China and “Temu” in the rest of the world.
24 kraneshares.com info@kraneshares.com +1 (212) 933 0393 Back to Top ↑PDD By The Numbers (Q2 2026) •Revenue +10% to RMB 112.4B ($16.7B) •Net Income RMB 27.2B ($4.1B) •Net Margin 25% •Earnings per Share RMB 18.5 ($2.8) PDD Holdings missed analysts’ revenue targets but beat estimates on adjusted net income and adjusted earnings per share (EPS). The latter declined year-over-year (YoY), though it still beat management expectations. In the analyst Q&A, management noted that “In the first half of the year, consumption support policies continue to take effect, China’s consumer market expanded steadily, and online retail penetration continued to grow. We remain confident in the long-term potential of China’s consumer market and e-commerce industry.” Given the company’s global orientation, it was interesting that they highlighted the China platform’s performance as standing out. Alibaba Alibaba is a conglomerate primarily engaged in E-Commerce. The company operates an online marketplace offering a wide variety of consumer goods. The company has also expanded beyond E-Commerce and is now a consortium of six businesses covering cloud, domestic E-Commerce, global digital commerce, media, logistics, and local services. Alibaba By The Numbers (Q2 2026) •Revenue +9% to RMB 269.0B ($40.0B) •Net Income RMB 13.8B ($2.1)
25 kraneshares.com info@kraneshares.com +1 (212) 933 0393 Back to Top ↑ •Net Margin 5% •Earnings per Share RMB 5.1 ($0.8) Alibaba reported a top-line revenue beat versus analyst expectations, though the bottom line disappointed. The culprit was AI-driven capital expenditures, which surged +75% YoY to RMB 67.68 billion ($9.98 billion), driven by “continued investments in AI infrastructure to meet strong and growing customer demand.” Management noted that their cumulative capital expenditure (capex) target is RMB 380 billion, of which they have already spent RMB 190 billion. We believe it is important to note that Alibaba’s AI capex experiences volatility due to price changes for chips as well as policy-driven changes in suppliers. Essentially, the company is halfway through its current capex cycle. Better monetization of cloud computing was a bright spot during the quarter, along with improving unit economics and top-line growth in instant commerce, though the unit is likely to remain unprofitable until 2029. Unfortunately, there was no mention of the restaurant delivery war nor of regulatory efforts to curtail it during the earnings call. NetEase NetEase is a consumer information technology company that primarily produces online, PC, and mobile games. It is one of the largest gaming companies in the world, and its titles include Knives Out and Naraka: Bladepoint . NetEase also currently distributes games for Microsoft in China.
26 kraneshares.com info@kraneshares.com +1 (212) 933 0393 Back to Top ↑NetEase By The Numbers (Q2 2026) •Revenue +8% to RMB 30.1B ($4.5B) •Net Income RMB 9.2B ($1.4) •Net Margin 31% •Earnings per Share RMB 14.2 ($2.1) NetEase exceeded analyst expectations for top-line revenue growth but came up short of expectations for bottom-line net income. The game maker demonstrated robust top-line growth driven by franchises like Fantasy Westward Journey and Eggy Party, which fueled a 9.7% gaming revenue surge. Meanwhile, platform revenue-sharing costs drove a gross margin expansion. However, net income still missed due to an increase in the company’s effective tax rate, investment losses, and higher overall operating expenses. Nonetheless, the company maintains a strong balance sheet with RMB 168 billion in cash reserves. NetEase also declared a $0.48 per American depositary share (ADS) dividend for the quarter. Meituan Meituan is an E-Commerce company that specializes in food delivery and other local services. The company operates many business lines, including general retail, restaurant booking, and travel booking services, and it serves over 600 million registered users. Meituan is one of China’s leading “super apps” that offer a wide variety of services, including those from third parties.
27 kraneshares.com info@kraneshares.com +1 (212) 933 0393 Back to Top ↑Meituan By The Numbers (Q2 2026) •Revenue +14% to RMB 104.6B ($15.6B) •Net Income RMB 2.5B ($0.4B) •Net Margin 3% •Earnings per Share RMB 0.4 ($0.1) Meituan beat analyst expectations in the second quarter, but, more importantly, returned to profitability for the first time in four quarters. After spending heavily to defend its position in the food delivery market against new entrant JD.com, Meituan appears to have finally found its footing again. The subsidy competition had destroyed the bottom lines of both JD.com and Meituan. During the earnings call, management mentioned equity investments in AI model provider Z.ai and robotics company Unitree. Baidu Baidu is a technology company with substantial businesses in arti ficial intelligence, search engines, cloud computing, mobility solutions, and more. Baidu operates China’s most popular search engine. Meanwhile, Baidu’s ERNIE AI chatbot has over 100 million users, and its Apollo program operates the world’s largest fl eet of robo-taxis. Baidu By The Numbers (Q2 2026) •Revenue -4% to RMB 31.3B ($4.7B) •Net Income RMB 1.3B (0.2B) •Net Margin 4% •Earnings per Share RMB 3.9 ($0.6)
28 kraneshares.com info@kraneshares.com +1 (212) 933 0393 Back to Top ↑Baidu missed expectations in the second quarter. However, the company's strong AI efforts were on full display, as cloud computing revenue increased 50% YoY to RMB 7.30 billion, though it was down -17% quarter-over-quarter (QoQ). Meanwhile, the legacy traditional search- driven advertising continues to decline as a percentage of revenue. The company announced it should become eligible for Southbound Stock Connect this year after a shareholder vote on August 26th. Full Truck Alliance Logistics app Full Truck Alliance, sometimes called the “Uber of trucking,” is leading the way in its field with a mission of eliminating empty trucks from the roads. Its platform connects small-scale shippers with independent truckers who happen to have excess capacity on desired routes. It also provides financing and other auxiliary services to shippers. Full Truck Alliance By The Numbers (Q2 2026) •Revenue +4% to RMB 3.4B ($0.5B) •Net Income RMB 1.4B ($0.2B) •Net Margin 40% •Earnings per Share RMB 1.3 ($0.2) The company’s core growth engine, transaction services, increased 33% to account for over 50% of total revenue, driven by higher commission penetration, record fulfillment rates, and additional services to attract clients, including standardized road transport contracts and digital toll integration. Meanwhile, cash generation was robust, as free cash flow exceeded RMB 2 billion, up from less than RMB 1.5 billion in the first quarter. However, credit solutions revenue contracted amid a slight
29 kraneshares.com info@kraneshares.com +1 (212) 933 0393 Back to Top ↑increase in non-performing loans. The company also declared a $0.08 per share dividend, as part of a $400 million payout plan for 2026, while issuing Q3 guidance that significantly outpaced Wall Street estimates. Kuaishou Kuaishou is a video platform that has historically specialized in short- form videos, hence its name, which translates literally as “quick hand”. The company has developed an entertainment platform similar to YouTube as well as a livestreaming E-Commerce platform. The company also runs Kling AI, one of the most popular video generation tools worldwide. Kuaishou By The Numbers (Q2 2026) •Revenue +3% to RMB 35.5B ($5.3B) •Net Income RMB 3.1B ($0.5) •Net Margin 9% •Earnings per Share RMB 0.7 ($0.1) Kuaishou exceeded expectations on its top line revenue, but disappointed on bottom line net income due to heavy investments in AI compute. Kuaishou’s core growth engine, online advertising and digital marketing services tied to its entertainment platform, remained resilient despite a challenging macroeconomic backdrop. Meanwhile, Kling AI generated over RMB 850 million in revenue and secured an additional $2.8 billion in financing from Tencent and Alibaba. However, Kuaishou’s profitability was constrained during the quarter by increased payouts to creators and investments in AI computing power, while live streaming revenue came under pressure.
30 kraneshares.com info@kraneshares.com +1 (212) 933 0393 Back to Top ↑KE Holdings KE Holdings, also known as “Beike” is China's leading integrated online and offline platform for housing transactions and services, headquartered in Beijing. Founded in 2001 through its Lianjia brokerage brand, the company connects agents and customers via its proprietary Agent Cooperation Network (ACN) across five segments: existing home sales, new home sales, home renovation, home rental, and other emerging services. KE Holdings By The Numbers (Q2 2026) •Revenue -6% to RMB 24.5B ($3.6B) •Net Income RMB 2.6B ($0.4) •Net Margin 11% •Earnings per Share RMB 2.4 ($0.4) Although KE Holdings was more profitable than expected in the second quarter, its top line revenue came in slightly below what analysts had predicted. The platform experienced a particular contraction in home renovation and rental property management services. However, the transaction volume of new and existing home sales picked up during the quarter, a positive sign for China’s real estate market overall. JD.com JD.com is one of the largest E-Commerce platforms in China. JD owns a large and growing marketplace for a wide variety of goods and offers its own logistics service. JD offers its services to over 500 million users.