KCSH ETF: Sustainable Short Duration Bond ETF | KraneShares
by Kraneshares
info@kraneshares.com KCSH Opportunities from Sustainable Ultra Short Duration Fixed Income An Overview of the KraneShares Sustainable Ultra Short Duration Index ETF (Ticker: KCSH) 6/30/2026
2
Introduction to
KraneShares
About KraneShares
Krane Funds Advisors, LLC
is a specialist investment manager
focused on China, Carbon, Climate, and other uncorrelated
assets. KraneShares seeks to provide innovative, high
conviction, and first to market strategies. The firm was
founded in 2013 and manages for institutions and individuals
globally. In 2017, KraneShares formed a strategic partnership
with China International Capital Corporation (CICC) when they
acquired a majority ownership stake. The firm is a signatory
of the United Nations
supported Principles for Responsible Investment (UN PRI). Sign up to our weekly carbon market blog www.climatemarketnow.com
Investment Strategy: KCSH tracks the Solactive ISS Sustainable Select 0
1 Year USD Corporate IG Index, which is designed to measure the performance of US dollar
denominated, investment
grade corporate debt with a maturity of up to one year. KCSH offers sustainably conscious investors exposure to high
quality, short
term corporate bonds. The index is comprised of a portfolio that is based on Institutional Shareholder Services (ISS) climate analysis and alignment with the Paris agreement’s 1.5 ° C scenario by 2050, while providing a distribution of credit and interest rate risk that is similar to commonly used ultra short duration, investment grade bond benchmarks. KCSH Overview: • KCSH offers access to investment grade, short term corporate debt securities with a maturity of up to one year. • Excludes issuers with revenue from fossil fuel production, exploration and distribution services, and other issuers that violate conscious investing screens categorically or based on ownership or revenue thresholds as determined by the index provider. • Yields near those in a short
duration broad investment grade bond exposure. Ultra Short Duration Features: • Offers a risk premium over money market funds, with potentially higher yield. • Less sensitive to interest rate risk than longer
duration fixed
income investments. • Generally has low correlation to traditional fixed income investments. KCSH KraneShares Sustainable Ultra Short Duration Index ETF Introduction 3
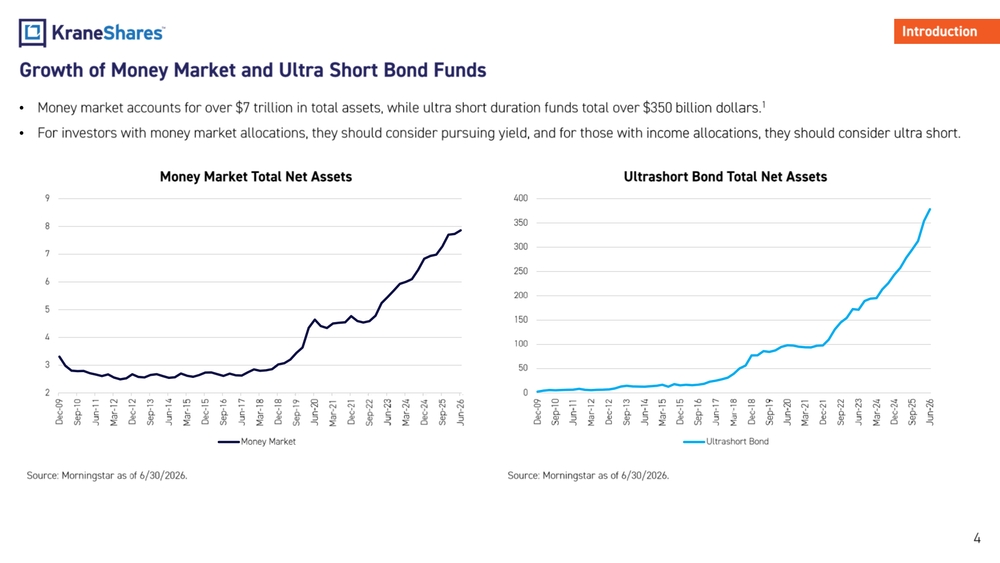
• Money market accounts for over $7 trillion in total assets, while ultra short duration funds total over $3 50 billion dollars. 1 • For investors with money market allocations, they should consider pursuing yield, and for those wit h income allocations, they should consider ultra short. Growth of Money Market and Ultra Short Bond Funds 4 Introduction Source: Morningstar as of 6/30/2026. Source: Morningstar as of 6/30/2026. 0 50 100 150 200 250 300 350 400 Dec-09 Sep-10 Jun-11 Mar-12 Dec-12 Sep-13 Jun-14 Mar-15 Dec-15 Sep-16 Jun-17 Mar-18 Dec-18 Sep-19 Jun-20 Mar-21 Dec-21 Sep-22 Jun-23 Mar-24 Dec-24 Sep-25 Jun-26 Ultrashort Bond Total Net Assets Ultrashort Bond 2 3 4 5 6 7 8 9 Dec-09 Sep-10 Jun-11 Mar-12 Dec-12 Sep-13 Jun-14 Mar-15 Dec-15 Sep-16 Jun-17 Mar-18 Dec-18 Sep-19 Jun-20 Mar-21 Dec-21 Sep-22 Jun-23 Mar-24 Dec-24 Sep-25 Jun-26 Money Market Total Net Assets Money Market
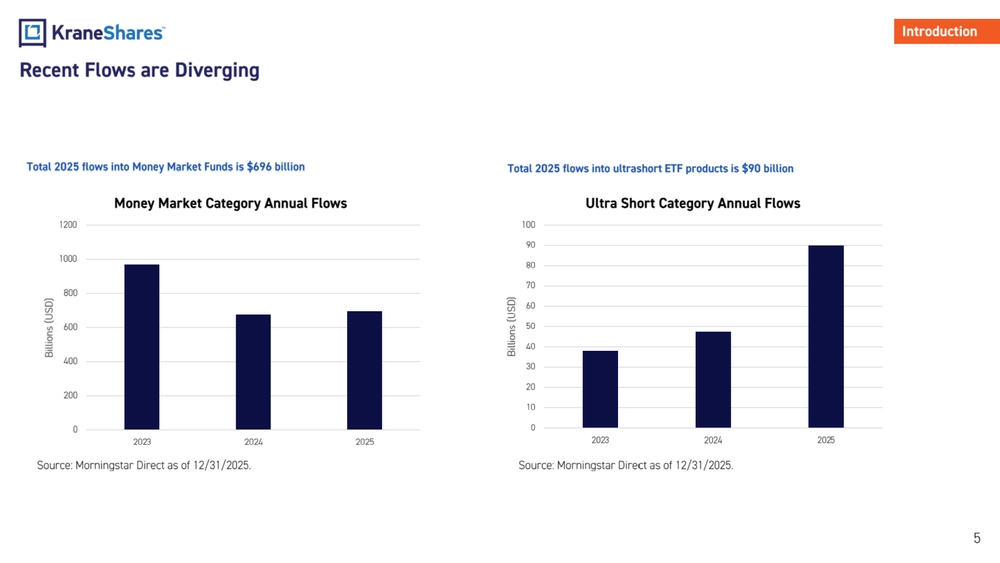
Recent Flows are Diverging 5 Total 2025 flows into ultrashort ETF products is $90 billion Total 2025 flows into Money Market Funds is $696 billion Source: Morningstar Direct as of 12/31/2025. Introduction Source: Morningstar Direct as of 12/31/2025. 0 200 400 600 800 1000 1200 2023 2024 2025 Billions (USD) Money Market Category Annual Flows 0 10 20 30 40 50 60 70 80 90 100 2023 2024 2025 Billions (USD) Ultra Short Category Annual Flows
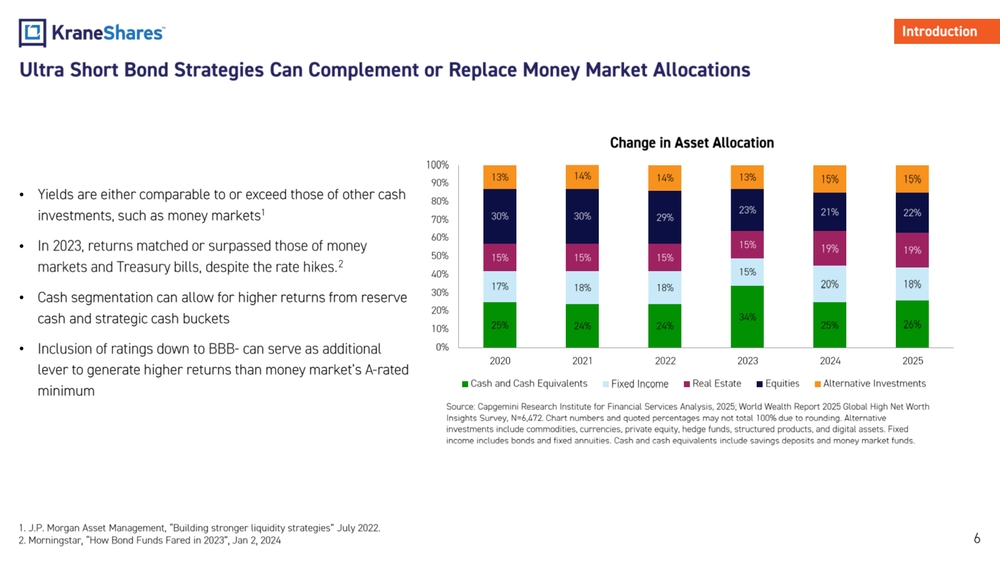
25% 24% 24% 34% 25% 26% 17% 18% 18% 15% 20% 18% 15% 15% 15% 15% 19% 19% 30% 30% 29% 23% 21% 22% 13% 14% 14% 13% 15% 15% 0% 10% 20% 30% 40% 50% 60% 70% 80% 90% 100% 2020 2021 2022 2023 2024 2025 Change in Asset Allocation Cash and Cash Equivalents Fixed Income Real Estate Equities Alternative Investments• Yields are either comparable to or exceed those of other cash investments, such as money markets 1 • In 2023, returns matched or surpassed those of money markets and Treasury bills, despite the rate hikes. 2 • Cash segmentation can allow for higher returns from reserve cash and strategic cash buckets • Inclusion of ratings down to BBB
can serve as additional lever to generate higher returns than money market’s A
rated minimum Ultra Short Bond Strategies Can Complement or Replace Money Market Allocations 6 Introduction Source: Capgemini Research Institute for Financial Services Analysis, 2025; World Wealth Report 2025 Global High Net Worth Insights Survey, N=6,472. Chart numbers and quoted percentages may not total 100% due to rounding. Alternative investments include commodities, currencies, private equity, hedge funds, structured products, and digital assets. Fixed income includes bonds and fixed annuities. Cash and cash equivalents include savings deposits and money market funds.
- J.P. Morgan Asset Management, “Building stronger liquidity strategies” July 2022.
- Morningstar, “How Bond Funds Fared in 2023”, Jan 2, 2024
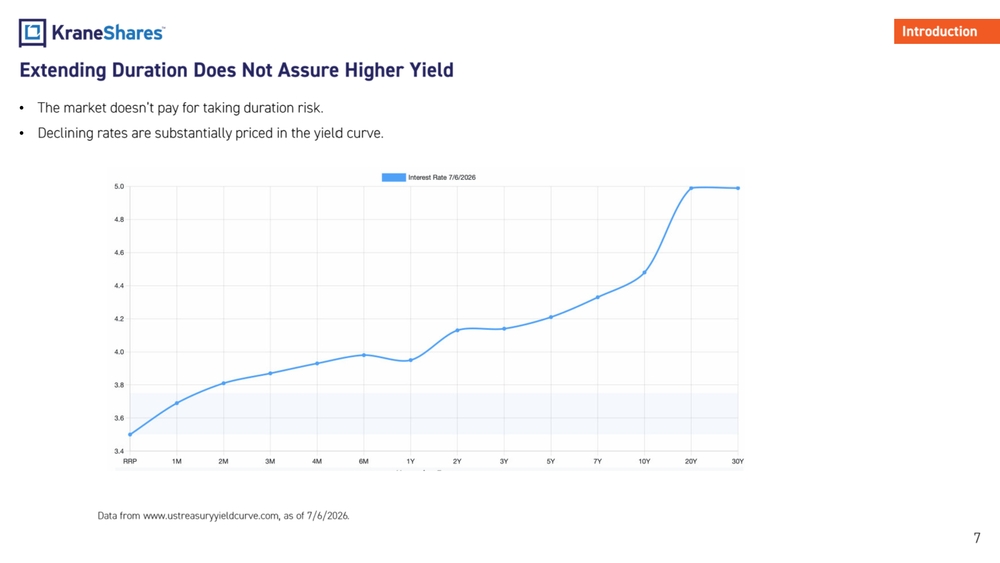
Extending Duration Does Not Assure Higher Yield 7 Data from www.ustreasuryyieldcurve.com , as of 7/6/2026. Introduction • The market doesn’t pay for taking duration risk. • Declining rates are substantially priced in the yield curve.
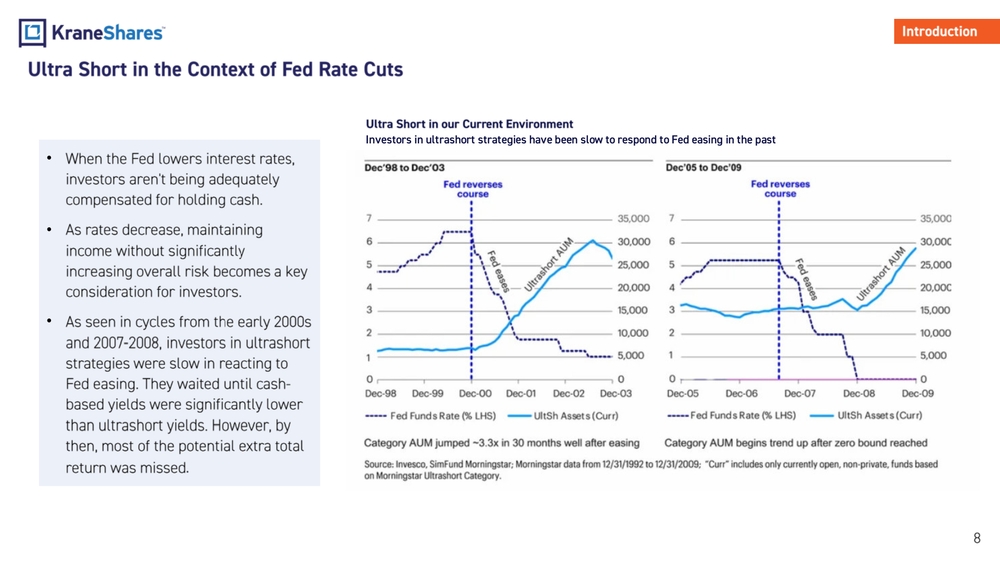
• When the Fed lowers interest rates, investors aren't being adequately compensated for holding cash. • As rates decrease, maintaining income without significantly increasing overall risk becomes a key consideration for investors. • As seen in cycles from the early 2000s and 2007
2008, investors in ultrashort strategies were slow in reacting to Fed easing. They waited until cash
based yields were significantly lower
than ultrashort yields. However, by
then, most of the potential extra total
return was missed
.
Ultra Short in the Context of Fed Rate Cuts
8
Ultra Short in our Current Environment
Investors in ultrashort strategies have been slow to respond to Fed easing in the past
Introduction
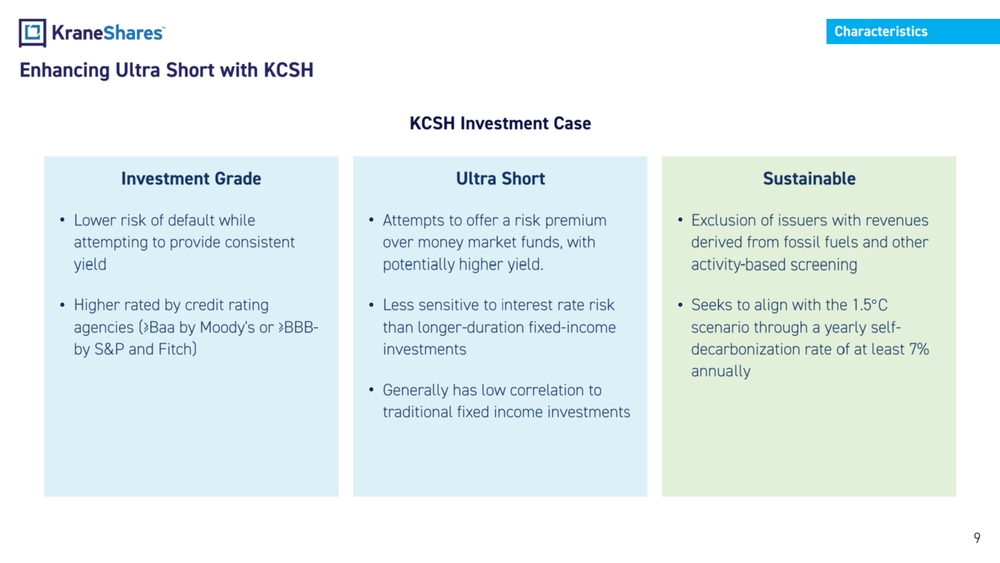
Enhancing Ultra Short with KCSH 9 Ultra Short • Attempts to offer a risk premium over money market funds, with potentially higher yield. • Less sensitive to interest rate risk than longer
duration fixed
income investments • Generally has low correlation to traditional fixed income investments Characteristics Sustainable • Exclusion of issuers with revenues derived from fossil fuels and other activity
based screening • Seeks to align with the 1.5 ° C scenario through a yearly self
decarbonization rate of at least 7% annually Investment Grade • Lower risk of default while attempting to provide consistent yield • Higher rated by credit rating agencies ( ≥Baa by Moody's or ≥BBB
by S&P and Fitch) KCSH Investment Case
10
Data from
Bloomberg as of
6
/30/2026.
Characteristics
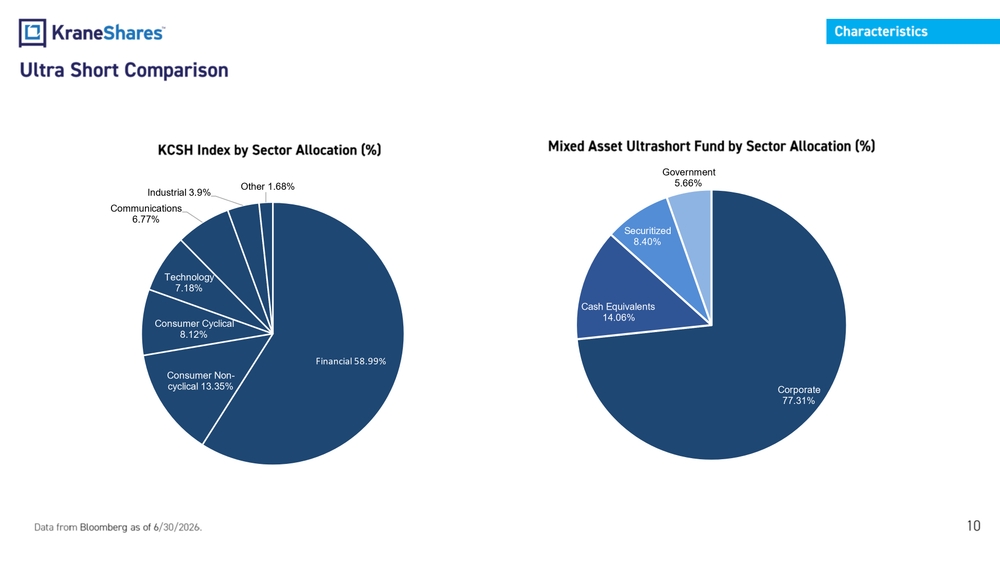
Ultra Short Comparison
Financial 58.99 %
Consumer Non -
cyclical 13.35 %Consumer Cyclical
8.12%Technology
7.18%Communications
6.77%Industrial 3.9%Other 1.68%
KCSH Index by Sector Allocation (%)
Corporate
77.31%Cash Equivalents
14.06%Securitized
8.40%Government
5.66%
Mixed Asset Ultrashort Fund by Sector Allocation (%)
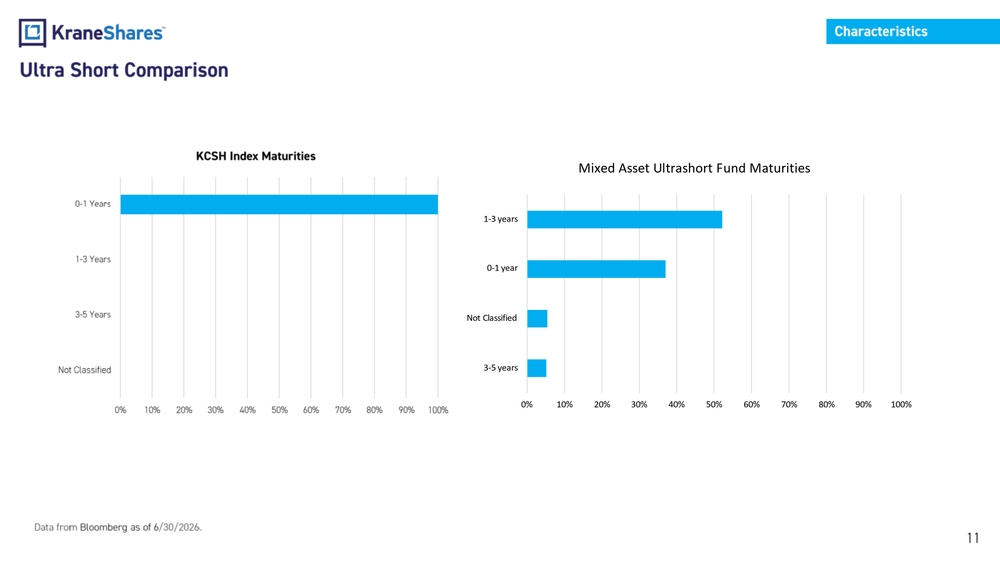
Ultra Short Comparison 11 Data from Bloomberg as of 6 /30/2026. Characteristics 0% 10% 20% 30% 40% 50% 60% 70% 80% 90% 100% Not Classified 3-5 Years 1-3 Years 0-1 Years KCSH Index Maturities 0% 10% 20% 30% 40% 50% 60% 70% 80% 90% 100%1-3 years 0-1 year Not Classified 3-5 yearsMixed Asset Ultrashort Fund Maturities
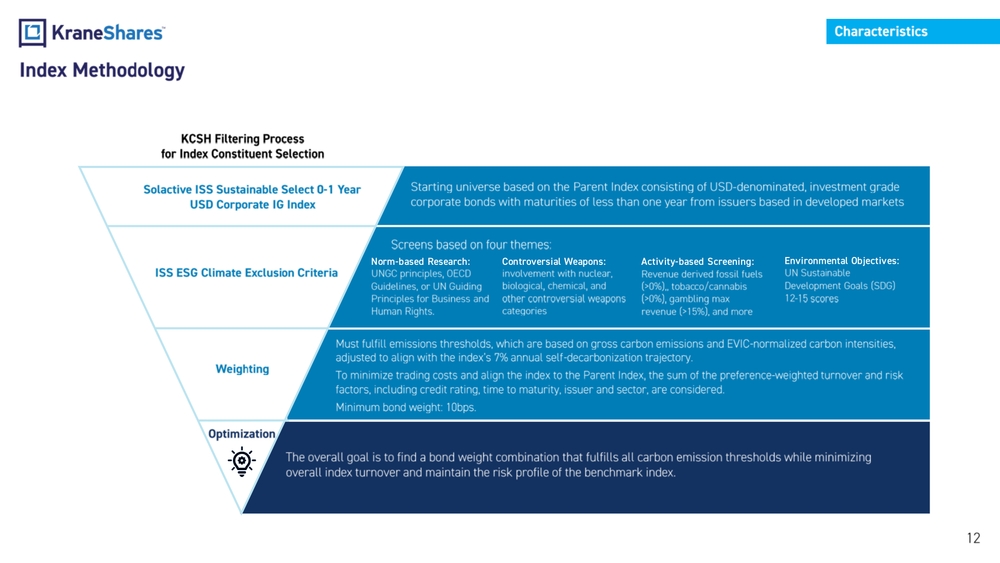
Index Methodology 12 A Solactive ISS Sustainable Select 0
1 Year USD Corporate IG Index ISS ESG Climate Exclusion Criteria Weighting Optimization Starting universe based on the Parent Index consisting of USD
denominated, investment grade corporate bonds with maturities of less than one year from issuers based in developed markets Screens based on four themes: Must fulfill emissions thresholds, which are based on gross carbon emissions and EVIC
normalized carbon intensities, adjusted to align with the index’s 7% annual self
decarbonization trajectory. To minimize trading costs and align the index to the Parent Index, the sum of the preference
weighted turnover and risk factors, including credit rating, time to maturity, issuer and sector, are considered. Minimum bond weight: 10bps. The overall goal is to find a bond weight combination that fulfills all carbon emission thresholds while minimizing overall index turnover and maintain the risk profile of the benchmark index. KCSH Filtering Process for Index Constituent Selection Norm -based Research: UNGC principles, OECD Guidelines, or UN Guiding Principles for Business and Human Rights.Controversial Weapons: involvement with nuclear, biological, chemical, and other controversial weapons categoriesActivity -based Screening: Revenue derived fossil fuels (>0%),, tobacco/cannabis (>0%), gambling max revenue (>15%), and moreEnvironmental Objectives: UN Sustainable Development Goals (SDG) 12
15 scores Characteristics
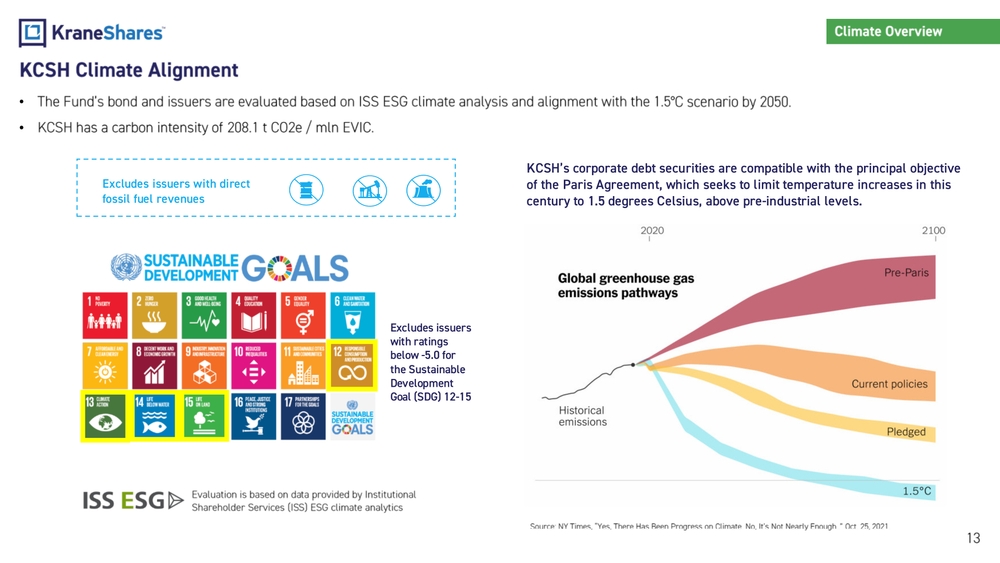
• The Fund’s bond and issuers are evaluated based on ISS ESG climate analysis and alignment with the 1.5 ° C scenario by 2050. • KCSH has a carbon intensity of 208.1 t CO2e / mln EVIC . KCSH Climate Alignment 13 Source: NY Times, “Yes, There Has Been Progress on Climate. No, It’s Not Nearly Enough..” Oct. 25, 2021. Climate Overview Excludes issuers with direct fossil fuel revenuesKCSH’s corporate debt securities are compatible with the principal objective of the Paris Agreement, which seeks to limit temperature increases in this century to 1.5 degrees Celsius, above pre -industrial levels. Excludes issuers with ratings below -5.0 for the Sustainable Development Goal (SDG) 12 -15 Evaluation is based on data provided by Institutional Shareholder Services (ISS) ESG climate analytics
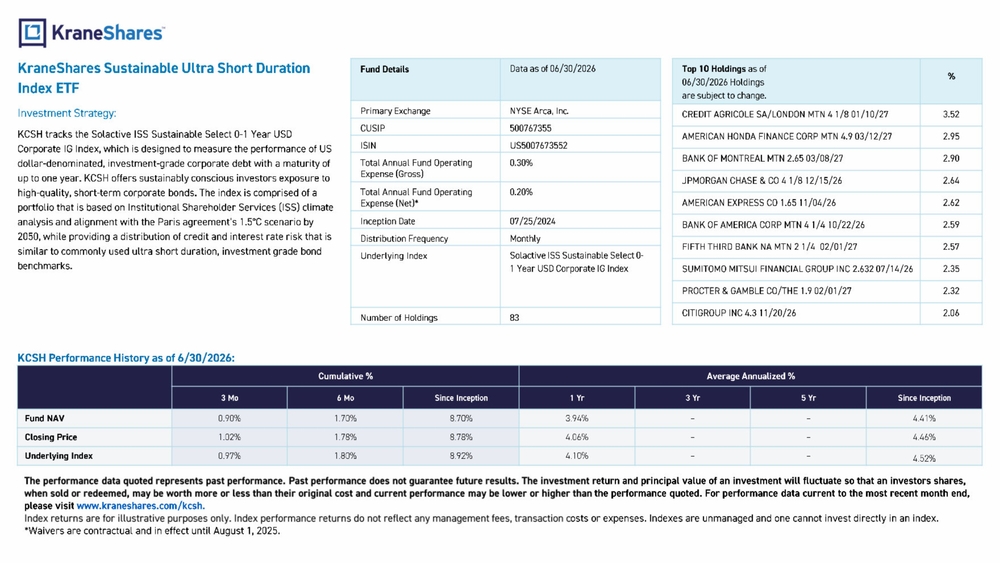
KraneShares Sustainable Ultra Short Duration Index ETF Investment Strategy: KCSH tracks the Solactive ISS Sustainable Select 0
1 Year USD Corporate IG Index, which is designed to measure the performance of US dollar
denominated, investment
grade corporate debt with a maturity of up to one year. KCSH offers sustainably conscious investors exposure to high
quality, short
term
corporate
bonds.
The
index
is
comprised
of
a
portfolio
that
is
based
on
Institutional
Shareholder
Services
(ISS)
climate
analysis
and
alignment
with
the
Paris
agreement’s
1.5
°
C
scenario
by
2050,
while
providing
a
distribution
of
credit
and
interest
rate
risk
that
is
similar
to
commonly
used
ultra
short
duration
,
investment
grade
bond
benchmarks.
Fund
Details
Data
as
of
06/30/2026
Primary
Exchange
NYSE
Arca,
Inc.
CUSIP
500767355
ISIN
US5007673552
Total
Annual
Fund
Operating
Expense
(Gross)
0.30%
Total
Annual
Fund
Operating
Expense
(Net)*
0.20%
Inception
Date
07/25/2024
Distribution
Frequency
Monthly
Underlying
Index
Solactive
ISS
Sustainable
Select
0
1 Year
USD
Corporate
IG
Index
Number
of
Holdings
83
Top
10
Holdings
as
of
06/30
/202
6
Holdings
are
subject
to
change.
%
CREDIT AGRICOLE SA/LONDON MTN 4 1/8 01/10/27
3.52
AMERICAN HONDA FINANCE CORP MTN 4.9 03/12/27
2.95
BANK OF MONTREAL MTN 2.65 03/08/27
2.90
JPMORGAN CHASE & CO 4 1/8 12/15/26
2.64
AMERICAN EXPRESS CO 1.65 11/04/26
2.62
BANK OF AMERICA CORP MTN 4 1/4 10/22/26
2.59
FIFTH THIRD BANK NA MTN 2 1/4
02/01/27
2.57
SUMITOMO MITSUI FINANCIAL GROUP INC 2.632 07/14/26
2.35
PROCTER & GAMBLE CO/THE 1.9 02/01/27
2.32
CITIGROUP INC 4.3 11/20/26
2.06
KCSH
Performance
History
as
of
6/30
/202
6
:
Cumulative
%
Average
Annualized
%
3
Mo
6
Mo
Since
Inception
1
Yr
3
Yr
5
Yr
Since
Inception
Fund NAV
0.90%
1.70%
8.70%
3.94%
–
–
4.41%
Closing Price
1.02%
1.78%
8.78%
4.06%
–
–
4.46%
Underlying Index
0.97%
1.80%
8.92%
4.10%
–
–
4.52%
The performance data quoted represents past performance. Past performance does not guarantee future results. The investment r
etu
rn and principal value of an investment will fluctuate so that an investors shares,
when sold or redeemed, may be worth more or less than their original cost and current performance may be lower or higher than
th
e performance quoted. For performance data current to the most recent month end,
please visit
www.kraneshares.com/k
csh
.
Index returns are for illustrative purposes only. Index performance returns do not reflect any management fees, transaction c
ost
s or expenses. Indexes are unmanaged and one cannot invest directly in an index.
*Waivers are contractual and in effect until August 1, 2025.
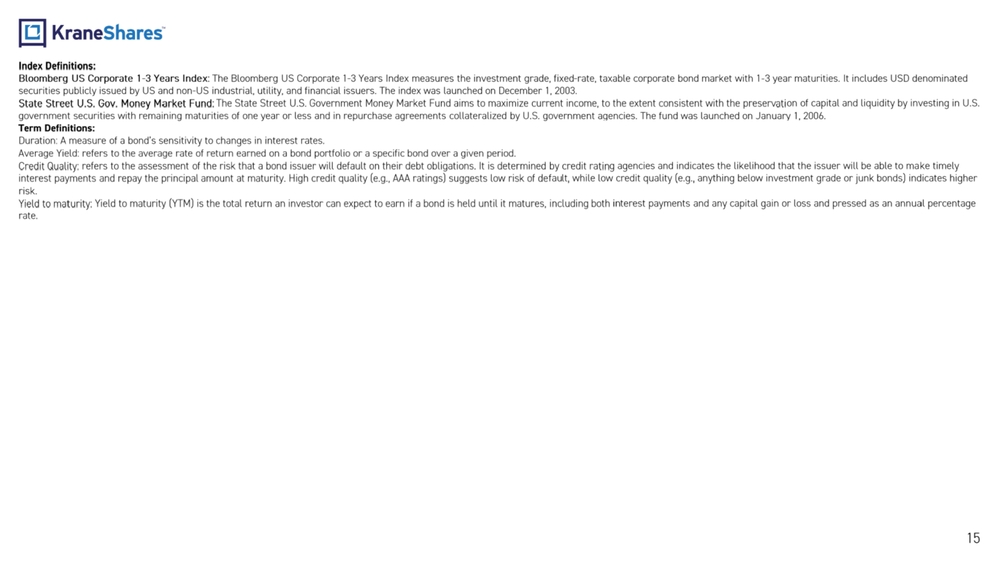
15 Index Definitions: Bloomberg US Corporate 1
3 Years Index: The Bloomberg US Corporate 1
3 Years Index measures the investment grade, fixed
rate, taxable corporate bond market with 1
3 year
maturities. It includes USD denominated
securities publicly issued by US and non
US industrial, utility, and financial issuers. The index was launched on December 1, 20
03.
State Street U.S. Gov. Money Market Fund:
The State Street U.S. Government Money Market Fund aims to maximize current income, to the extent consistent with the preserv
ati
on of capital and liquidity by investing in U.S.
government securities with remaining maturities of one year or less and in repurchase agreements collateralized by U.S. gover
nme
nt agencies. The fund was launched on January 1, 2006.
Term Definitions:
Duration: A measure of a bond’s sensitivity to changes in interest rates.
Average Yield: refers to the average rate of return earned on a bond portfolio or a specific bond over a given period.
Credit
Quality:
refers to the assessment of the risk that a bond issuer will default on their debt obligations. It is determined by credit ra
tin
g agencies and indicates the likelihood that the issuer will be able to make timely
interest payments and repay the principal amount at maturity. High credit quality (e.g., AAA ratings) suggests low risk of de
fau
lt, while low credit quality (e.g., anything below investment grade or junk bonds) indicates higher
risk.
Yield to maturity:
Yield to maturity (YTM) is the total return an investor can expect to earn if a bond is held until it matures, including both
in
terest payments and any capital gain or loss and pressed as an annual percentage
rate.
16
Important Notes:
Carefully consider the Funds’ investment objectives, risk factors, charges and expenses before investing. This and additional
in
formation can be found in the Funds' full and summary prospectus,
which may be obtained by visiting
www.kraneshares.com/kcsh
. Read the prospectus carefully before investing.
Risk Disclosures:
Investing involves risk, including possible loss of principal. There can be no assurance that a Fund will achieve its stated
obj
ectives. Indices are unmanaged and do not include the effect of fees. One
cannot invest directly in an index.
This information should not be relied upon as research, investment advice, or a recommendation regarding any products, strate
gie
s, or any
security in particular
. This material is strictly for illustrative,
educational, or informational purposes and is subject to change. Certain content represents an assessment of the market envir
onm
ent at a specific time and is not intended to be a forecast of future
events or a guarantee of future results; material is as of the dates noted and is subject to change without notice.
Fixed income securities carry credit and interest rate risks. Credit risk is the chance that an issuer may fail to make inter
est
payments or repay principal, which can negatively impact fund performance.
Securities with longer maturities and lower credit quality are more vulnerable to credit risk. Interest rate risk involves va
lue
changes in debt due to interest rate fluctuations; rising rates typically lower
debt prices, while falling rates usually increase them. Longer
duration debt is more affected by these changes, making it more v
olatile. Recent interest rate hikes may continue, increasing associated
risks.
The Fund may invest in derivatives, which are often more volatile than other investments and may magnify the Fund’s gains or
los
ses. A derivative (i.e., futures/forward contracts, swaps, and options) is a
contract that derives its value from the performance of an underlying asset. The primary risk of derivatives is that changes
in
the asset’s market value and the derivative may not be proportionate, and
some derivatives can have the potential for unlimited losses. Derivatives are also subject to liquidity and counterparty risk
. T
he Fund is subject to liquidity risk, meaning that certain investments may
become difficult to purchase or sell at a reasonable time and price. If a transaction for these securities is large, it may n
ot
be possible to initiate, which may cause the Fund to suffer losses. Counterparty
risk is the risk of loss
in the event that
the counterparty to an agreement fails to make required payments or otherwise comply with the terms of the derivative.
Large capitalization companies may struggle to adapt fast, impacting their growth compared to smaller firms, especially in ex
pan
sive times. This could result in lower stock returns than investing in
smaller and mid
sized companies. KSPY is non
diversified. The Fund is new and does not yet have a significant number of shares outstanding. If the Fund does not grow in size , it will be at greater risk than larger funds of wider bid
ask spreads for its shares, trading at a greater premium or discount to NAV, liquidation and/or a trading halt. KCSH may have trouble identifying issuers with high ESG ratings, it can be challenging, and investments may be volatile. Even top
rat ed companies might not excel compared to others in ESG practices. The ESG investment strategy limits available opportunities, potentially leading to underperformance relative to non
ESG strategi
es. This could result in the Fund investing in underperforming sectors or
securities. ESG investing is qualitative and subjective, and the criteria used may not align with every investor's beliefs or
va
lues.
ETF shares are bought and sold on an exchange at market price (not NAV) and are not individually redeemed from the Fund. Howe
ver
, shares may be redeemed at NAV directly by certain authorized
broker
dealers (Authorized Participants) in very large creation/redemption units. The returns shown do not represent the return
s you would receive if you traded shares at other times. Shares may
trade at a premium or discount to their NAV in the secondary market. Brokerage commissions will reduce returns. Beginning 12/
23/
2020, market price returns are based on the official closing price of an
ETF share or, if the official closing price isn't available, the midpoint between the national best bid and national best off
er
("NBBO") as of the time the ETF calculates the current NAV per share. Prior to
that date, market price returns were based on the midpoint between the Bid and Ask price. NAVs are calculated using prices as
of
4:00 PM Eastern Time.
The KraneShares ETFs and KFA Funds ETFs are distributed by SEI Investments Distribution Company (SIDCO), 1 Freedom Valley Dri
ve,
Oaks, PA 19456, which is not affiliated with Krane Funds Advisors,
LLC, the Investment Adviser for the Funds, or Climate Finance Partners , the Sub
Advisor for the Fund, or IHS Markit Ltd. [R_US_ KS_SEI]