Asia Bond ETF: High Yield & Active Income Strategy | KHYB
by Kraneshares
KHYB 16/30/2026 Opportunities In The Asia High Yield Bond Market Overview of the KraneShares Asia Pacific High Income USD Bond ETF (ticker: KHYB) info@kraneshares.com
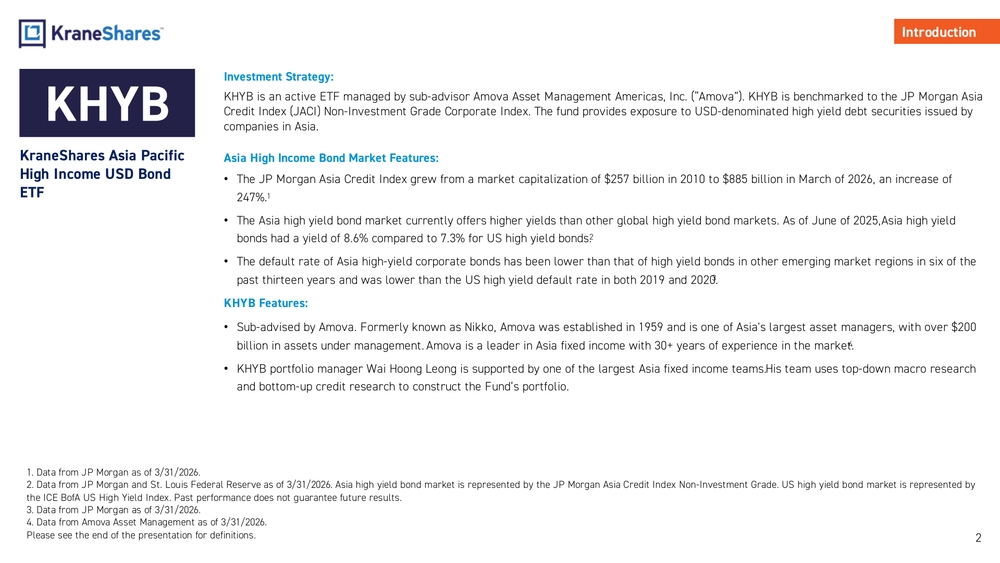
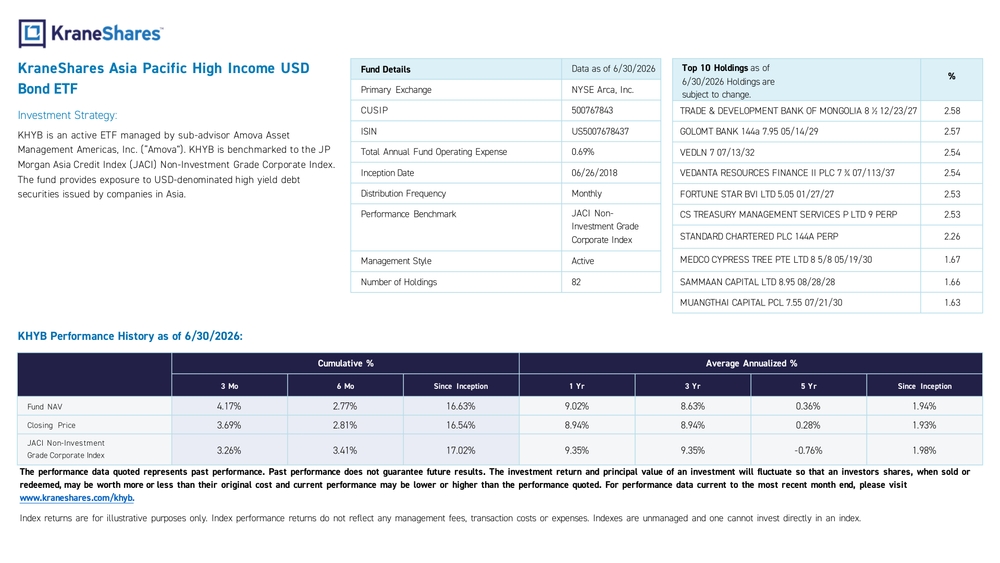
Investment Strategy: KHYB is an active ETF managed by sub -advisor Amova Asset Management Americas, Inc. (“Amova”). KHYB is benchmarked to the JP Morg an Asia Credit Index (JACI) Non -Investment Grade Corporate Index. The fund provides exposure to USD -denominated high yield debt securiti es issued by companies in Asia. Asia High Income Bond Market Features: •The JP Morgan Asia Credit Index grew from a market capitalization of $257 billion in 2010 to $ 885 billion in March of 2026, an increase of 247%.1 •The Asia high yield bond market currently offers higher yields than other global high yield bond markets. As of June of 2025, Asia high yield bonds had a yield of 8.6% compared to 7.3% for US high yield bonds.2 •The default rate of Asia high -yield corporate bonds has been lower than that of high yield bonds in other emerging market region s in six of the past thirteen years and was lower than the US high yield default rate in both 2019 and 2020.3 KHYB Features: •Sub-advised by Amova. Formerly known as Nikko, Amova was established in 1959 and is one of Asia's largest asset managers, with o ver $200 billion in assets under management. Amova is a leader in Asia fixed income with 30+ years of experience in the market.4 •KHYB portfolio manager Wai Hoong Leong is supported by one of the largest Asia fixed income teams. His team uses top -down macro research and bottom -up credit research to construct the Fund’s portfolio.KHYB KraneShares Asia Pacific High Income USD Bond ETF 2Introduction
- Data from JP Morgan as of 3/31/2026.
- Data from JP Morgan and St. Louis Federal Reserve as of 3/31/2026. Asia high yield bond market is represented by the JP Morga n Asia Credit Index Non -Investment Grade. US high yield bond market is represented by the ICE BofA US High Yield Index. Past performance does not guarantee future results.
- Data from JP Morgan as of 3/31/2026.
- Data from Amova Asset Management as of 3/31/2026. Please see the end of the presentation for definitions.
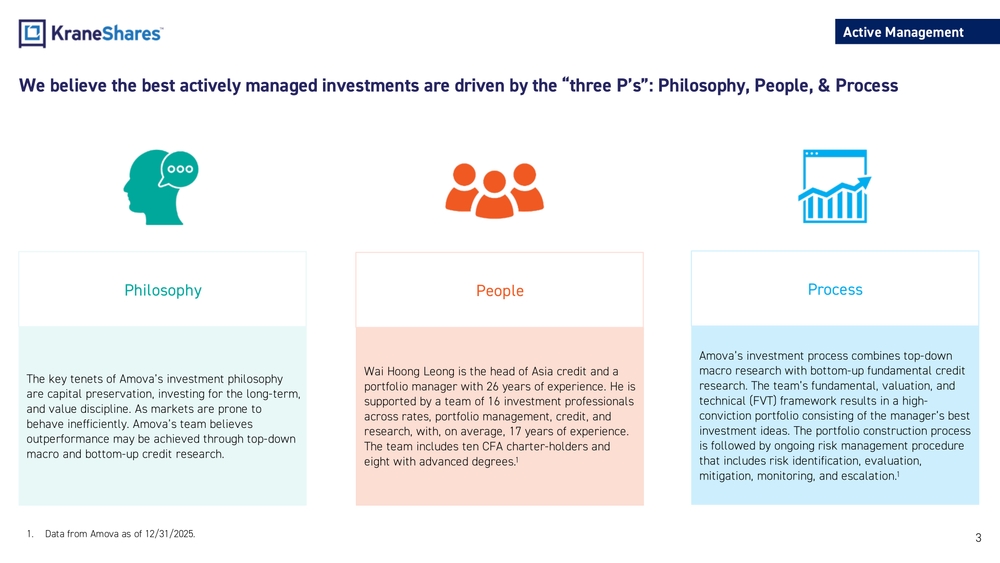
3We believe the best actively managed investments are driven by the “three P’s”: Philosophy, People, & Process Wai Hoong Leong is the head of Asia credit and a portfolio manager with 26 years of experience. He is supported by a team of 16 investment professionals across rates, portfolio management, credit, and research, with, on average, 17 years of experience. The team includes ten CFA charter -holders and eight with advanced degrees.1People Philosophy The key tenets of Amova’s investment philosophy are capital preservation, investing for the long -term, and value discipline. As markets are prone to behave inefficiently. Amova’s team believes outperformance may be achieved through top -down macro and bottom -up credit research.Amova’s investment process combines top -down macro research with bottom -up fundamental credit research. The team’s fundamental, valuation, and technical (FVT) framework results in a high - conviction portfolio consisting of the manager’s best investment ideas. The portfolio construction process is followed by ongoing risk management procedure that includes risk identification, evaluation, mitigation, monitoring, and escalation.1Process 1.Data from Amova as of 12/31/2025. Active Management
4Why Active? We believe that active management is appropriate for investing in Asia high yield bonds given the market’s size, complexity, and tendency to undergo rapid changes owing to the low level of development of some of its country constituents.Active Management An active manager may offer : •Local expertise •Familiarity with issuers •Ability to invest tactically based on market conditions and individual issuers’ circumstances •Ability to base investments off credit quality, not indebtedness •Research -driven investment process guided by investment professionalsAmova Asset Management offers: •30+ years of experience in the market •One of the largest fixed -income teams in Asia •The use of both quantitative and qualitative factors to guide investment decisions •Local presence in Singapore
Non-IG
(13%)
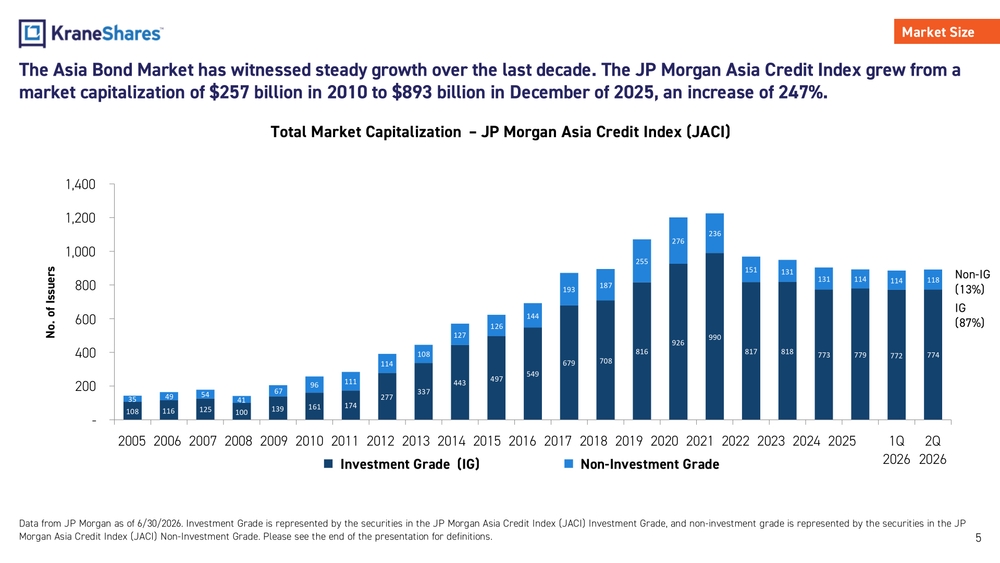
5The Asia Bond Market has witnessed steady growth over the last decade. The JP Morgan Asia Credit Index grew from a
market capitalization of $257 billion in 2010 to $893 billion in December of 2025, an increase of 247%.
Data from JP Morgan as of 6/30/2026 . Investment Grade is represented by the securities in the JP Morgan Asia Credit Index (JACI) Investment Grade, and non -investment grade is represe nted by the securities in the JP
Morgan Asia Credit Index (JACI) Non -Investment Grade. Please see the end of the presentation for definitions.Market Size
IG
(87%)Total Market Capitalization – JP Morgan Asia Credit Index (JACI)
108 116 125 100139 161 174277337443497549679 708816926990
817 818773 779 772 774
3549 54416796111114108127126144193187255276236
151 131
131 114 114 118
- 200 400 600 800 1,000 1,200 1,400 2005 2006 2007 2008 2009 2010 2011 2012 2013 2014 2015 2016 2017 2018 2019 2020 2021 2022 2023 2024 2025 1Q 20262Q 2026No. of Issuers Investment Grade (IG) Non-Investment Grade
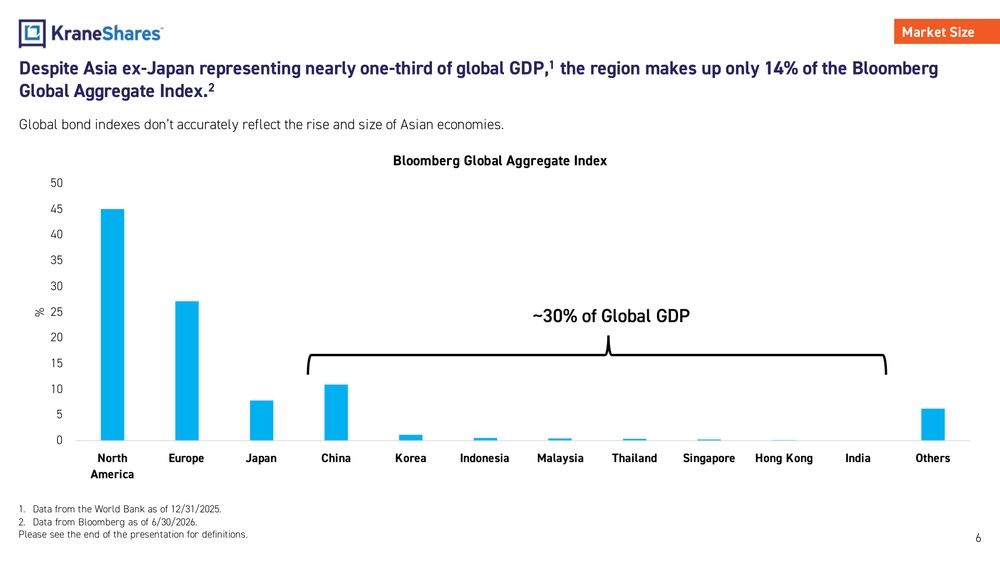
05101520253035404550 North AmericaEurope Japan China Korea Indonesia Malaysia Thailand Singapore Hong Kong India Others%Bloomberg Global Aggregate IndexDespite Asia ex -Japan representing nearly one -third of global GDP,1 the region makes up only 14% of the Bloomberg Global Aggregate Index.2 Global bond indexes don’t accurately reflect the rise and size of Asian economies . 1.Data from the World Bank as of 12/31/2025. 2.Data from Bloomberg as of 6/30/2026 . Please see the end of the presentation for definitions.6~30% of Global GDPMarket Size
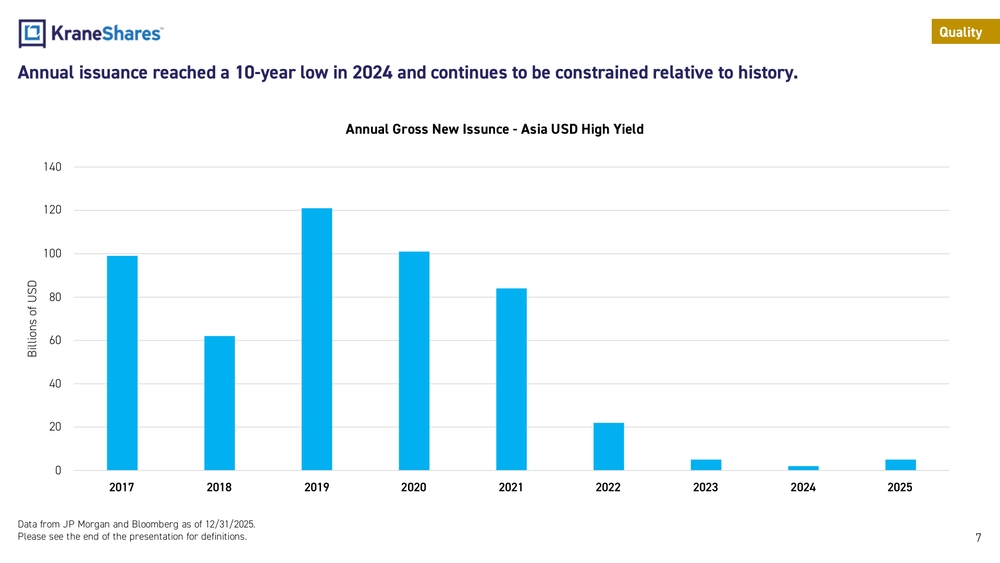
7Annual issuance reached a 10 -year low in 2024 and continues to be constrained relative to history. Data from JP Morgan and Bloomberg as of 12/31/2025. Please see the end of the presentation for definitions.Quality 020406080100120140 2017 2018 2019 2020 2021 2022 2023 2024 2025Billions of USDAnnual Gross New Issunce - Asia USD High Yield
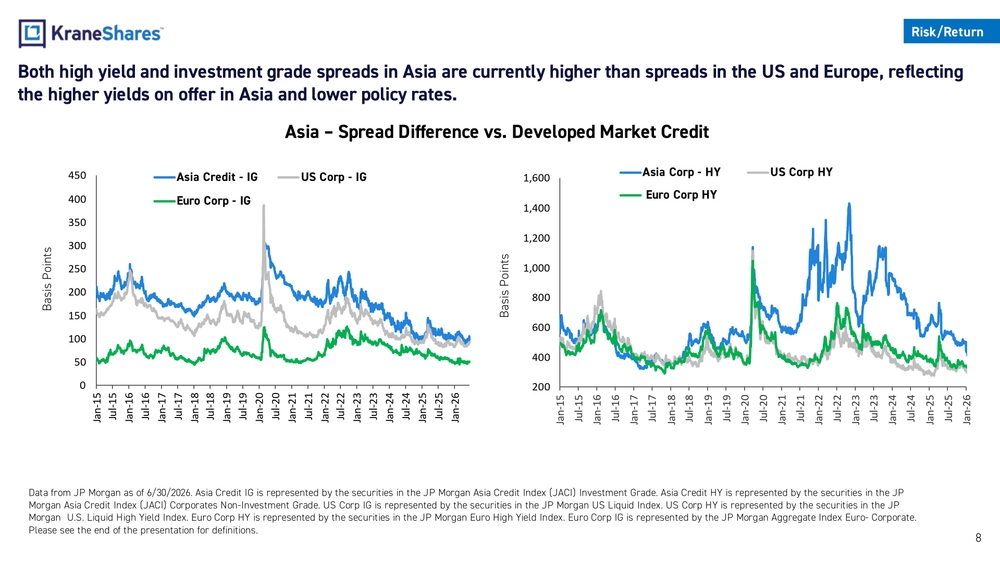
8Both high yield and investment grade spreads in Asia are currently higher than spreads in the US and Europe, reflecting the higher yields on offer in Asia and lower policy rates. Data from JP Morgan as of 6/30/2026 . Asia Credit IG is represented by the securities in the JP Morgan Asia Credit Index (JACI) Investment Grade. Asia Credit HY is represented by the securities in the JP Morgan Asia Credit Index (JACI) Corporates Non -Investment Grade. US Corp IG is represented by the securities in the JP Morgan US Liquid Index. US Corp HY is represented by the securities in the JP Morgan U.S. Liquid High Yield Index. Euro Corp HY is represented by the securities in the JP Morgan Euro High Yield Index. Euro Corp IG is represented by the JP Morgan Aggr egate Index Euro - Corporate. Please see the end of the presentation for definitions.Asia – Spread Difference vs. Developed Market CreditRisk/ReturnBasis Points Basis PointsIG = investment grade HY = high yield 050100150200250300350400450 Jan-15 Jul-15 Jan-16 Jul-16 Jan-17 Jul-17 Jan-18 Jul-18 Jan-19 Jul-19 Jan-20 Jul-20 Jan-21 Jul-21 Jan-22 Jul-22 Jan-23 Jul-23 Jan-24 Jul-24 Jan-25 Jul-25 Jan-26Asia Credit - IG US Corp - IG Euro Corp - IG 2004006008001,0001,2001,4001,600 Jan-15 Jul-15 Jan-16 Jul-16 Jan-17 Jul-17 Jan-18 Jul-18 Jan-19 Jul-19 Jan-20 Jul-20 Jan-21 Jul-21 Jan-22 Jul-22 Jan-23 Jul-23 Jan-24 Jul-24 Jan-25 Jul-25 Jan-26Asia Corp - HY US Corp HY Euro Corp HY
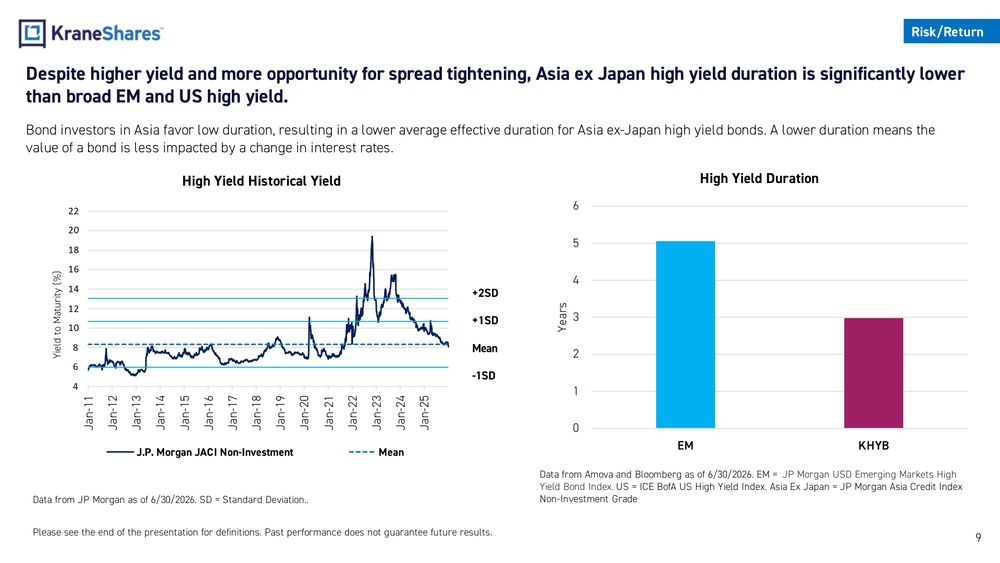
9Despite higher yield and more opportunity for spread tightening, Asia ex Japan high yield duration is significantly lower than broad EM and US high yield. Bond investors in Asia favor low duration, resulting in a lower average effective duration for Asia ex -Japan high yield bonds. A lower duration means the value of a bond is less impacted by a change in interest rates.Risk/Return Data from Amova and Bloomberg as of 6/30/2026 . EM = JP Morgan USD Emerging Markets High Yield Bond Index. US = ICE BofA US High Yield Index. Asia Ex Japan = JP Morgan Asia Credit Index Non-Investment Grade Data from JP Morgan as of 6/30/2026 . SD = Standard Deviation..+2SD +1SD Mean -1SD 0123456 EM KHYBYearsHigh Yield Duration High Yield Historical Yield Please see the end of the presentation for definitions. Past performance does not guarantee future results.46810121416182022 Jan-11 Jan-12 Jan-13 Jan-14 Jan-15 Jan-16 Jan-17 Jan-18 Jan-19 Jan-20 Jan-21 Jan-22 Jan-23 Jan-24 Jan-25Yield to Maturity (%) J.P. Morgan JACI Non-Investment Mean
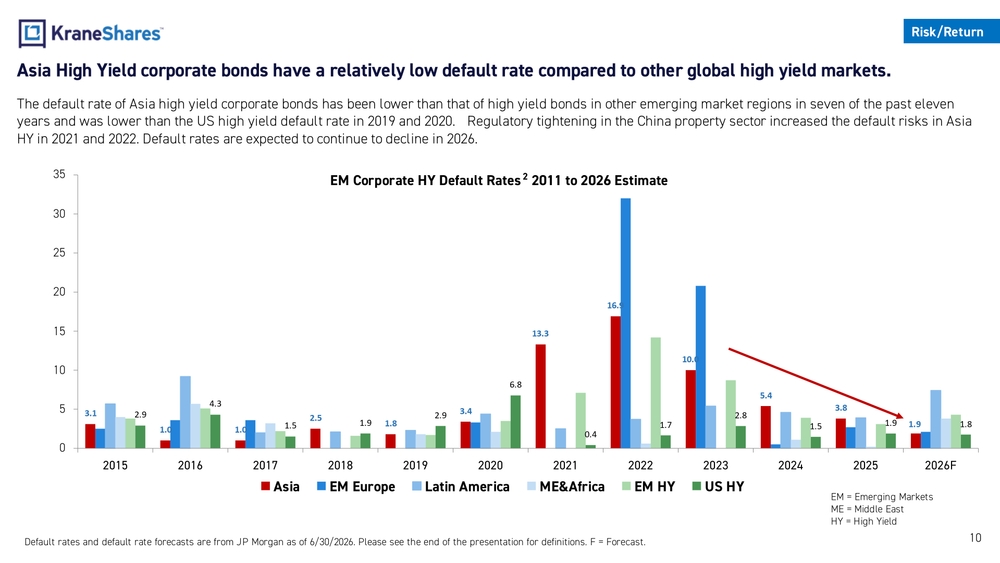
10Asia High Yield corporate bonds have a relatively low default rate compared to other global high yield markets. The default rate of Asia high yield corporate bonds has been lower than that of high yield bonds in other emerging market region sin seven of the past eleven years and was lower than the US high yield default rate in2019 and 2020. Regulatory tightening in the China property sector in creased the default risks in Asia HY in 2021 and 2022. Default rates are expected to continue to decline in 2026. Default rates and default rate forecasts are from JP Morgan as of 6/30/2026 . Please see the end of the presentation for definitions . F = Forecast.Risk/Return EM = Emerging Markets ME = Middle East HY = High YieldEM Corporate HY Default Rates2 2011 to 2026 Estimate 3.1 1.0 1.02.51.83.413.316.9 10.0 5.4 3.8 1.92.94.3 1.51.92.96.8 0.41.72.8 1.51.9 1.8 05101520253035 2015 2016 2017 2018 2019 2020 2021 2022 2023 2024 2025 2026F Asia EM Europe Latin America ME&Africa EM HY US HY
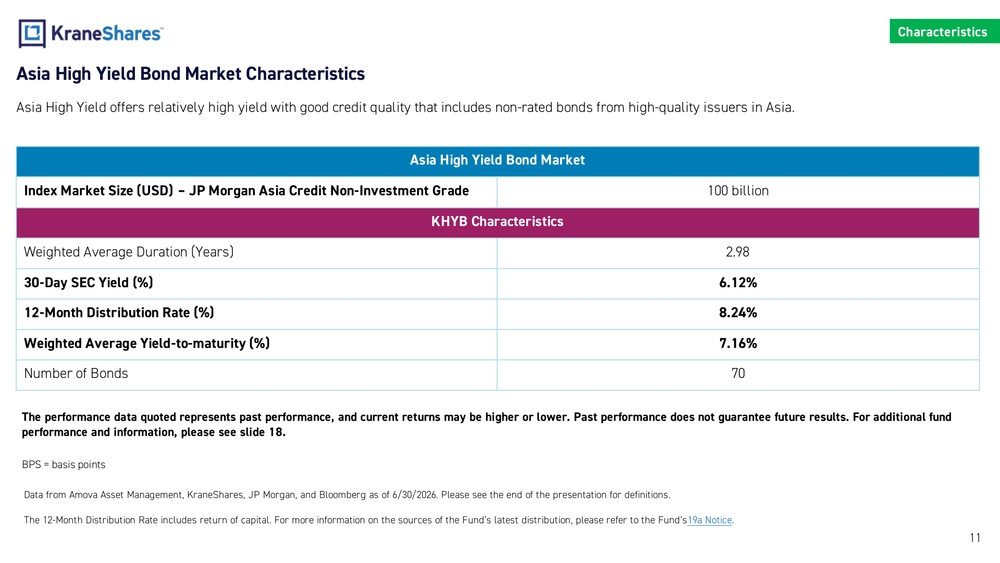
11Asia High Yield Bond Market Characteristics Asia High Yield offers relatively high yield with good credit quality that includes non -rated bonds from high -quality issuers in Asia. Asia High Yield Bond Market Index Market Size (USD) – JP Morgan Asia Credit Non -Investment Grade 100 billion KHYB Characteristics Weighted Average Duration (Years) 2.98 30-Day SEC Yield (%) 6.12% 12-Month Distribution Rate (%) 8.24 % Weighted Average Yield -to-maturity (%) 7.16 % Number of Bonds 70 Data from Amova Asset Management, KraneShares, JP Morgan, and Bloomberg as of 6/30/2026 . Please see the end of the presentation for definitions. The 12 -Month Distribution Rate includes return of capital. For more information on the sources of the Fund’s latest distribution, please refer to the Fund’s 19a Notice .Characteristics BPS = basis pointsThe performance data quoted represents past performance, and current returns may be higher or lower. Past performance does no t guarantee future results. For additional fund performance and information, please see slide 18.
12Asia High Yield Bond Market Characteristics
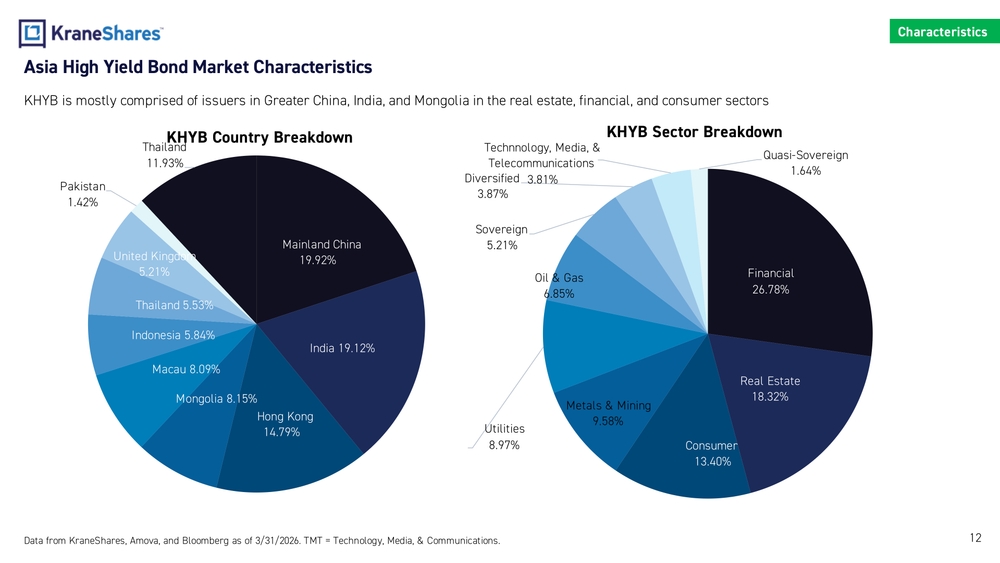
KHYB is mostly comprised of issuers in Greater China, India , and Mongolia in the real estate, financial, and consumer sectors
Data from KraneShares, Amova, and Bloomberg as of 3/31/2026. TMT = Technology, Media, & Communications.Characteristics
Mainland China
19.92%
India 19.12%
Hong Kong
14.79%Mongolia 8.15%Macau 8.09%Indonesia 5.84%Thailand 5.53%United Kingdom
5.21%Pakistan
1.42%Thailand
11.93%KHYB Country Breakdown
Financial
26.78%
Real Estate
18.32%
Consumer
13.40%Metals & Mining
9.58%Utilities
8.97%Oil & Gas
6.85%Sovereign
5.21%Diversified
3.87%Technnology, Media, &
Telecommunications
3.81%Quasi -Sovereign
1.64%KHYB Sector Breakdown
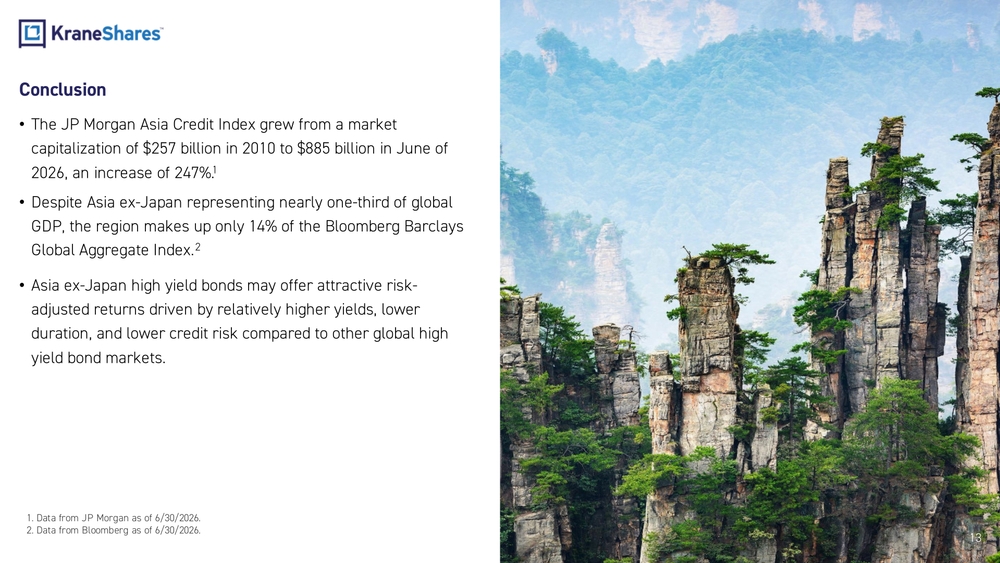
Conclusion •The JP Morgan Asia Credit Index grew from a market capitalization of $257 billion in 2010 to $885 billion in June of 2026, an increase of 247%.1 •Despite Asia ex -Japan representing nearly one -third of global GDP, the region makes up only 14% of the Bloomberg Barclays Global Aggregate Index.2 •Asia ex -Japan high yield bonds may offer attractive risk - adjusted returns driven by relatively higher yields, lower duration, and lower credit risk compared to other global high yield bond markets. 131. Data from JP Morgan as of 6/30/2026 . 2. Data from Bloomberg as of 6/30/2026 .
KraneShares Asia Pacific High Income USD Bond ETF Investment Strategy: KHYB isanactive ETF managed bysub-advisor Amova Asset Management Americas, Inc. (“Amova” ).KHYB isbenchmarked totheJP Morgan Asia Credit Index (JACI) Non-Investment Grade Corporate Index. Thefund provides exposure toUSD-denominated high yield debt securities issued bycompanies inAsia.Fund Details Data as of 6/30/2026 Primary Exchange NYSE Arca, Inc. CUSIP 500767843 ISIN US5007678437 Total Annual Fund Operating Expense 0.69% Inception Date 06/26/2018 Distribution Frequency Monthly Performance Benchmark JACI Non- Investment Grade Corporate Index Management Style Active Number ofHoldings 82Top10Holdings asof 6/30/202 6Holdings are subject tochange.% TRADE & DEVELOPMENT BANK OF MONGOLIA 8 ½ 12/23/27 2.58 GOLOMT BANK 144a 7.95 05/14/29 2.57 VEDLN 7 07/13/32 2.54 VEDANTA RESOURCES FINANCE II PLC 7 ¾ 07/113/37 2.54 FORTUNE STAR BVI LTD 5.05 01/27/27 2.53 CS TREASURY MANAGEMENT SERVICES P LTD 9 PERP 2.53 STANDARD CHARTERED PLC 144A PERP 2.26 MEDCO CYPRESS TREE PTE LTD 8 5/8 05/19/30 1.67 SAMMAAN CAPITAL LTD 8.95 08/28/28 1.66 MUANGTHAI CAPITAL PCL 7.55 07/21/30 1.63 KHYB Performance History asof6/30/202 6: Cumulative % Average Annualized % 3Mo 6Mo Since Inception 1Yr 3Yr 5Yr Since Inception Fund NAV 4.17% 2.77% 16.63% 9.02% 8.63% 0.36% 1.94% Closing Price 3.69% 2.81% 16.54% 8.94% 8.94% 0.28% 1.93% JACI Non-Investment Grade Corporate Index3.26% 3.41% 17.02% 9.35% 9.35% -0.76% 1.98% The performance data quoted represents past performance. Past performance does notguarantee future results. The investment return and principal value ofaninvestment will fluctuate sothat aninvestors shares, when sold or redeemed, may beworth more orless than their original cost andcurrent performance may belower orhigher than theperformance quoted. Forperformance data current tothemost recent month end, please visit www.kraneshares.com/khyb. Index returns areforillustrative purposes only. Index performance returns donotreflect anymanagement fees, transaction costs orexpenses. Indexes areunmanaged and one cannot invest directly inanindex.
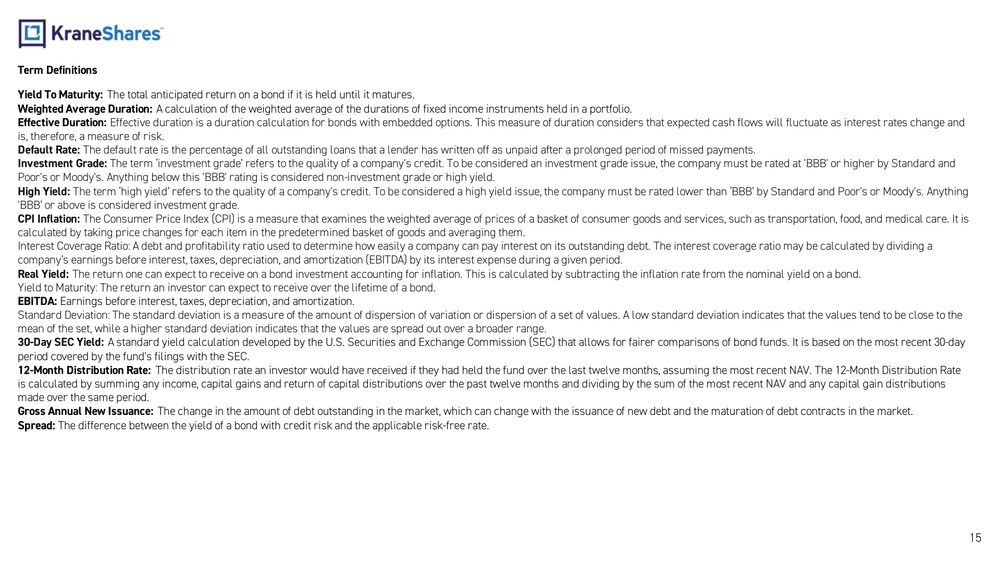
15Yield To Maturity: The total anticipated return on a bond if it is held until it matures. Weighted Average Duration: A calculation of the weighted average of the durations of fixed income instruments held in a portfolio. Effective Duration: Effective duration is a duration calculation for bonds with embedded options. This measure of duration considers that expected c ash flows will fluctuate as interest rates change and is, therefore, a measure of risk. Default Rate: The default rate is the percentage of all outstanding loans that a lender has written off as unpaid after a prolonged period of missed payments. Investment Grade: The term ‘investment grade’ r efers to the quality of a company's credit. To be considered an investment grade issue, the company must be rated at 'BBB' or higher by Standard and Poor's or Moody's. Anything below this 'BBB' rating is considered non -investment grade or high yield. High Yield :The term ‘high yield’ r efers to the quality of a company's credit. To be considered a high yield issue, the company must be rated lower than ‘BBB’ b y Standard and Poor's or Moody's. Anything 'BBB’ or above is considered investment grade. CPI Inflation: The Consumer Price Index (CPI) is a measure that examines the weighted average of prices of a basket of consumer goods and servi ces, such as transportation, food, and medical care. It is calculated by taking price changes for each item in the predetermined basket of goods and averaging them. Interest Coverage Ratio: A debt and profitability ratio used to determine how easily a company can pay interest on its outstanding debt. The interest co verage ratio may be calculated by dividing a company’s earnings before interest, taxes, depreciation, and amortization (EBITDA) by its interest expense during a given per iod. Real Yield: The return one can expect to receive on a bond investment accounting for inflation. This is calculated by subtracting the inf lation rate from the nominal yield on a bond. Yield to Maturity: The return an investor can expect to receive over the lifetime of a bond. EBITDA: Earnings before interest, taxes, depreciation, and amortization. Standard Deviation: The standard deviation is a measure of the amount of dispersion of variation or dispersion of a set of va lues. A low standard deviation indicates that the values tend to be close to the mean of the set, while a higher standard deviation indicates that the values are spread out over a broader range. 30-Day SEC Yield: A standard yield calculation developed by the U.S. Securities and Exchange Commission (SEC) that allows for fairer comparisons of bond funds. It is based on the most recent 30 -day period covered by the fund's filings with the SEC. 12-Month Distribution Rate: The distribution rate an investor would have received if they had held the fund over the last twelve months, assuming the mos t recent NAV. The 12 -Month Distribution Rate is calculated by summing any income, capital gains and return of capital distributions over the past twelve months and dividi ng by the sum of the most recent NAV and any capital gain distributions made over the same period. Gross Annual New Issuance: The change in the amount of debt outstanding in the market, which can change with the issuance of new debt and the maturation of debt contracts in the market. Spread: The difference between the yield of a bond with credit risk and the applicable risk -free rate.Term Definitions
16J.P. Morgan Asia Credit Index (JACI) Corporates Non -Investment Grade Index: The J.P. Morgan Asia Credit Index Corporates Non -Investment Grade Index consists of liquid US -dollar denominated debt instruments issued out of Asia ex -Japan. It is based on the composition and established methodology of the J.P. Morgan Asia Cred it Index (JACI), which is market capitalization weighted. The index is limited to issuers classified as non -investment grade based on the middle rating between Moody’s, Fitch, and S&P. JP Morgan Asia Credit Index Non -Investment Grade: The J.P. Morgan Asia Credit Index Core (JACI Core) consists of liquid US -dollar denominated debt instruments issued out of Asia ex Japan. The JACI Core is based on the composition and established methodology of the J.P. Morgan Asia Credit Index (JACI), which is market cap italization weighted. JACI Core includes the most liquid bonds from the JACI by requiring a minimum $350 million in notional outstanding and a minimum remaining maturity of 2 years. JACI Core also implements a country diversification methodology. Historical returns and statistics for the JACI Core are available from December 30, 2005. The non -investment grade version of the index is limited to i ssuers classified as non -investment grade based on the middle rating between Moody’s, Fitch, and S&P JP Morgan Asia Credit Index Investment Grade: The J.P. Morgan Asia Credit Index Core (JACI Core) consists of liquid US -dollar denominated debt instruments issued out of Asia ex-Japan. The JACI Core is based on the composition and established methodology of the J.P. Morgan Asia Credit Index (JACI), which is market cap italization weighted. JACI Core includes the most liquid bonds from the JACI by requiring a minimum $350 million in notional outstanding and a minimum remaining maturity of 2 years. JACI Core also implements a country diversification methodology. Historical returns and statistics for the JACI Core are available from December 30, 2005. The investment grade version of the index is limited to is suers classified as investment grade based on the middle rating between Moody’s, Fitch, and S&P. JP Morgan US High Yield Index: The JP Morgan US High Yield Index provides a comprehensive, accurate representation of the US high yield market and its compo nents. JP Morgan US Liquid Index: The JP Morgan US Liquid Index provides a comprehensive, accurate representation of the investment grade market and its compon ents. Corporate bonds rated Baa3/BBB - or higher by Moody's and Standard & Poor's, respectively, with issue sizes of at least $300 million will qualify for inclusio n in the index. A further requirement is that each bond be issued by a corporate entity that has at least $1 billion of fixed rate bonds outstanding to ensure overall "issuer" liquidity. JP Morgan USD Emerging Markets High Yield Bond Index: The JP Morgan USD Emerging Markets High Yield Bond Index tracks liquid, US Dollar emerging market fixed and floating -rate debt instruments issued by corporate, sovereign, and quasi -sovereign entities. The index tracks instruments that are classified as no n-investment grade (HY) in the established JP Morgan EMBI Global Diversified Core and JP Morgan CEMBI Broad Diversified Core indices, and combines them with a market capitalization based wei ghting. The returns and statistics are available since December 2011. Bloomberg Global Aggregate Index: The Bloomberg Barclays Global Aggregate Index is a flagship measure of global investment grade debt from twenty -four local curre ncy markets. This multi -currency benchmark includes treasury, government -related, corporate, and securitized fixed -rate bonds from both developed and emerging ma rkets issuers. The index was launched on January 1, 1990 . Bloomberg Barclays U.S. Corporate High Yield 2% Issuer Capped Index: The index measures the performance of high yield corporate bonds issued by US corporations, with a maximum allocation of 2% to any one issuer. ICE BofA Euro High Yield Index: The ICE BofA Euro High Yield Index tracks the performance of EUR denominated below investment grade corporate debt publicly issued in the euro domestic or Eurobond markets. ICE BofA Euro Corporate Index: The ICE BofA Euro Corporate Index tracks the performance of EUR denominated investment grade corporate debt publicly issued in the Eurobon d or Euro member domestic markets. ICE BofA US High Yield Index: The ICE BofA US High Yield Index provides a comprehensive, accurate representation of the US high yield market and its components.Index Definitions
Important Notes: This material must be preceded or accompanied by a current prospectus . Investors should read it carefully before investing or sending money. Risk Disclosures: Investing involves risk, including possible loss ofprincipal. There canbenoassurance that aFund willachieve itsstated objectives. Indices areunmanaged anddonotinclude theeffect offees. One cannot invest directly inanindex. This information should notberelied upon asresearch, investment advice, orarecommendation regarding anyproducts, strategies, oranysecurity inparticular. This material isstrictly forillustrative, educational, or informational purposes andis subject tochange. Certain content represents anassessment ofthemarket environment ataspecific time andisnotintended tobeaforecast offuture events oraguarantee offuture results; material isasofthedates noted andissubject tochange without notice. TheFund may invest inderivatives, which areoften more volatile than other investments andmay magnify theFund’s gains orlosses. Aderivative (i.e., futures/forward contracts, swaps, andoptions) isacontract that derives itsvalue from the performance ofanunderlying asset. Theprimary riskofderivatives isthat changes intheasset’s market value andthederivative may notbeproportionate, andsome derivatives canhave the potential forunlimited losses. Derivatives arealso subject toliquidity andcounterparty risk. TheFund issubject toliquidity risk, meaning that certain investments may become difficult topurchase orsellatareasonable time andprice. Ifatransaction forthese securities islarge, itmay notbepossible to initiate, which may cause theFund tosuffer losses. Counterparty riskistheriskofloss intheevent that thecounterparty toan agreement fails tomake required payments orotherwise comply with theterms ofthederivative. TheFund issubject tothelegal, regulatory, political andeconomic instability associated with investing inAsia-Pacific countries including China andJapan which may cause adecline invalue. Japan hasalso experienced natural disasters ofvarying degrees ofseverity, which could negatively affect theFund. Emerging markets involve heightened riskrelated tothesame factors aswell asincrease volatility andlower trading volume. Fluctuations incurrency offoreign countries may have an adverse effect todomestic currency values. TheFund caninvest inbonds generally andhigh yield bonds specifically. High yield bonds involve greater risks of default ordowngrade andaremore volatile than investment grade securities. TheFund is subject tointerest rate risk, which isthechance that bonds willdecline invalue asinterest rates rise. TheFund issubject to liquidity risk, meaning that certain investments may become difficult topurchase orsellatareasonable time andprice. Ifa transaction forthese securities islarge, itmay notbepossible toinitiate which may cause the Fund tosuffer losses. TheFund issubject tosovereign andquasi -sovereign debt risk. Thegovernmental authority that controls therepayment ofsovereign andquasi -sovereign debt may beunwilling orunable torepay theprincipal and/or interest when due. KHYB isnon-diversified. ETFshares arebought andsold onanexchange atmarket price (not NAV) andarenotindividually redeemed from theFund. However, shares may beredeemed atNAV directly bycertain authorized broker -dealers (Authorized Participants) invery large creation/redemption units. Thereturns shown donotrepresent thereturns youwould receive ifyoutraded shares atother times. Shares may trade atapremium ordiscount to their NAV inthesecondary market. Brokerage commissions will reduce returns. Beginning 12/23/2020, market price returns arebased ontheofficial closing price ofanETFshare or,iftheofficial closing price isn't available, themidpoint between thenational best bidandnational best offer ("NBBO") asofthetime theETFcalculates thecurrent NAV pershare. Prior tothat date, market price returns were based onthemidpoint between theBidandAskprice. NAVs arecalculated using prices asof4:00 PMEastern Time. TheKraneShares ETFs, KFA Funds ETFs, andKraneShares Mutual Funds aredistributed bySEIInvestments Distribution Company (SIDCO), 1Freedom Valley Drive, Oaks, PA19456, which isnotaffiliated with Krane Funds Advisors, LLC, the Investment Adviser fortheFunds, oranysub-advisers fortheFunds.