Carbon ETC Presentation
by Kraneshares
KraneShares ETC Securities Programme
Investing in the Global Carbon Credit Markets
For select intermediaries only for the purpose of product discussions only
contact: europe@kraneshares.com
Date: 31/Dec/2025

Introduction to KraneShares
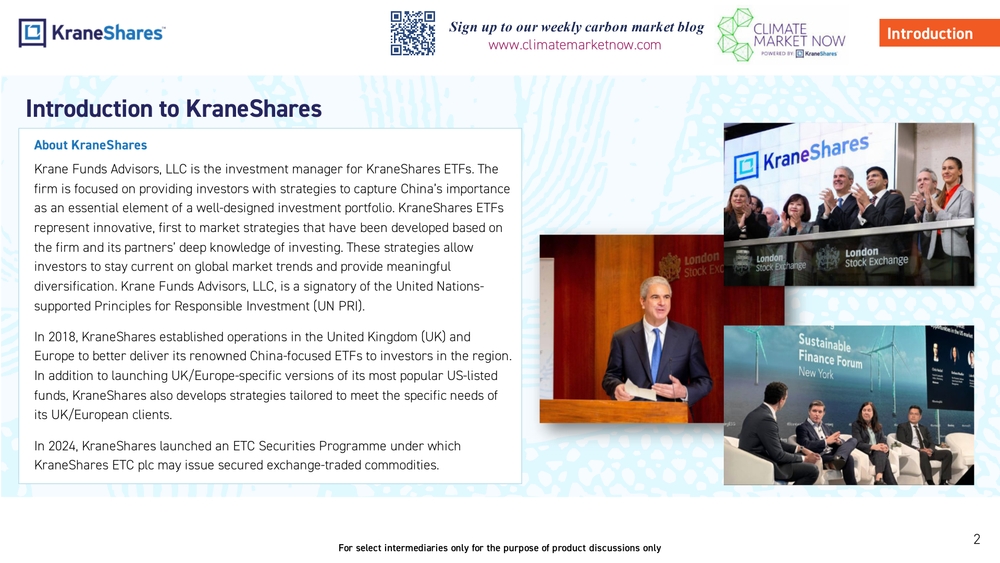
About KraneShares
Krane Funds Advisors, LLC is the investment manager for KraneShares ETFs. The firm is focused on providing investors with strategies to capture China's importance as an essential element of a well-designed investment portfolio. KraneShares ETFs represent innovative, first to market strategies that have been developed based on the firm and its partners' deep knowledge of investing. These strategies allow investors to stay current on global market trends and provide meaningful diversification. Krane Funds Advisors, LLC, is a signatory of the United Nations-supported Principles for Responsible Investment (UN PRI).
In 2018, KraneShares established operations in the United Kingdom (UK) and Europe to better deliver its renowned China-focused ETFs to investors in the region. In addition to launching UK/Europe-specific versions of its most popular US-listed funds, KraneShares also develops strategies tailored to meet the specific needs of its UK/European clients.
In 2024, KraneShares launched an ETC Securities Programme under which KraneShares ETC plc may issue secured exchange-traded commodities.
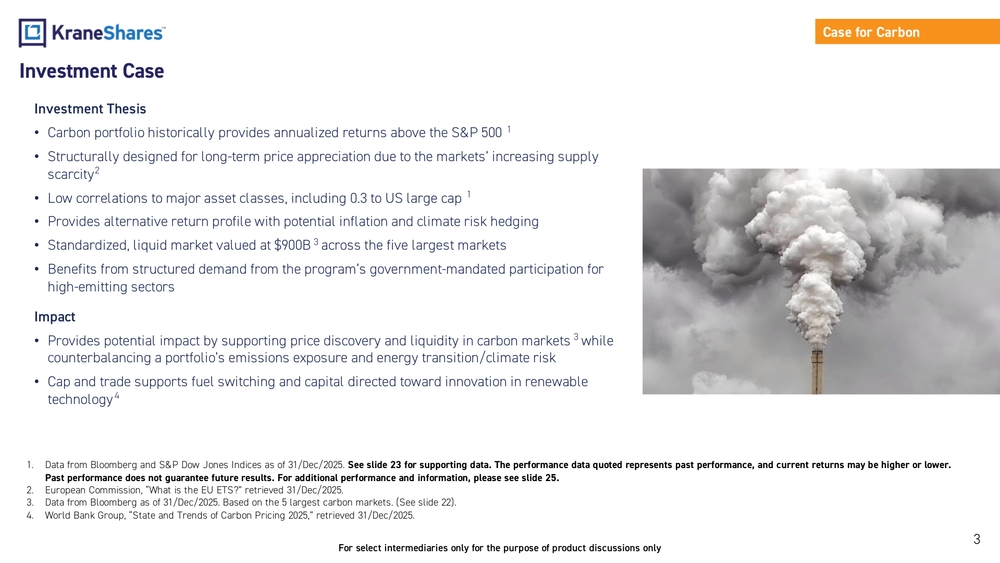
Investment Case
Investment Thesis
- Carbon portfolio historically provides annualized returns above the S&P 500
- Structurally designed for long-term price appreciation due to the markets' increasing supply scarcity
- Low correlations to major asset classes, including 0.3 to US large cap
- Provides alternative return profile with potential inflation and climate risk hedging
- Standardized, liquid market valued at $900B across the five largest markets
- Benefits from structured demand from the program's government-mandated participation for high-emitting sectors
Impact
- Provides potential impact by supporting price discovery and liquidity in carbon markets while counterbalancing a portfolio's emissions exposure and energy transition/climate risk
- Cap and trade supports fuel switching and capital directed toward innovation in renewable technology
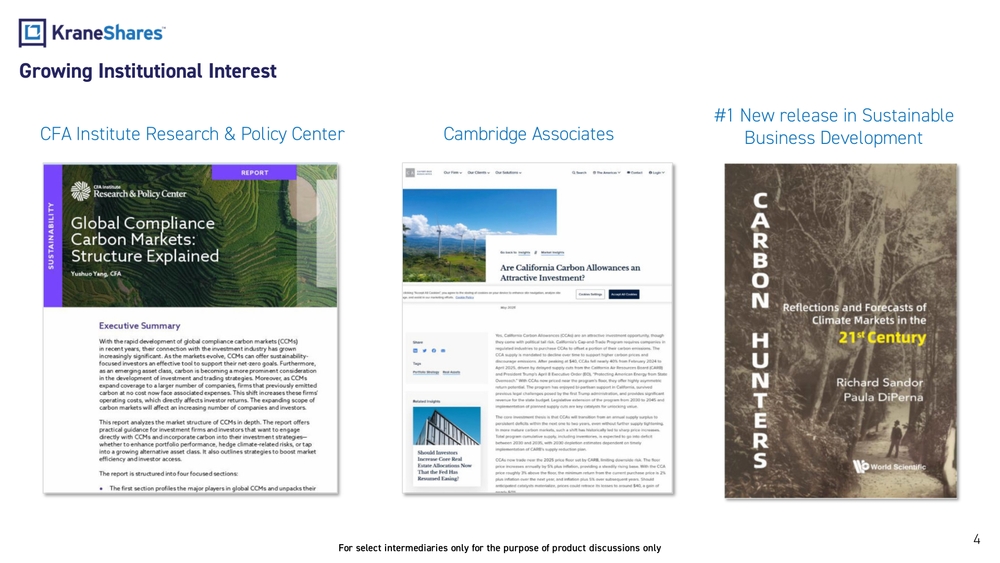
Growing Institutional Interest
The page displays three institutional research publications related to carbon markets:
- CFA Institute Research & Policy Center publication on Global Compliance Carbon Markets
- Cambridge Associates research on California Carbon Allowances
- A book titled "Carbon: Reflections and Forecasts of Climate Markets in the 21st Century" marked as #1 New release in Sustainable Business Development
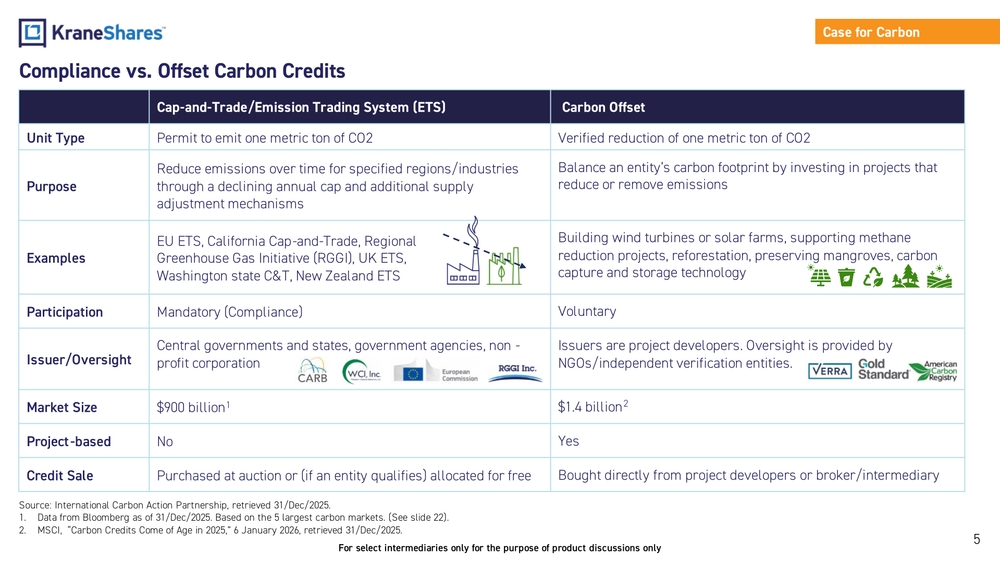
Compliance vs. Offset Carbon Credits
| Cap-and-Trade/Emission Trading System (ETS) | Carbon Offset | |
|---|---|---|
| Unit Type | Permit to emit one metric ton of CO2 | Verified reduction of one metric ton of CO2 |
| Purpose | Reduce emissions over time for specified regions/industries through a declining annual cap and additional supply adjustment mechanisms | Balance an entity's carbon footprint by investing in projects that reduce or remove emissions |
| Examples | EU ETS, California Cap-and-Trade, Regional Greenhouse Gas Initiative (RGGI), UK ETS, Washington state C&T, New Zealand ETS | Building wind turbines or solar farms, supporting methane reduction projects, reforestation, preserving mangroves, carbon capture and storage technology |
| Participation | Mandatory (Compliance) | Voluntary |
| Issuer/Oversight | Central governments and states, government agencies, non-profit corporation | Issuers are project developers. Oversight is provided by NGOs/independent verification entities. |
| Market Size | $900 billion | $1.4 billion |
| Project-based | No | Yes |
| Credit Sale | Purchased at auction or (if an entity qualifies) allocated for free | Bought directly from project developers or broker/intermediary |
Compliance Carbon Market Overview
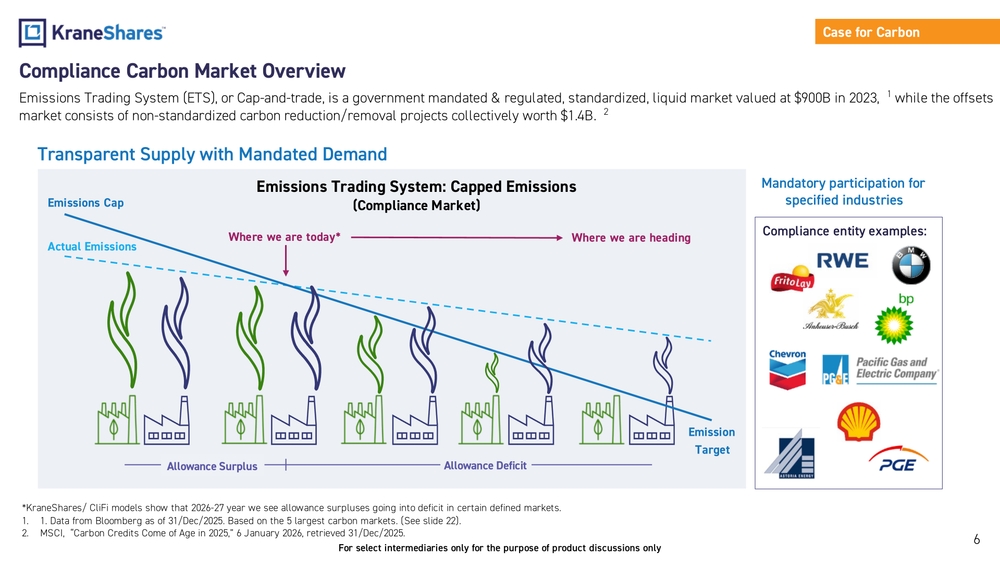
Emissions Trading System (ETS), or Cap-and-trade, is a government mandated & regulated, standardized, liquid market valued at $900B in 2023, while the offsets market consists of non-standardized carbon reduction/removal projects collectively worth $1.4B.
Transparent Supply with Mandated Demand
Emissions Trading System: Capped Emissions (Compliance Market)
The diagram illustrates the concept of emissions cap versus actual emissions, showing:
- Emissions Cap declining over time
- Actual Emissions trajectory
- Allowance Surplus transitioning to Allowance Deficit
- Current position ("Where we are today") and future trajectory ("Where we are heading")
- Emission Target endpoint
KraneShares/CliFi models show that 2026-27 year we see allowance surpluses going into deficit in certain defined markets.
Mandatory participation for specified industries
Compliance entity examples include major corporations across various industries such as energy, automotive, food and beverage, and utilities.
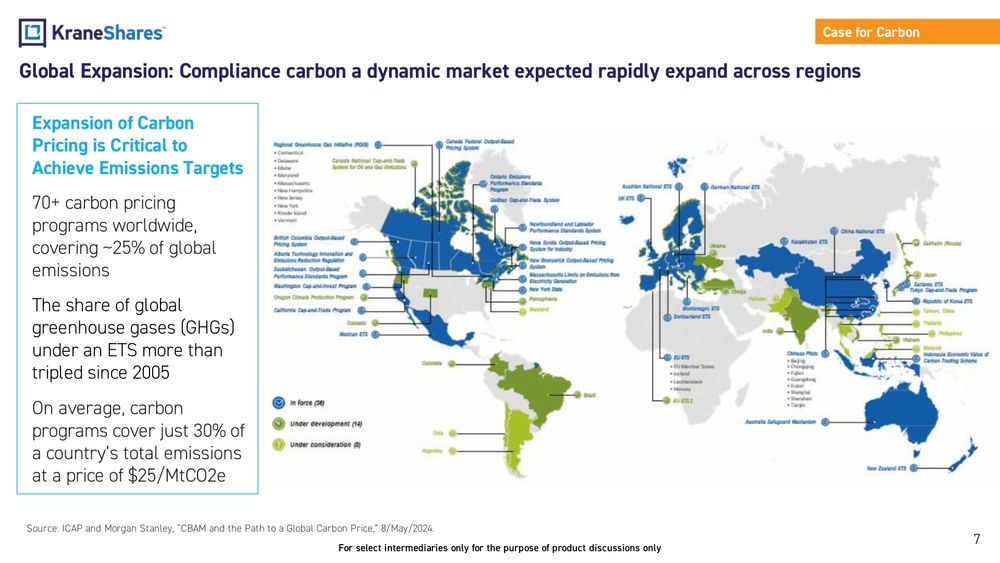
Global Expansion: Compliance carbon a dynamic market expected to rapidly expand across regions
Expansion of Carbon Pricing is Critical to Achieve Emissions Targets
- 70+ carbon pricing programs worldwide, covering ~25% of global emissions
- The share of global greenhouse gases (GHGs) under an ETS more than tripled since 2005
- On average, carbon programs cover just 30% of a country's total emissions at a price of $25/MtCO2e
The image shows a world map highlighting regions with carbon pricing mechanisms in place (blue), under development (green), or under consideration (yellow).
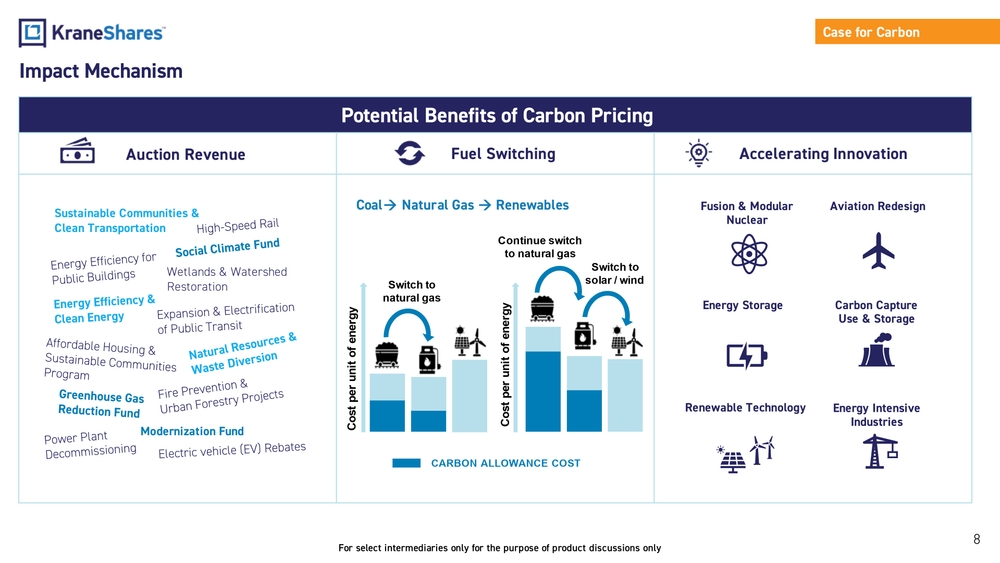
Impact Mechanism
Potential Benefits of Carbon Pricing
Auction Revenue
- Sustainable Communities & Clean Transportation
- Energy Efficiency for Public Buildings
- Energy Efficiency & Clean Energy
- Affordable Housing & Sustainable Communities Program
- Greenhouse Gas Reduction Fund
- Power Plant Decommissioning
- High-Speed Rail
- Social Climate Fund
- Wetlands & Watershed Restoration
- Expansion & Electrification of Public Transit
- Natural Resources & Waste Diversion
- Fire Prevention & Urban Forestry Projects
- Modernization Fund
- Electric vehicle (EV) Rebates
Fuel Switching
- Coal → Natural Gas → Renewables progression
- Illustrated cost comparison showing carbon allowance cost impact on different energy sources
- Shows how carbon pricing makes renewable energy more competitive
Accelerating Innovation
- Fusion & Modular Nuclear
- Aviation Redesign
- Energy Storage
- Carbon Capture Use & Storage
- Renewable Technology
- Energy Intensive Industries
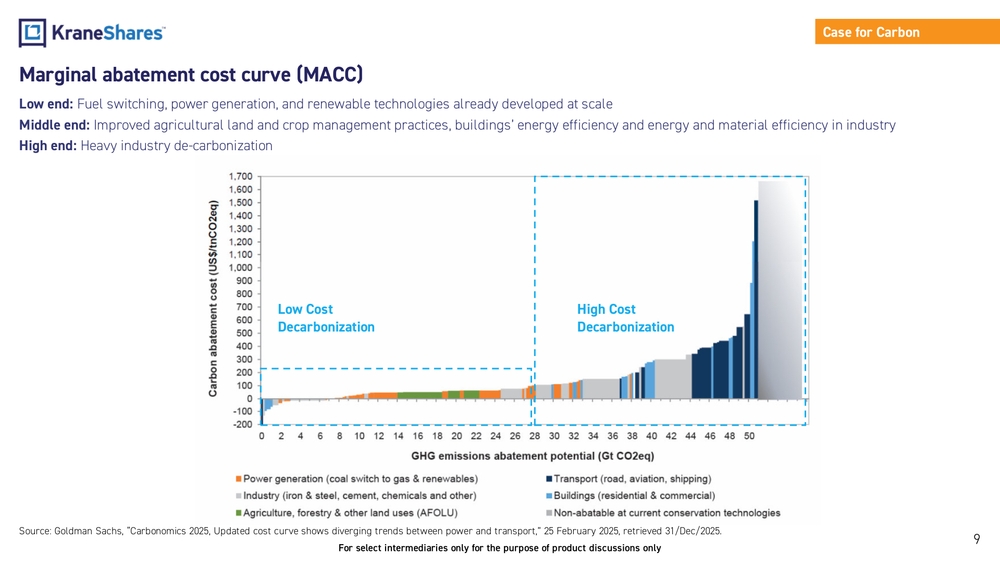
Marginal abatement cost curve (MACC)
- Low end: Fuel switching, power generation, and renewable technologies already developed at scale
- Middle end: Improved agricultural land and crop management practices, buildings' energy efficiency and energy and material efficiency in industry
- High end: Heavy industry de-carbonization
The image shows a marginal abatement cost curve graph with carbon abatement cost (US$/tnCO2eq) on the y-axis and GHG emissions abatement potential (Gt CO2eq) on the x-axis. The graph illustrates different sectors (power generation, transport, buildings, industry, agriculture) and their respective abatement costs and potentials, with costs rising sharply for the most difficult-to-abate sectors.
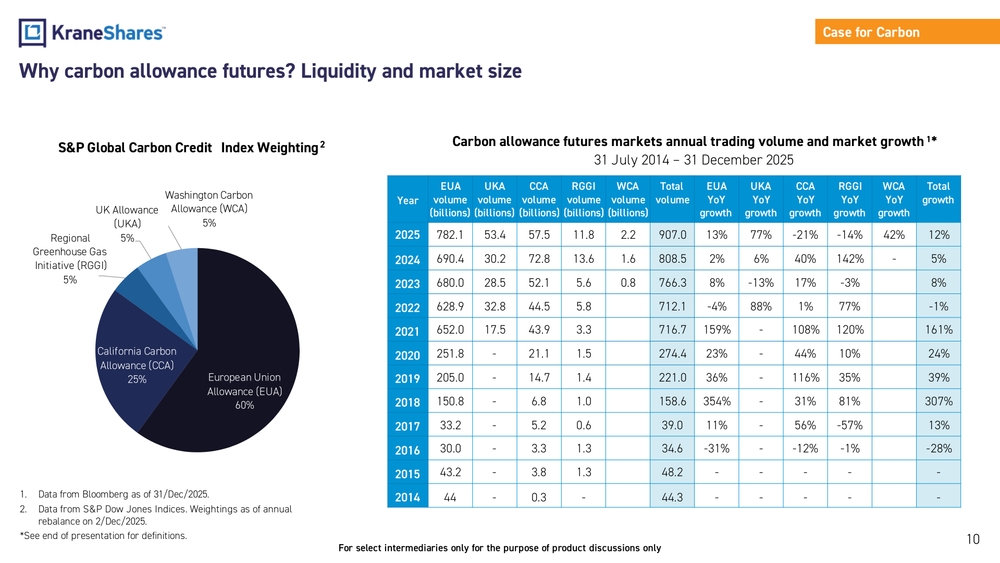
Why carbon allowance futures? Liquidity and market size
S&P Global Carbon Credit Index Weighting
- European Union Allowance (EUA): 60%
- California Carbon Allowance (CCA): 25%
- Regional Greenhouse Gas Initiative (RGGI): 5%
- UK Allowance (UKA): 5%
- Washington Carbon Allowance (WCA): 5%
Carbon allowance futures markets annual trading volume and market growth (31 July 2014 – 31 December 2025)
The page includes a detailed table showing annual trading volumes in billions for different carbon markets (EUA, UKA, CCA, RGGI, WCA) from 2014 to 2025, along with year-over-year growth rates.
Key highlights from 2025 data:
- Total volume across all markets: 907.0 billion
- EUA volume: 782.1 billion (13% YoY growth)
- UKA volume: 53.4 billion (77% YoY growth)
- CCA volume: 57.5 billion (-21% YoY growth)
- RGGI volume: 11.8 billion (-14% YoY growth)
- WCA volume: 2.2 billion (42% YoY growth)
- Total growth: 12%
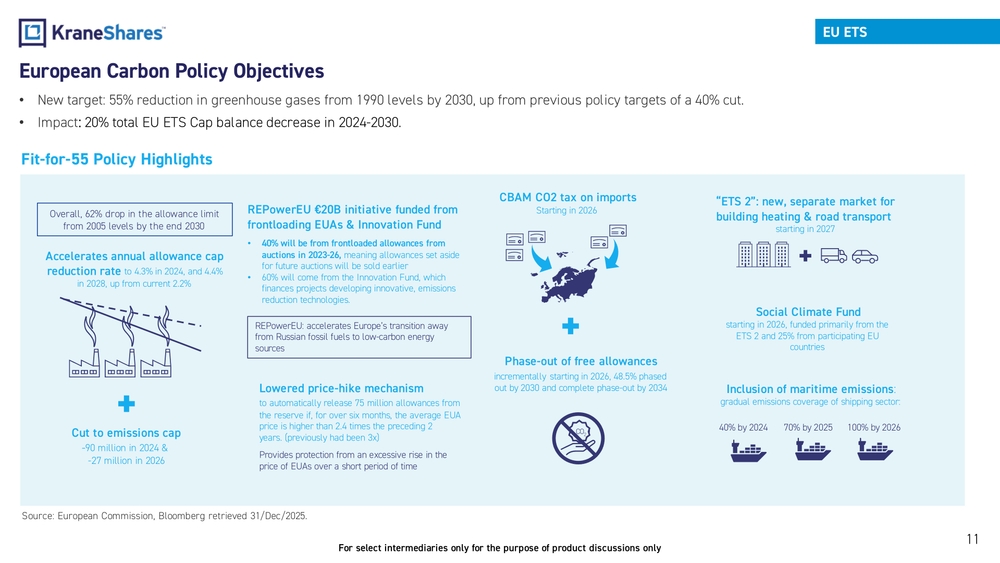
European Carbon Policy Objectives
- New target: 55% reduction in greenhouse gases from 1990 levels by 2030, up from previous policy targets of a 40% cut.
- Impact: 20% total EU ETS Cap balance decrease in 2024-2030.
Fit-for-55 Policy Highlights
-
CBAM CO2 tax on imports Starting in 2026
-
Accelerates annual allowance cap reduction rate to 4.3% in 2024, and 4.4% in 2028, up from current 2.2%
-
Cut to emissions cap -90 million in 2024 & -27 million in 2026 Overall, 62% drop in the allowance limit from 2005 levels by the end 2030
-
Phase-out of free allowances incrementally starting in 2026, 48.5% phased out by 2030 and complete phase-out by 2034
-
"ETS 2": new, separate market for building heating & road transport starting in 2027
-
Social Climate Fund starting in 2026, funded primarily from the ETS 2 and 25% from participating EU countries
-
Lowered price-hike mechanism to automatically release 75 million allowances from the reserve if, for over six months, the average EUA price is higher than 2.4 times the preceding 2 years. (previously had been 3x) Provides protection from an excessive rise in the price of EUAs over a short period of time
-
REPowerEU €20B initiative funded from frontloading EUAs & Innovation Fund
- 40% will be from frontloaded allowances from auctions in 2023-26, meaning allowances set aside for future auctions will be sold earlier
- 60% will come from the Innovation Fund, which finances projects developing innovative, emissions reduction technologies. REPowerEU: accelerates Europe's transition away from Russian fossil fuels to low-carbon energy sources
-
Inclusion of maritime emissions: gradual emissions coverage of shipping sector: 40% by 2024, 70% by 2025, 100% by 2026
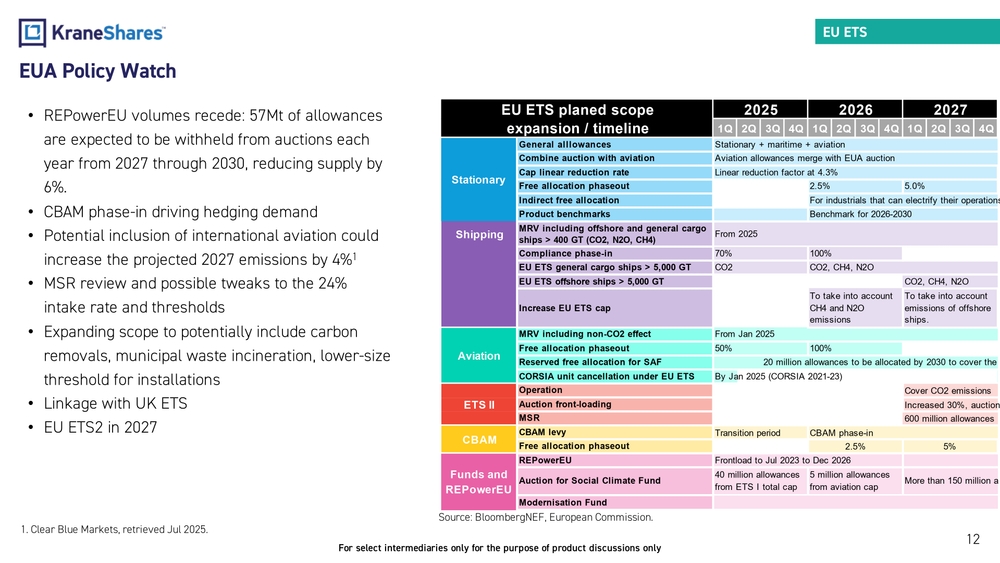
EUA Policy Watch
- REPowerEU volumes recede: 57Mt of allowances are expected to be withheld from auctions each year from 2027 through 2030, reducing supply by 6%.
- CBAM phase-in driving hedging demand
- Potential inclusion of international aviation could increase the projected 2027 emissions by 4%
- MSR review and possible tweaks to the 24% intake rate and thresholds
- Expanding scope to potentially include carbon removals, municipal waste incineration, lower-size threshold for installations
- Linkage with UK ETS
- EU ETS2 in 2027
EU ETS planned scope expansion / timeline
| Category | Policy Element | 2025 | 2026 | 2027 |
|---|---|---|---|---|
| Stationary | General allowances | Stationary + maritime + aviation | ||
| Combine auction with aviation | Aviation allowances merge with EUA auction | |||
| Cap linear reduction rate | Linear reduction factor at 4.3% | |||
| Free allocation phaseout | 2.5% | 5.0% | ||
| Indirect free allocation | For industrials that can electrify their operations | |||
| Product benchmarks | Benchmark for 2026-2030 | |||
| Shipping | MRV including offshore and general cargo ships > 400 GT (CO2, N2O, CH4) | From 2025 | ||
| Compliance phase-in | 70% | 100% | ||
| EU ETS general cargo ships > 5,000 GT | CO2 | CO2, CH4, N2O | ||
| EU ETS offshore ships > 5,000 GT | CO2, CH4, N2O | |||
| Increase EU ETS cap | To take into account CH4 and N2O emissions | To take into account emissions of offshore ships | ||
| Aviation | MRV including non-CO2 effect | From Jan 2025 | ||
| Free allocation phaseout | 50% | 100% | ||
| Reserved free allocation for SAF | 20 million allowances to be allocated by 2030 to cover the p | |||
| CORSIA unit cancellation under EU ETS | By Jan 2025 (CORSIA 2021-23) | |||
| ETS II | Operation | Cover CO2 emissions | ||
| Auction front-loading | Increased 30%, auctione | |||
| MSR | 600 million allowances p | |||
| CBAM | CBAM levy | Transition period | CBAM phase-in | |
| Free allocation phaseout | 2.5% | 5% | ||
| Funds and REPowerEU | REPowerEU | Frontload to Jul 2023 to Dec 2026 | ||
| Auction for Social Climate Fund | 40 million allowances from ETS I total cap | 5 million allowances from aviation cap | More than 150 million a |
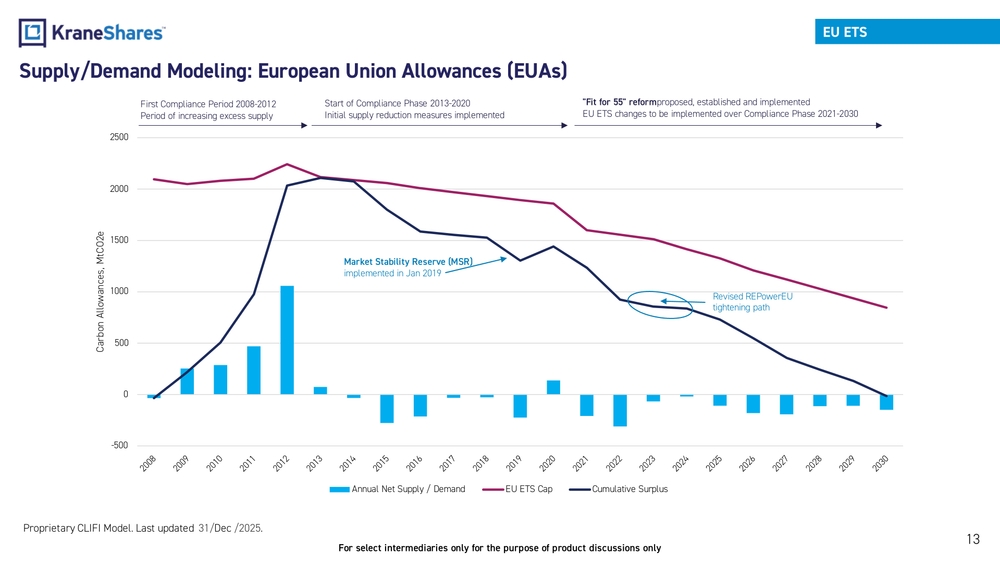
Supply/Demand Modeling: European Union Allowances (EUAs)
The chart shows the historical and projected supply and demand dynamics for European Union Allowances (EUAs) from 2008 to 2030, divided into several key periods:
- First Compliance Period 2008-2012: Period of increasing excess supply
- Start of Compliance Phase 2013-2020: Initial supply reduction measures implemented
- Market Stability Reserve (MSR): Implemented in January 2019
- "Fit for 55" reform: Proposed, established and implemented EU ETS changes to be implemented over Compliance Phase 2021-2030
- Revised REPowerEU tightening path: Shown affecting the cumulative surplus trajectory
The graph displays three key metrics:
- Annual Net Supply/Demand (blue bars)
- EU ETS Cap (red line) - showing a steady decline over time
- Cumulative Surplus (dark blue line) - showing the build-up of excess allowances and their projected decline
The chart illustrates how the cumulative surplus of allowances built up significantly during the early years of the program, peaked around 2012, and is now on a declining trajectory due to policy interventions and tightening supply.
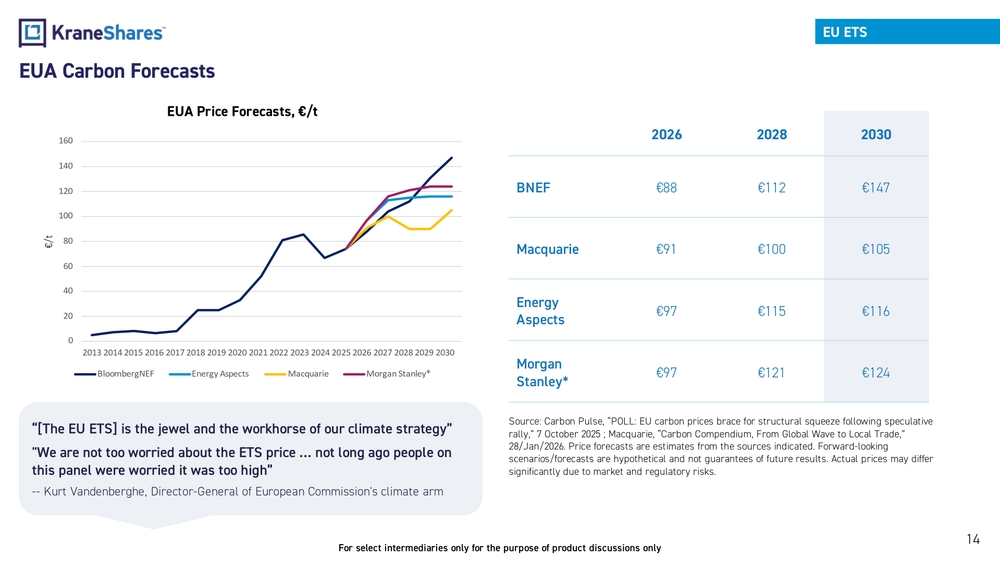
EUA Carbon Forecasts
EUA Price Forecasts, €/t
| 2026 | 2028 | 2030 | |
|---|---|---|---|
| BNEF | €88 | €112 | €147 |
| Macquarie | €91 | €100 | €105 |
| Energy Aspects | €97 | €115 | €116 |
| Morgan Stanley* | €97 | €121 | €124 |
"[The EU ETS] is the jewel and the workhorse of our climate strategy"
"We are not too worried about the ETS price ... not long ago people on this panel were worried it was too high"
-- Kurt Vandenberghe, Director-General of European Commission's climate arm
Source: Carbon Pulse, "POLL: EU carbon prices brace for structural squeeze following speculative rally," 7 October 2025; Macquarie, "Carbon Compendium, From Global Wave to Local Trade," 28/Jan/2026. Price forecasts are estimates from the sources indicated. Forward-looking scenarios/forecasts are hypothetical and not guarantees of future results. Actual prices may differ significantly due to market and regulatory risks.
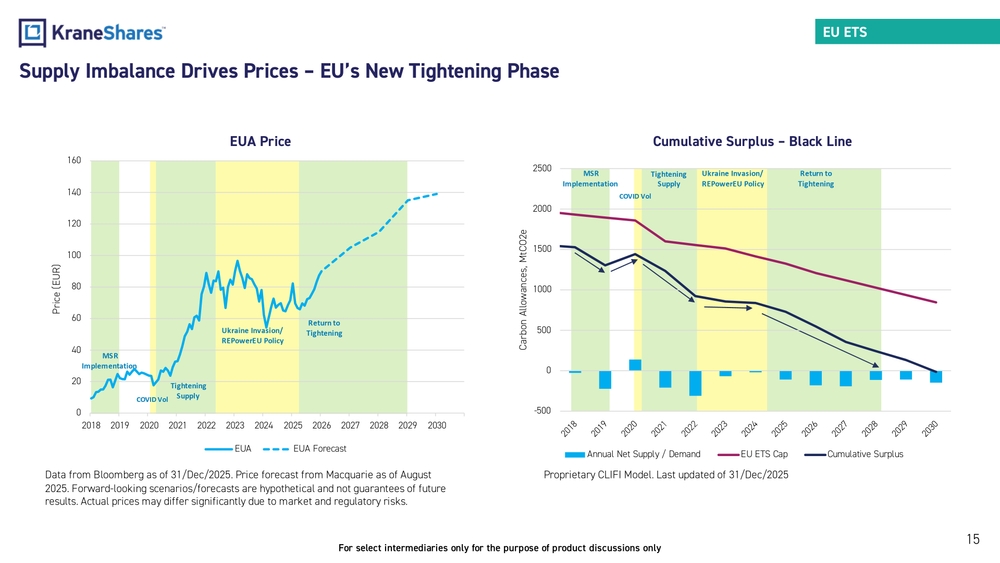
Supply Imbalance Drives Prices – EU's New Tightening Phase
The page presents two related charts showing the relationship between EUA prices and market supply dynamics:
Left Chart: EUA Price
A line graph showing historical EUA prices from 2018 to 2025 and forecasted prices through 2030. The chart is divided into color-coded periods:
- MSR Implementation (green)
- COVID Volatility (yellow)
- Tightening Supply (green)
- Ukraine Invasion/REPowerEU Policy (yellow)
- Return to Tightening (green)
The price line shows significant growth from around €20 in 2018-2019 to approximately €80-90 in 2023-2025, with a forecasted continued rise to nearly €140 by 2030 (shown as a dotted line).
Right Chart: Cumulative Surplus
A corresponding chart showing:
- Annual Net Supply/Demand (blue bars)
- EU ETS Cap (burgundy line) showing steady decline
- Cumulative Surplus (black line) showing significant decline
The same color-coded periods are marked, illustrating how policy interventions and market events have affected the surplus of allowances over time.
The charts together demonstrate how the declining cumulative surplus (increasing scarcity) correlates with rising EUA prices, with projections showing this trend continuing through 2030.
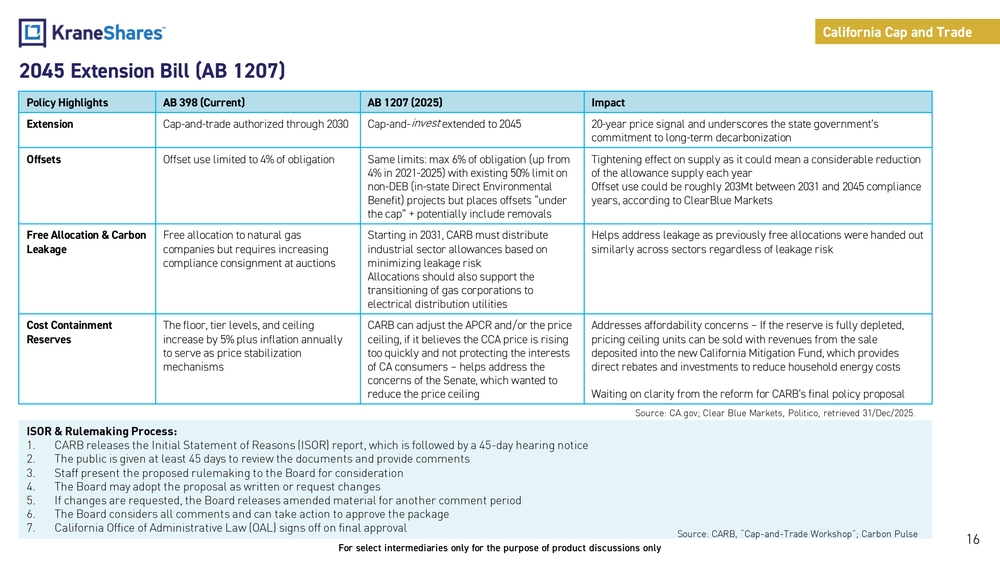
2045 Extension Bill (AB 1207)
Policy Highlights Comparison
| Policy Highlights | AB 398 (Current) | AB 1207 (2025) | Impact |
|---|---|---|---|
| Extension | Cap-and-trade authorized through 2030 | Cap-and-invest extended to 2045 | 20-year price signal and underscores the state government's commitment to long-term decarbonization |
| Offsets | Offset use limited to 4% of obligation | Same limits: max 6% of obligation (up from 4% in 2021-2025) with existing 50% limit on non-DEB (in-state Direct Environmental Benefit) projects but places offsets "under the cap" + potentially include removals | Tightening effect on supply as it could mean a considerable reduction of the allowance supply each year. Offset use could be roughly 203Mt between 2031 and 2045 compliance years, according to ClearBlue Markets |
| Free Allocation & Carbon Leakage | Free allocation to natural gas companies but requires increasing compliance consignment at auctions | Starting in 2031, CARB must distribute industrial sector allowances based on minimizing leakage risk. Allocations should also support the transitioning of gas corporations to electrical distribution utilities | Helps address leakage as previously free allocations were handed out similarly across sectors regardless of leakage risk |
| Cost Containment Reserves | The floor, tier levels, and ceiling increase by 5% plus inflation annually to serve as price stabilization mechanisms | CARB can adjust the APCR and/or the price ceiling, if it believes the CCA price is rising too quickly and not protecting the interests of CA consumers – helps address the concerns of the Senate, which wanted to reduce the price ceiling | Addresses affordability concerns – If the reserve is fully depleted, pricing ceiling units can be sold with revenues from the sale deposited into the new California Mitigation Fund, which provides direct rebates and investments to reduce household energy costs. Waiting on clarity from the reform for CARB's final policy proposal |
ISOR & Rulemaking Process:
- CARB releases the Initial Statement of Reasons (ISOR) report, which is followed by a 45-day hearing notice
- The public is given at least 45 days to review the documents and provide comments
- Staff present the proposed rulemaking to the Board for consideration
- The Board may adopt the proposal as written or request changes
- If changes are requested, the Board releases amended material for another comment period
- The Board considers all comments and can take action to approve the package
- California Office of Administrative Law (OAL) signs off on final approval
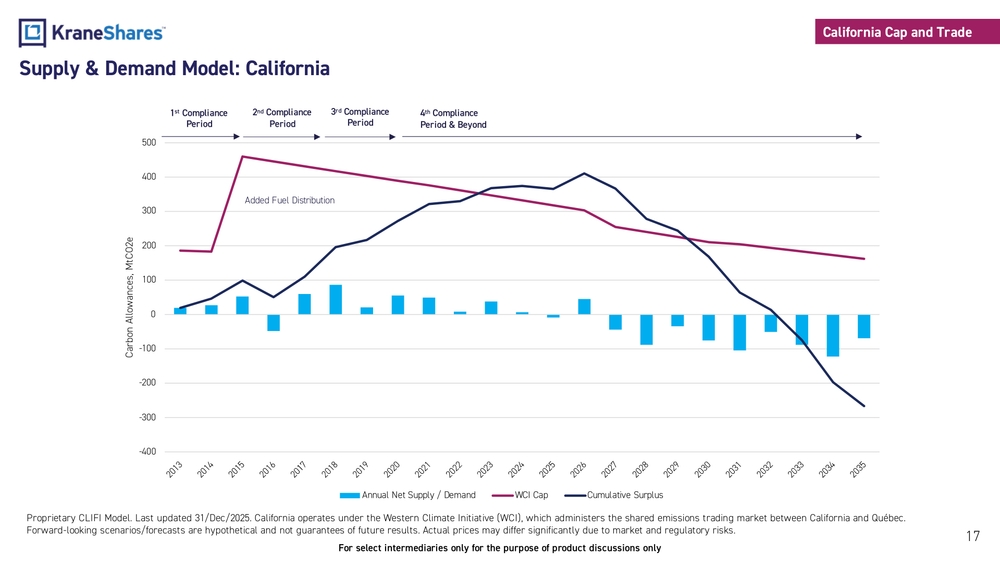
Supply & Demand Model: California
The chart presents a comprehensive supply and demand model for California's carbon market from 2013 projected through 2035. The visualization includes:
- Blue bars: Annual Net Supply/Demand (showing positive values in early years transitioning to negative values in later years)
- Burgundy line: WCI Cap (Western Climate Initiative Cap) showing steady decline over time
- Dark blue line: Cumulative Surplus showing rise and then significant projected decline
The chart is divided into four compliance periods:
- 1st Compliance Period: Early market establishment
- 2nd Compliance Period: Notable for "Added Fuel Distribution" expansion of program scope
- 3rd Compliance Period: Current phase
- 4th Compliance Period & Beyond: Future projections
The model illustrates how California's carbon market is projected to shift from surplus to deficit, with the cumulative surplus line crossing into negative territory around 2031-2032. This transition from surplus to structural deficit is a key feature of the market's future trajectory.
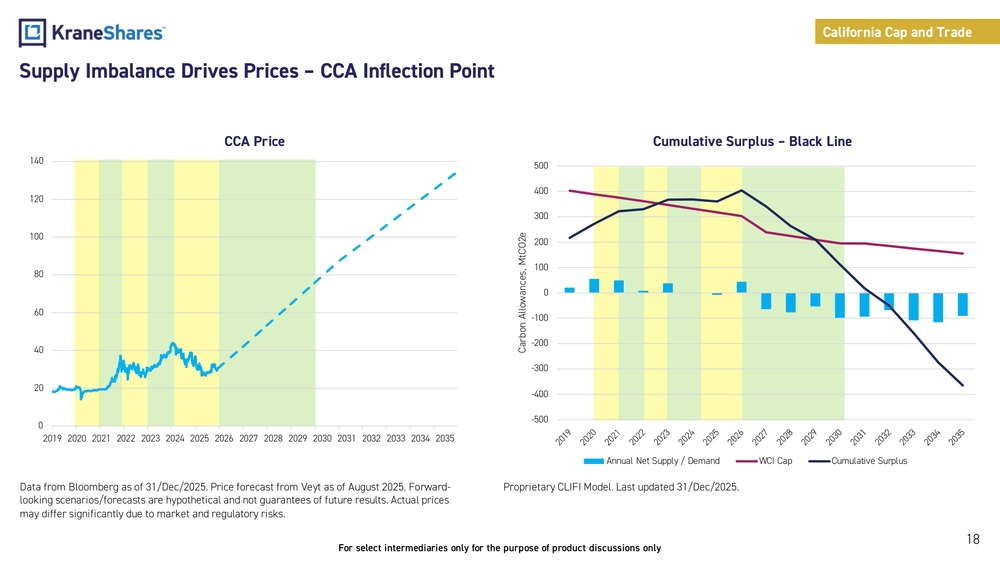
Supply Imbalance Drives Prices – CCA Inflection Point
The page presents two complementary charts illustrating the relationship between market supply dynamics and California Carbon Allowance (CCA) prices:
Left Chart: CCA Price
A line graph showing historical CCA prices from 2019 to 2025 (solid blue line) and forecasted prices through 2035 (dotted blue line). The price starts around $20 in 2019 and is projected to rise dramatically to over $120 by 2035.
Right Chart: Cumulative Surplus – Black Line
A corresponding chart showing:
- Annual Net Supply/Demand (blue bars)
- WCI Cap (burgundy line) showing steady decline
- Cumulative Surplus (black line) showing rise and then significant projected decline
The chart illustrates how the cumulative surplus of allowances is projected to peak around 2026-2027 at approximately 400 MtCO2e before declining sharply, crossing into negative territory around 2031-2032 and reaching approximately -400 MtCO2e by 2035.
The two charts together demonstrate the correlation between declining surplus (increasing scarcity) and rising CCA prices, with the inflection point in the cumulative surplus curve corresponding to accelerated price increases in the forecast.
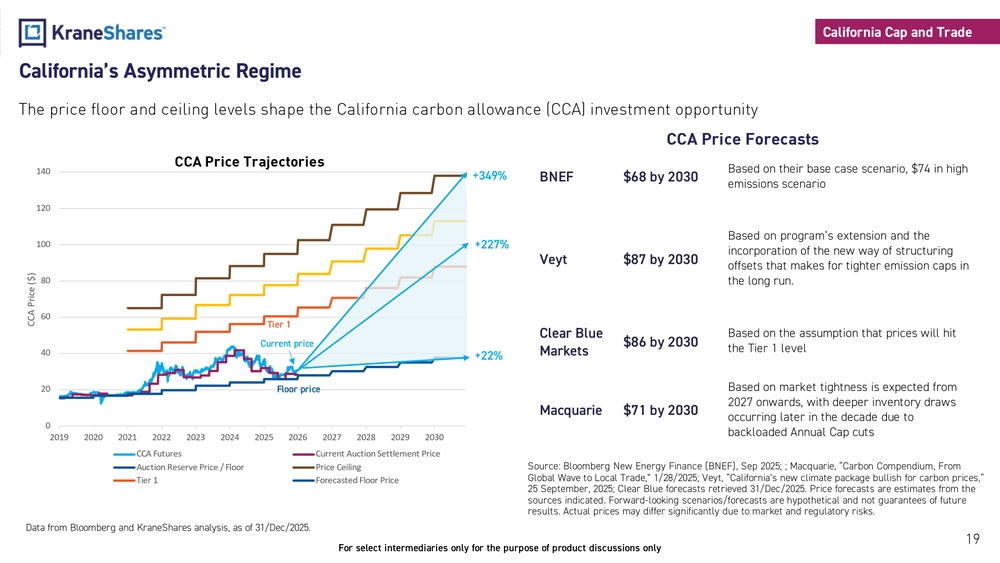
California's Asymmetric Regime
The price floor and ceiling levels shape the California carbon allowance (CCA) investment opportunity
CCA Price Trajectories
The chart shows multiple price trajectories from 2019 to 2030:
- CCA Futures (actual market prices): Blue line showing historical prices around $30-40
- Current Auction Settlement Price: Burgundy line
- Auction Reserve Price / Floor Price: Dark blue line starting around $20 in 2019 and rising steadily
- Price Ceiling: Brown line starting around $65 in 2019 and rising to approximately $140 by 2030
- Tier 1: Red line representing the first price containment reserve tier
The chart highlights three potential price growth scenarios from current levels:
- +22%: Growth to the floor price (minimum expected growth)
- +227%: Growth to the Tier 1 reserve price
- +349%: Growth to the price ceiling (maximum regulated price)
CCA Price Forecasts
| Analyst | Forecast | Basis |
|---|---|---|
| BNEF | $68 by 2030 | Based on their base case scenario, $74 in high emissions scenario |
| Veyt | $87 by 2030 | Based on program's extension and the incorporation of the new way of structuring offsets that makes for tighter emission caps in the long run |
| Clear Blue Markets | $86 by 2030 | Based on the assumption that prices will hit the Tier 1 level |
| Macquarie | $71 by 2030 | Based on market tightness expected from 2027 onwards, with deeper inventory draws occurring later in the decade due to backloaded Annual Cap cuts |
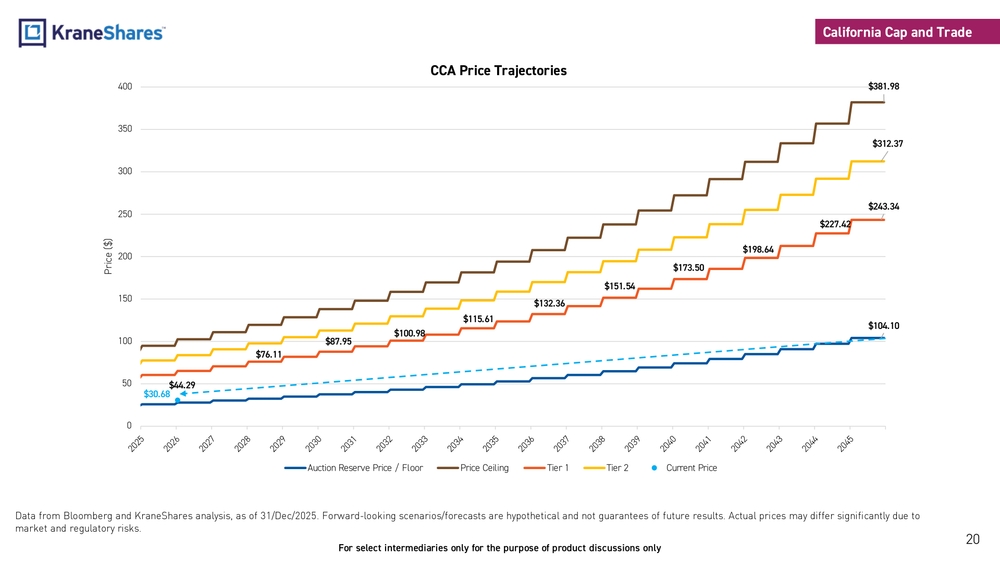
CCA Price Trajectories
The chart presents a detailed long-term projection of California Carbon Allowance (CCA) price trajectories from 2025 through 2045, showing the structured price containment mechanism:
-
Auction Reserve Price / Floor Price (dark blue line): Starting at approximately $30.68 in 2025 and rising steadily to $104.10 by 2045
-
Price Ceiling (brown line): Starting at approximately $90-100 in 2025 and rising to $381.98 by 2045
-
Tier 1 (red line): First price containment reserve level, starting around $60 in 2025 and rising to $243.34 by 2045
-
Tier 2 (yellow line): Second price containment reserve level, starting around $70 in 2025 and rising to $312.37 by 2045
-
Current Price (blue dot): Marked at approximately $44.29
The chart illustrates the long-term price containment structure of California's carbon market, with all price tiers increasing annually at a rate of 5% plus inflation. This creates a widening band between the floor and ceiling prices over time, with significant upside potential from current price levels.
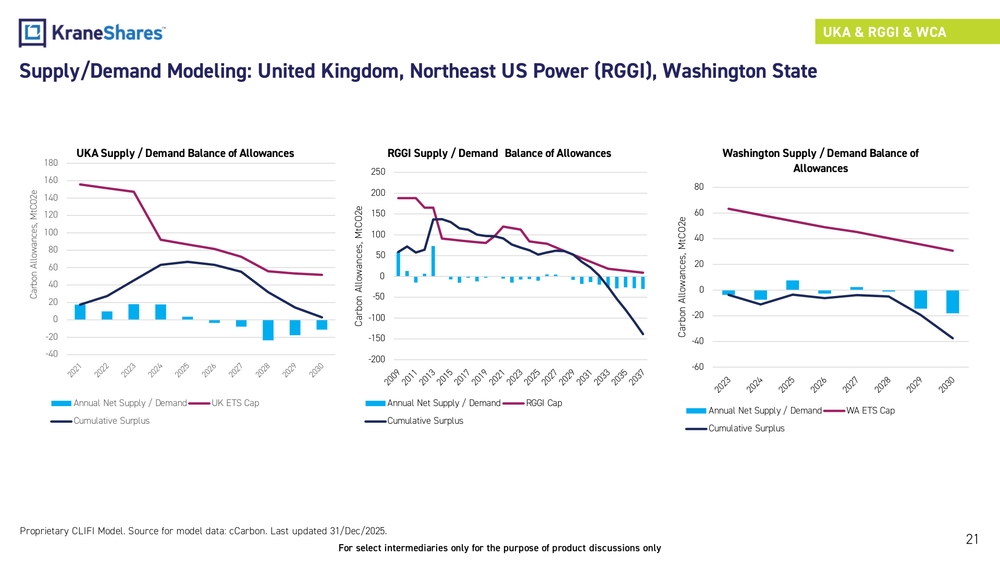
Supply/Demand Modeling: United Kingdom, Northeast US Power (RGGI), Washington State
Proprietary CLIFI Model. Source for model data: cCarbon. Last updated 31/Dec/2025.
The page displays three charts showing supply/demand balance of carbon allowances for three different markets:
- UKA Supply / Demand Balance of Allowances
- RGGI Supply / Demand Balance of Allowances
- Washington Supply / Demand Balance of Allowances
Each chart shows:
- Annual Net Supply / Demand (blue bars)
- ETS Cap lines (purple)
- Cumulative Surplus trends (dark blue lines)
Why carbon allowance futures? Liquidity and market size
Carbon allowance futures markets annual trading volume and market growth
31 July 2014 – 31 December 2025
S&P Global Carbon Credit Index Weighting
- European Union Allowance (EUA): 60%
- California Carbon Allowance (CCA): 25%
- Regional Greenhouse Gas Initiative (RGGI): 5%
- UK Allowance (UKA): 5%
- Washington Carbon Allowance (WCA): 5%
Trading Volume and Growth Table
The table shows annual trading volumes (in billions) and year-over-year growth for different carbon markets from 2014 to 2025:
| Year | EUA volume | UKA volume | CCA volume | RGGI volume | WCA volume | Total volume | EUA YoY growth | UKA YoY growth | CCA YoY growth | RGGI YoY growth | WCA YoY growth | Total growth |
|---|---|---|---|---|---|---|---|---|---|---|---|---|
| 2025 | 782.1 | 53.4 | 57.5 | 11.8 | 2.2 | 907.0 | 13% | 77% | -21% | -14% | 42% | 12% |
| 2024 | 690.4 | 30.2 | 72.8 | 13.6 | 1.6 | 808.5 | 2% | 6% | 40% | 142% | - | 5% |
| 2023 | 680.0 | 28.5 | 52.1 | 5.6 | 0.8 | 766.3 | 8% | -13% | 17% | -3% | - | 8% |
| 2022 | 628.9 | 32.8 | 44.5 | 5.8 | - | 712.1 | -4% | 88% | 1% | 77% | - | -1% |
| 2021 | 652.0 | 17.5 | 43.9 | 3.3 | - | 716.7 | 159% | - | 108% | 120% | - | 161% |
| 2020 | 251.8 | - | 21.1 | 1.5 | - | 274.4 | 23% | - | 44% | 10% | - | 24% |
| 2019 | 205.0 | - | 14.7 | 1.4 | - | 221.0 | 36% | - | 116% | 35% | - | 39% |
| 2018 | 150.8 | - | 6.8 | 1.0 | - | 158.6 | 354% | - | 31% | 81% | - | 307% |
| 2017 | 33.2 | - | 5.2 | 0.6 | - | 39.0 | 11% | - | 56% | -57% | - | 13% |
| 2016 | 30.0 | - | 3.3 | 1.3 | - | 34.6 | -31% | - | -12% | -1% | - | -28% |
| 2015 | 43.2 | - | 3.8 | 1.3 | - | 48.2 | - | - | - | - | - | - |
| 2014 | 44 | - | 0.3 | - | - | 44.3 | - | - | - | - | - | - |

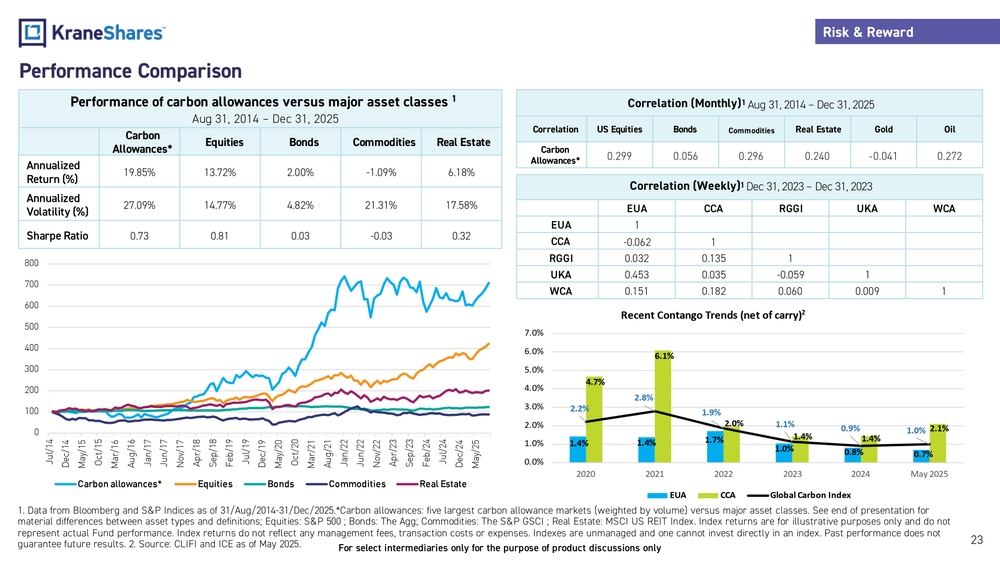
Performance Comparison
Performance of carbon allowances versus major asset classes
Aug 31, 2014 – Dec 31, 2025
| Carbon Allowances* | Equities | Bonds | Commodities | Real Estate | |
|---|---|---|---|---|---|
| Annualized Return (%) | 19.85% | 13.72% | 2.00% | -1.09% | 6.18% |
| Annualized Volatility (%) | 27.09% | 14.77% | 4.82% | 21.31% | 17.58% |
| Sharpe Ratio | 0.73 | 0.81 | 0.03 | -0.03 | 0.32 |
Correlation (Monthly) Aug 31, 2014 – Dec 31, 2025
| Correlation | US Equities | Bonds | Commodities | Real Estate | Gold | Oil |
|---|---|---|---|---|---|---|
| Carbon Allowances* | 0.299 | 0.056 | 0.296 | 0.240 | -0.041 | 0.272 |
Correlation (Weekly) Dec 31, 2023 – Dec 31, 2023
| EUA | CCA | RGGI | UKA | WCA | |
|---|---|---|---|---|---|
| EUA | 1 | ||||
| CCA | -0.062 | 1 | |||
| RGGI | 0.032 | 0.135 | 1 | ||
| UKA | 0.453 | 0.035 | -0.059 | 1 | |
| WCA | 0.151 | 0.182 | 0.060 | 0.009 | 1 |
Recent Contango Trends (net of carry)
| 2020 | 2021 | 2022 | 2023 | 2024 | May 2025 | |
|---|---|---|---|---|---|---|
| EUA | 1.4% | 1.4% | 1.7% | 1.0% | 0.8% | 0.7% |
| CCA | 4.7% | 6.1% | 2.0% | 1.4% | 1.4% | 2.1% |
| Global Carbon Index | 2.2% | 2.8% | 1.9% | 1.1% | 0.9% | 1.0% |
Carbon allowances: five largest carbon allowance markets (weighted by volume) versus major asset classes. See end of presentation for material differences between asset types and definitions; Equities: S&P 500; Bonds: The Agg; Commodities: The S&P GSCI; Real Estate: MSCI US REIT Index.
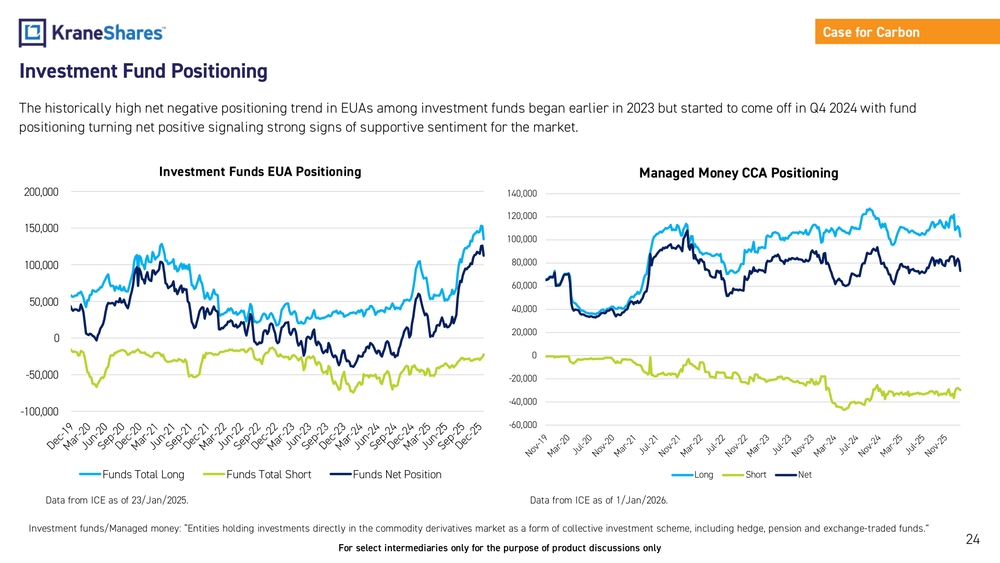
Investment Fund Positioning
The historically high net negative positioning trend in EUAs among investment funds began earlier in 2023 but started to come off in Q4 2024 with fund positioning turning net positive signaling strong signs of supportive sentiment for the market.
Investment Funds EUA Positioning
Chart showing trends in Funds Total Long, Funds Total Short, and Funds Net Position from December 2019 to December 2025
Managed Money CCA Positioning
Chart showing trends in Long, Short, and Net positions from November 2019 to November 2025
Data from ICE as of 23/Jan/2025 and 1/Jan/2026.
Investment funds/Managed money: "Entities holding investments directly in the commodity derivatives market as a form of collective investment scheme, including hedge, pension and exchange-traded funds."
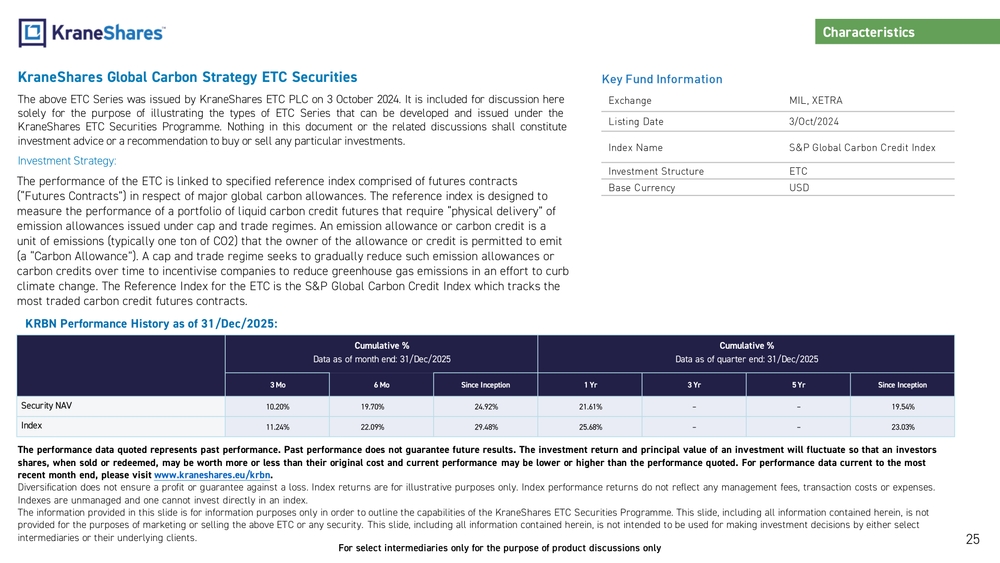
KraneShares Global Carbon Strategy ETC Securities
The above ETC Series was issued by KraneShares ETC PLC on 3 October 2024. It is included for discussion here solely for the purpose of illustrating the types of ETC Series that can be developed and issued under the KraneShares ETC Securities Programme. Nothing in this document or the related discussions shall constitute investment advice or a recommendation to buy or sell any particular investments.
Investment Strategy:
The performance of the ETC is linked to specified reference index comprised of futures contracts ("Futures Contracts") in respect of major global carbon allowances. The reference index is designed to measure the performance of a portfolio of liquid carbon credit futures that require "physical delivery" of emission allowances issued under cap and trade regimes. An emission allowance or carbon credit is a unit of emissions (typically one ton of CO2) that the owner of the allowance or credit is permitted to emit (a "Carbon Allowance"). A cap and trade regime seeks to gradually reduce such emission allowances or carbon credits over time to incentivise companies to reduce greenhouse gas emissions in an effort to curb climate change. The Reference Index for the ETC is the S&P Global Carbon Credit Index which tracks the most traded carbon credit futures contracts.
Key Fund Information
| Exchange | MIL, XETRA |
|---|---|
| Listing Date | 3/Oct/2024 |
| Index Name | S&P Global Carbon Credit Index |
| Investment Structure | ETC |
| Base Currency | USD |
KRBN Performance History as of 31/Dec/2025:
Cumulative % Data as of month end: 31/Dec/2025
| 3 Mo | 6 Mo | Since Inception | |
|---|---|---|---|
| Security NAV | 10.20% | 19.70% | 24.92% |
| Index | 11.24% | 22.09% | 29.48% |
Cumulative % Data as of quarter end: 31/Dec/2025
| 1 Yr | 3 Yr | 5 Yr | Since Inception | |
|---|---|---|---|---|
| Security NAV | 21.61% | – | – | 19.54% |
| Index | 25.68% | – | – | 23.03% |
The performance data quoted represents past performance. Past performance does not guarantee future results. The investment return and principal value of an investment will fluctuate so that an investors shares, when sold or redeemed, may be worth more or less than their original cost and current performance may be lower or higher than the performance quoted.
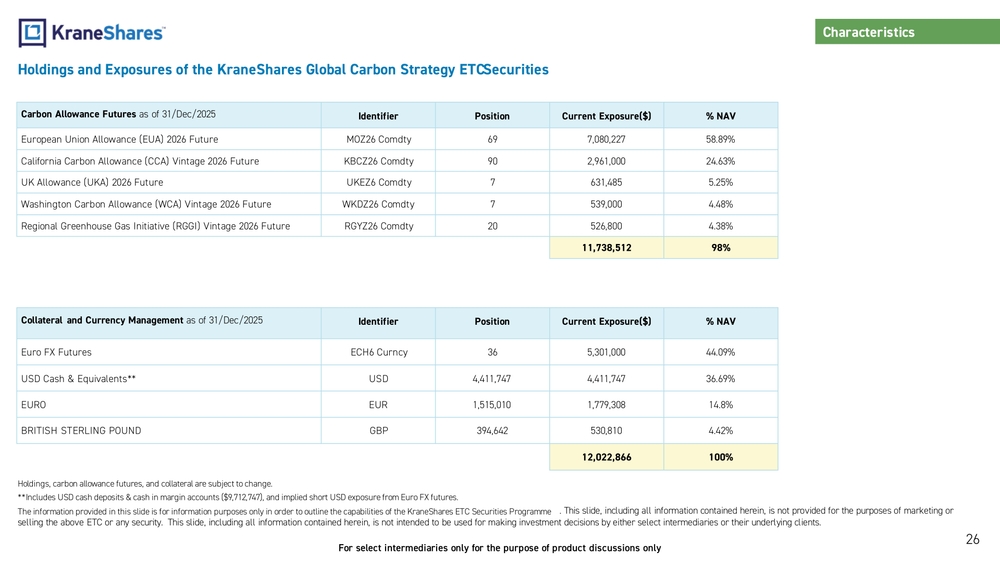
Holdings and Exposures of the KraneShares Global Carbon Strategy ETC Securities
Carbon Allowance Futures as of 31/Dec/2025
| Carbon Allowance Futures | Identifier | Position | Current Exposure($) | % NAV |
|---|---|---|---|---|
| European Union Allowance (EUA) 2026 Future | MOZ26 Comdty | 69 | 7,080,227 | 58.89% |
| California Carbon Allowance (CCA) Vintage 2026 Future | KBCZ26 Comdty | 90 | 2,961,000 | 24.63% |
| UK Allowance (UKA) 2026 Future | UKEZ6 Comdty | 7 | 631,485 | 5.25% |
| Washington Carbon Allowance (WCA) Vintage 2026 Future | WKDZ26 Comdty | 7 | 539,000 | 4.48% |
| Regional Greenhouse Gas Initiative (RGGI) Vintage 2026 Future | RGYZ26 Comdty | 20 | 526,800 | 4.38% |
| 11,738,512 | 98% |
Collateral and Currency Management as of 31/Dec/2025
| Collateral and Currency Management | Identifier | Position | Current Exposure($) | % NAV |
|---|---|---|---|---|
| Euro FX Futures | ECH6 Curncy | 36 | 5,301,000 | 44.09% |
| USD Cash & Equivalents** | USD | 4,411,747 | 4,411,747 | 36.69% |
| EURO | EUR | 1,515,010 | 1,779,308 | 14.8% |
| BRITISH STERLING POUND | GBP | 394,642 | 530,810 | 4.42% |
| 12,022,866 | 100% |
Holdings, carbon allowance futures, and collateral are subject to change.
*Includes USD cash deposits & cash in margin accounts ($9,712,747), and implied short USD exposure from Euro FX futures.
The information provided in this slide is for information purposes only in order to outline the capabilities of the KraneShares ETC Securities Programme. This slide, including all information contained herein, is not provided for the purposes of marketing or selling the above ETC or any security. This slide, including all information contained herein, is not intended to be used for making investment decisions by either select intermediaries or their underlying clients.
Part II: Deep Dive into the Carbon Allowance Markets
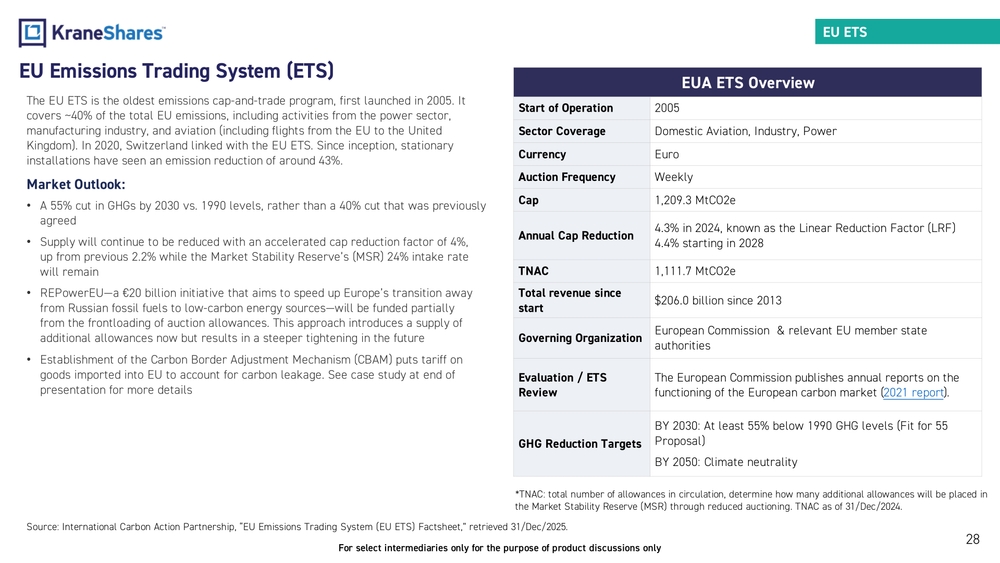
EU Emissions Trading System (ETS)
The EU ETS is the oldest emissions cap-and-trade program, first launched in 2005. It covers ~40% of the total EU emissions, including activities from the power sector, manufacturing industry, and aviation (including flights from the EU to the United Kingdom). In 2020, Switzerland linked with the EU ETS. Since inception, stationary installations have seen an emission reduction of around 43%.
Market Outlook:
- A 55% cut in GHGs by 2030 vs. 1990 levels, rather than a 40% cut that was previously agreed
- Supply will continue to be reduced with an accelerated cap reduction factor of 4%, up from previous 2.2% while the Market Stability Reserve's (MSR) 24% intake rate will remain
- REPowerEU—a €20 billion initiative that aims to speed up Europe's transition away from Russian fossil fuels to low-carbon energy sources—will be funded partially from the frontloading of auction allowances. This approach introduces a supply of additional allowances now but results in a steeper tightening in the future
- Establishment of the Carbon Border Adjustment Mechanism (CBAM) puts tariff on goods imported into EU to account for carbon leakage. See case study at end of presentation for more details
EUA ETS Overview
| Start of Operation | 2005 |
| Sector Coverage | Domestic Aviation, Industry, Power |
| Currency | Euro |
| Auction Frequency | Weekly |
| Cap | 1,209.3 MtCO2e |
| Annual Cap Reduction | 4.3% in 2024, known as the Linear Reduction Factor (LRF)4.4% starting in 2028 |
| TNAC | 1,111.7 MtCO2e |
| Total revenue since start | $206.0 billion since 2013 |
| Governing Organization | European Commission & relevant EU member state authorities |
| Evaluation / ETS Review | The European Commission publishes annual reports on the functioning of the European carbon market (2021 report). |
| GHG Reduction Targets | BY 2030: At least 55% below 1990 GHG levels (Fit for 55 Proposal)BY 2050: Climate neutrality |
TNAC: total number of allowances in circulation, determine how many additional allowances will be placed in the Market Stability Reserve (MSR) through reduced auctioning. TNAC as of 31/Dec/2024.
Source: International Carbon Action Partnership, "EU Emissions Trading System (EU ETS) Factsheet," retrieved 31/Dec/2025.
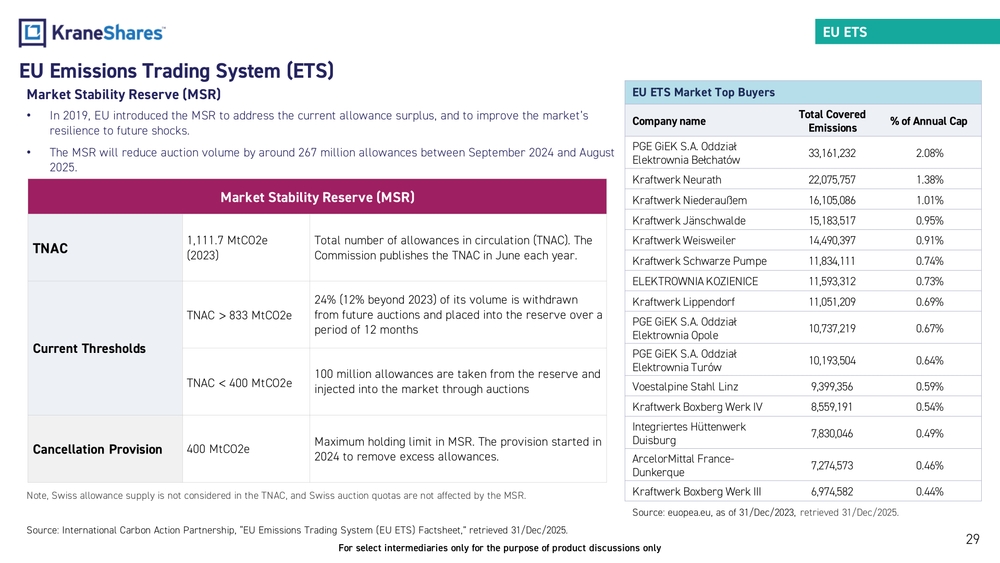
EU Emissions Trading System (ETS)
Market Stability Reserve (MSR)
- In 2019, EU introduced the MSR to address the current allowance surplus, and to improve the market's resilience to future shocks.
- The MSR will reduce auction volume by around 267 million allowances between September 2024 and August 2025.
| TNAC | 1,111.7 MtCO2e (2023) | Total number of allowances in circulation (TNAC). The Commission publishes the TNAC in June each year. |
| Current Thresholds | TNAC > 833 MtCO2e | 24% (12% beyond 2023) of its volume is withdrawn from future auctions and placed into the reserve over a period of 12 months |
| TNAC < 400 MtCO2e | 100 million allowances are taken from the reserve and injected into the market through auctions | |
| Cancellation Provision | 400 MtCO2e | Maximum holding limit in MSR. The provision started in 2024 to remove excess allowances. |
Note, Swiss allowance supply is not considered in the TNAC, and Swiss auction quotas are not affected by the MSR.
EU ETS Market Top Buyers
| Company name | Total Covered Emissions | % of Annual Cap |
|---|---|---|
| PGE GiEK S.A. Oddział Elektrownia Bełchatów | 33,161,232 | 2.08% |
| Kraftwerk Neurath | 22,075,757 | 1.38% |
| Kraftwerk Niederaußem | 16,105,086 | 1.01% |
| Kraftwerk Jänschwalde | 15,183,517 | 0.95% |
| Kraftwerk Weisweiler | 14,490,397 | 0.91% |
| Kraftwerk Schwarze Pumpe | 11,834,111 | 0.74% |
| ELEKTROWNIA KOZIENICE | 11,593,312 | 0.73% |
| Kraftwerk Lippendorf | 11,051,209 | 0.69% |
| PGE GiEK S.A. Oddział Elektrownia Opole | 10,737,219 | 0.67% |
| PGE GiEK S.A. Oddział Elektrownia Turów | 10,193,504 | 0.64% |
| Voestalpine Stahl Linz | 9,399,356 | 0.59% |
| Kraftwerk Boxberg Werk IV | 8,559,191 | 0.54% |
| Integriertes Hüttenwerk Duisburg | 7,830,046 | 0.49% |
| ArcelorMittal France-Dunkerque | 7,274,573 | 0.46% |
| Kraftwerk Boxberg Werk III | 6,974,582 | 0.44% |
Source: euopea.eu, as of 31/Dec/2023, retrieved 31/Dec/2025.
California Carbon Allowance Market (CCA)
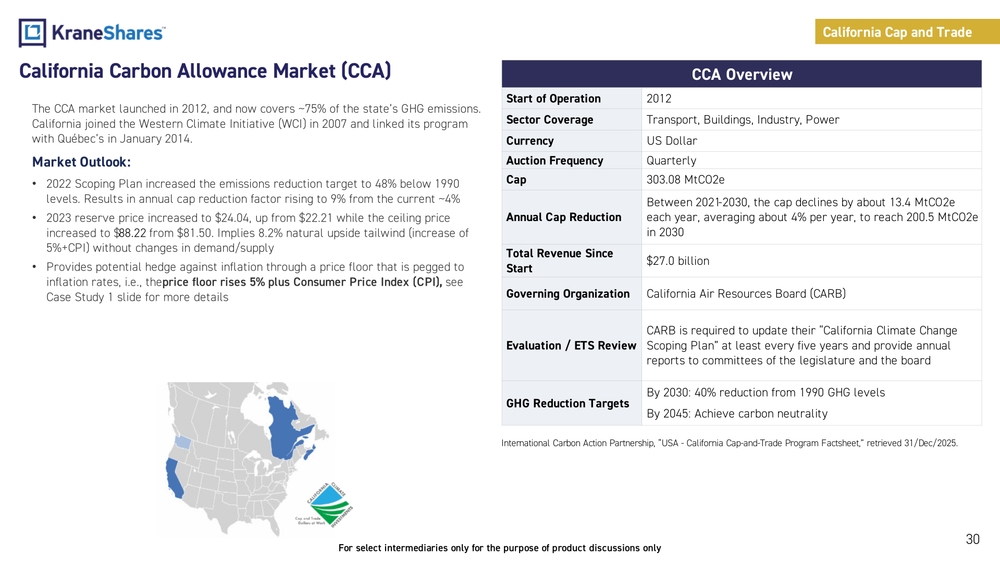
The CCA market launched in 2012, and now covers ~75% of the state's GHG emissions. California joined the Western Climate Initiative (WCI) in 2007 and linked its program with Québec's in January 2014.
Market Outlook:
- 2022 Scoping Plan increased the emissions reduction target to 48% below 1990 levels. Results in annual cap reduction factor rising to 9% from the current ~4%
- 2023 reserve price increased to $24.04, up from $22.21 while the ceiling price increased to $88.22 from $81.50. Implies 8.2% natural upside tailwind (increase of 5%+CPI) without changes in demand/supply
- Provides potential hedge against inflation through a price floor that is pegged to inflation rates, i.e., the price floor rises 5% plus Consumer Price Index (CPI), see Case Study 1 slide for more details
CCA Overview
| Start of Operation | 2012 |
| Sector Coverage | Transport, Buildings, Industry, Power |
| Currency | US Dollar |
| Auction Frequency | Quarterly |
| Cap | 303.08 MtCO2e |
| Annual Cap Reduction | Between 2021-2030, the cap declines by about 13.4 MtCO2e each year, averaging about 4% per year, to reach 200.5 MtCO2e in 2030 |
| Total Revenue Since Start | $27.0 billion |
| Governing Organization | California Air Resources Board (CARB) |
| Evaluation / ETS Review | CARB is required to update their "California Climate Change Scoping Plan" at least every five years and provide annual reports to committees of the legislature and the board |
| GHG Reduction Targets | By 2030: 40% reduction from 1990 GHG levelsBy 2045: Achieve carbon neutrality |
International Carbon Action Partnership, "USA - California Cap-and-Trade Program Factsheet," retrieved 31/Dec/2025.