2024_china_outlook
by Kraneshares
info@kraneshares.com +1 (212) 933 03932024 CHINA OUTLOOK
2 kraneshares.cominfo@kraneshares.com +1 (212) 933 0393 Back to Top ↑Table of Contents Executive Summary 3 Introduction 4 A Gradual Recovery 12 Preparing for the Next Decade 15 Conclusion 19 Citations 19 Definitions 19 Disclosures 23
3 kraneshares.com info@kraneshares.com +1 (212) 933 0393 Back to Top ↑Executive Summary •China’s underperformance versus the US over the past decade is not unique and has largely been driven by external factors such as an ever-rising US dollar exchange rate, index idiosyncrasies, and the shift from active to passive management styles in Emerging Markets (EM). •In 2023, China’s consumer recovery was focused on services and not as broad as markets had anticipated. •In 2024, we believe the recovery may broaden and accelerate while stimulus measures implemented in 2023 may begin to have a positive impact on the economy and stock market. •With interest rates at decade highs and the potential for a rate cut cycle, the coming decade might see the MSCI Emerging Markets Index outperform the S&P 500 Index on an annualized basis like it did from 2001 to 2012. •China, and especially China Internet, represented by the KraneShares CSI China Internet ETF (Ticker: KWEB) , may lead EM performance in 2024 and subsequent years due to its low relative valuation, low investor positioning, and sensitivity to improvements in China’s economic data.
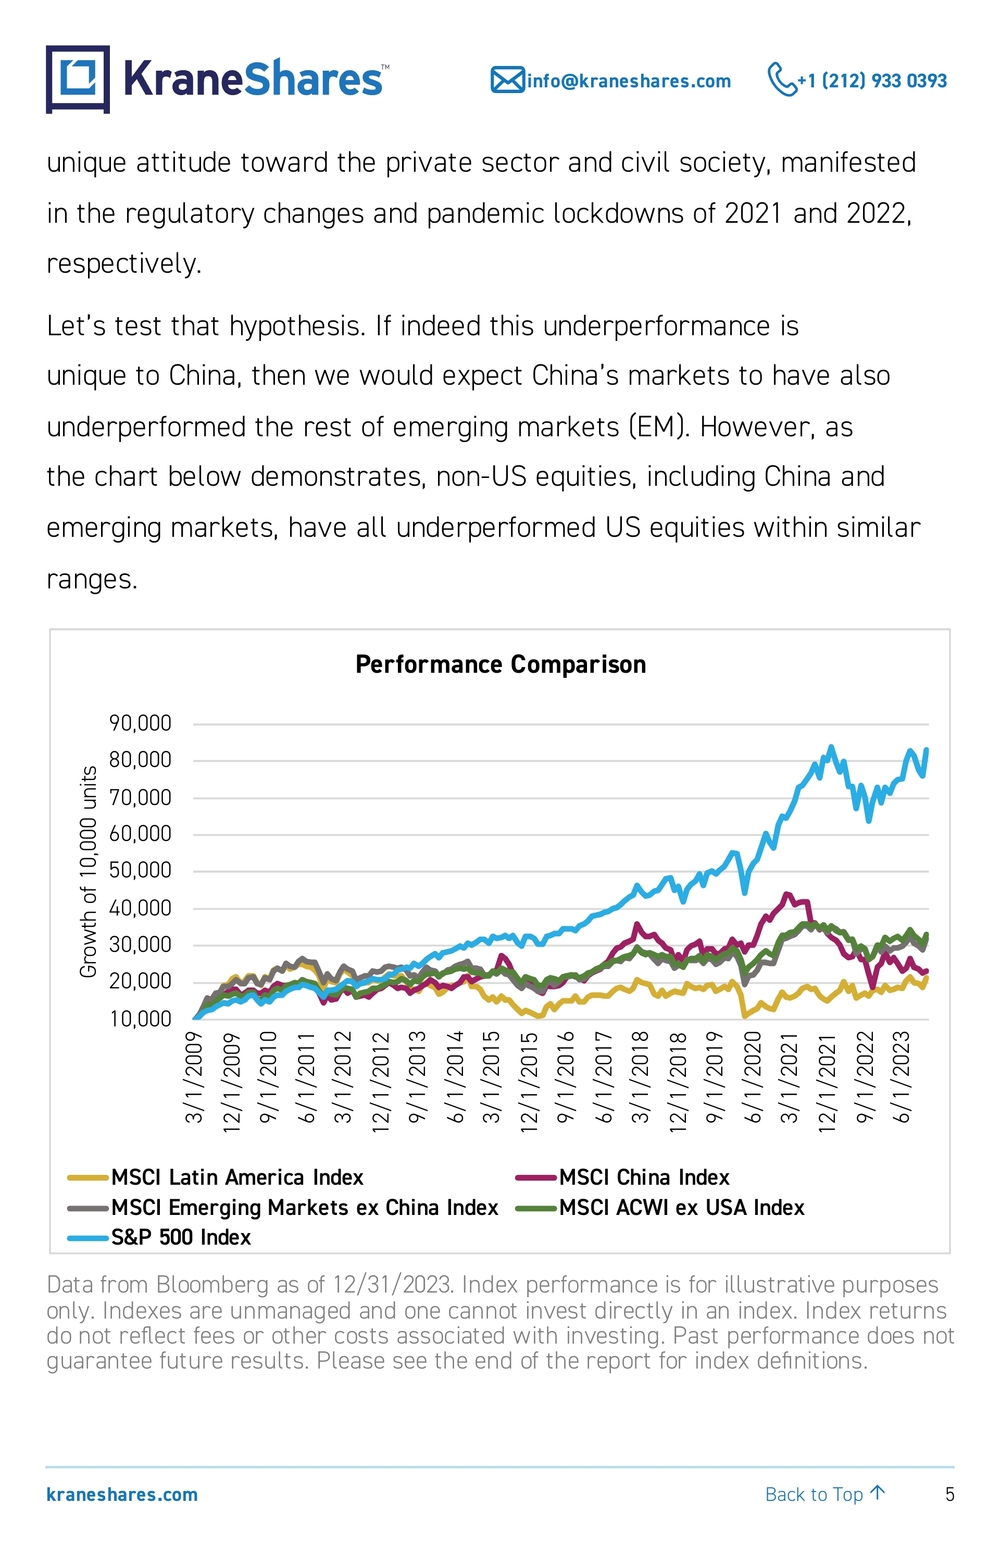
4 kraneshares.com info@kraneshares.com +1 (212) 933 0393 Back to Top ↑Introduction Daniel Kahneman and Amos Tversky founded the field of behavioral economics by masterfully articulating our brains’ varying decision- making processes. “System One” is the brain function that kept our ancestors alive by allowing them to make rapid decisions to maximize their chances of survival. Is that noise behind that bush a lion or a zebra? System One helped these early humans decide to run rather than find out the hard way. “System Two,” in Kahneman and Tversky’s lexicon, came into the spotlight in the West during the Enlightenment as the first scientists tested hypotheses using data and evidence rather than “gut” feelings. Unlike System One’s instantaneous decision-making process, System Two uses the scientific method and is purely evidence-based. Is your China investment thesis, or lack thereof, based on “System One” or “System Two”? System One would tell us there is no need to invest in China because of its vast underperformance versus US equities since the Global Financial Crisis (GFC). To make matters worse, the constant barrage of negative media attention to this issue might even appear to validate that “System One” decision. Aren’t financial professionals supposed to be data-driven? So, how would we apply a “System Two” process to investing in China? Since the GFC low of March 2009, the S&P 500 has returned an eye- popping 697% compared to MSCI China’s total return of only 96%¹. Some investors might attribute this underperformance to China’s government’s
5 kraneshares.com info@kraneshares.com +1 (212) 933 0393 Back to Top ↑unique attitude toward the private sector and civil society, manifested in the regulatory changes and pandemic lockdowns of 2021 and 2022, respectively. Let’s test that hypothesis. If indeed this underperformance is unique to China, then we would expect China’s markets to have also underperformed the rest of emerging markets (EM). However, as the chart below demonstrates, non-US equities, including China and emerging markets, have all underperformed US equities within similar ranges. 10,00020,00030,00040,00050,00060,00070,00080,00090,000 3/1/2009 12/1 /2009 9/1/2010 6/1/2011 3/1/2012 12/1 /2012 9/1/2013 6/1/2014 3/1/2015 12/1 /2015 9/1/2016 6/1/2017 3/1/2018 12/1 /2018 9/1/2019 6/1/2020 3/1/2021 12/1 /2021 9/1/2022 6/1/2023Growth of 10,000 unitsPerformance Comparison MSCILatinAmericaIndex MSCIChinaIndex MSCIEmergingMarketsexChinaIndex MSCIACWIexUSAIndex S&P 500Index Data from Bloomberg as of 12/31/2023. Index performance is for illustrative purposes only. Indexes are unmanaged and one cannot invest directly in an index. Index returns do not reflect fees or other costs associated with investing. Past performance does not guarantee future results. Please see the end of the report for index definitions.
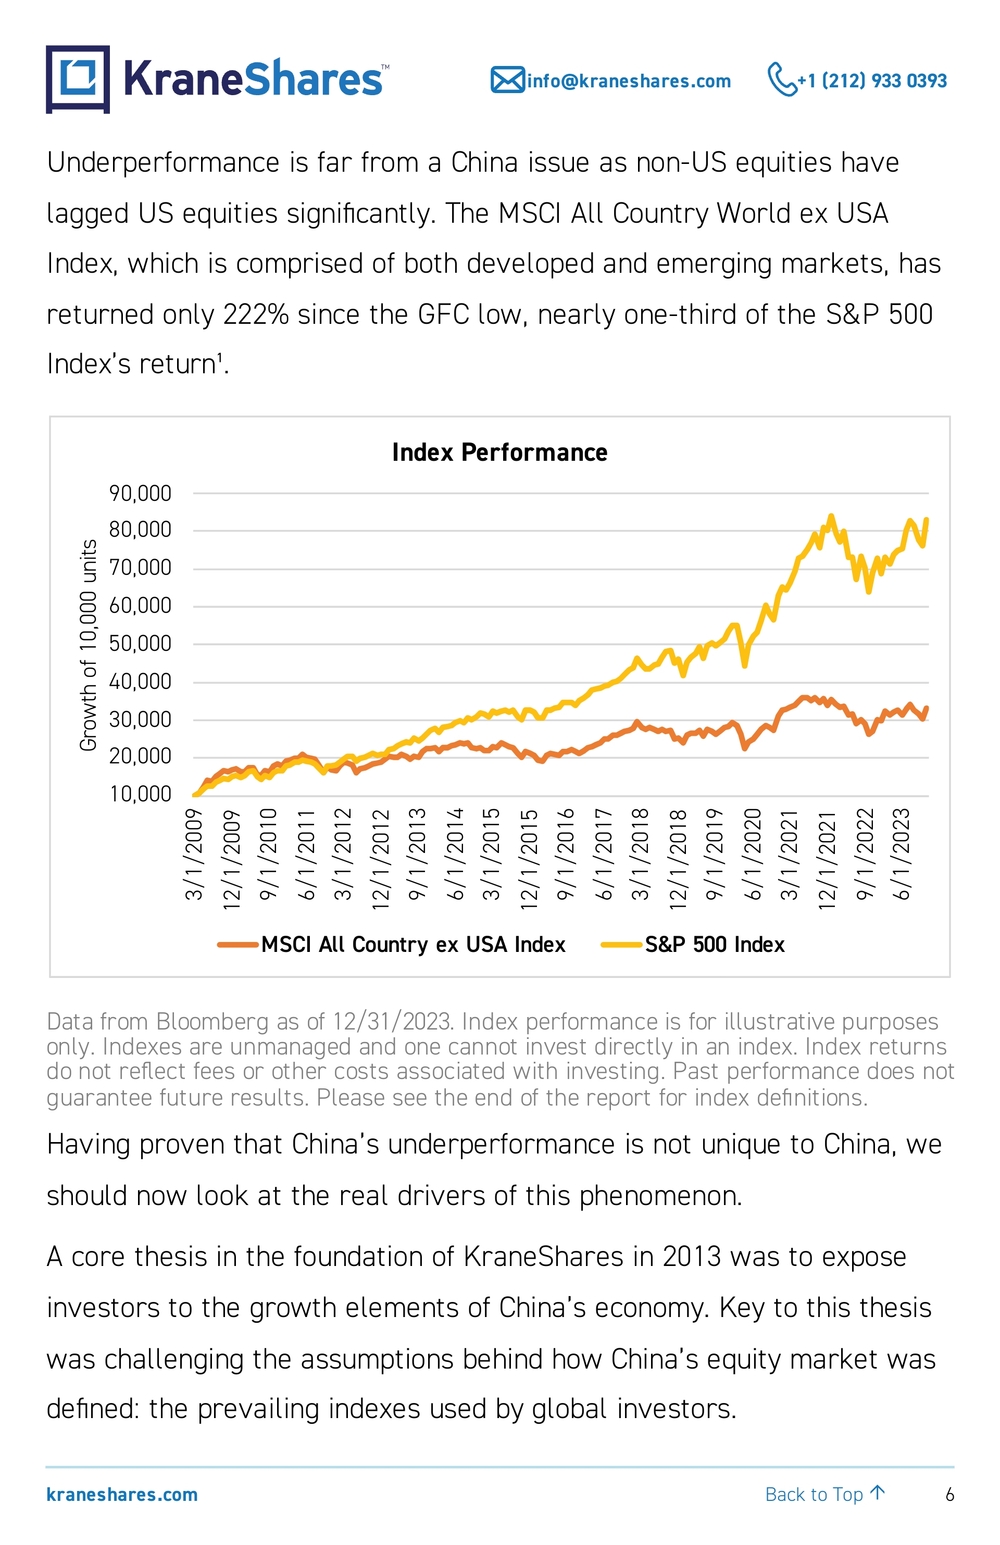
6 kraneshares.com info@kraneshares.com +1 (212) 933 0393 Back to Top ↑Underperformance is far from a China issue as non-US equities have lagged US equities significantly. The MSCI All Country World ex USA Index, which is comprised of both developed and emerging markets, has returned only 222% since the GFC low, nearly one-third of the S&P 500 Index’s return¹. 10,00020,00030,00040,00050,00060,00070,00080,00090,000 3/1/2009 12/1 /2009 9/1/2010 6/1/2011 3/1/2012 12/1 /2012 9/1/2013 6/1/2014 3/1/2015 12/1 /2015 9/1/2016 6/1/2017 3/1/2018 12/1 /2018 9/1/2019 6/1/2020 3/1/2021 12/1 /2021 9/1/2022 6/1/2023Growth of 10,000 unitsIndex Performance MSCIAllCountryexUSAIndex S&P500Index Data from Bloomberg as of 12/31/2023. Index performance is for illustrative purposes only. Indexes are unmanaged and one cannot invest directly in an index. Index returns do not reflect fees or other costs associated with investing. Past performance does not guarantee future results. Please see the end of the report for index definitions. Having proven that China’s underperformance is not unique to China, we should now look at the real drivers of this phenomenon. A core thesis in the foundation of KraneShares in 2013 was to expose investors to the growth elements of China’s economy. Key to this thesis was challenging the assumptions behind how China’s equity market was defined: the prevailing indexes used by global investors.
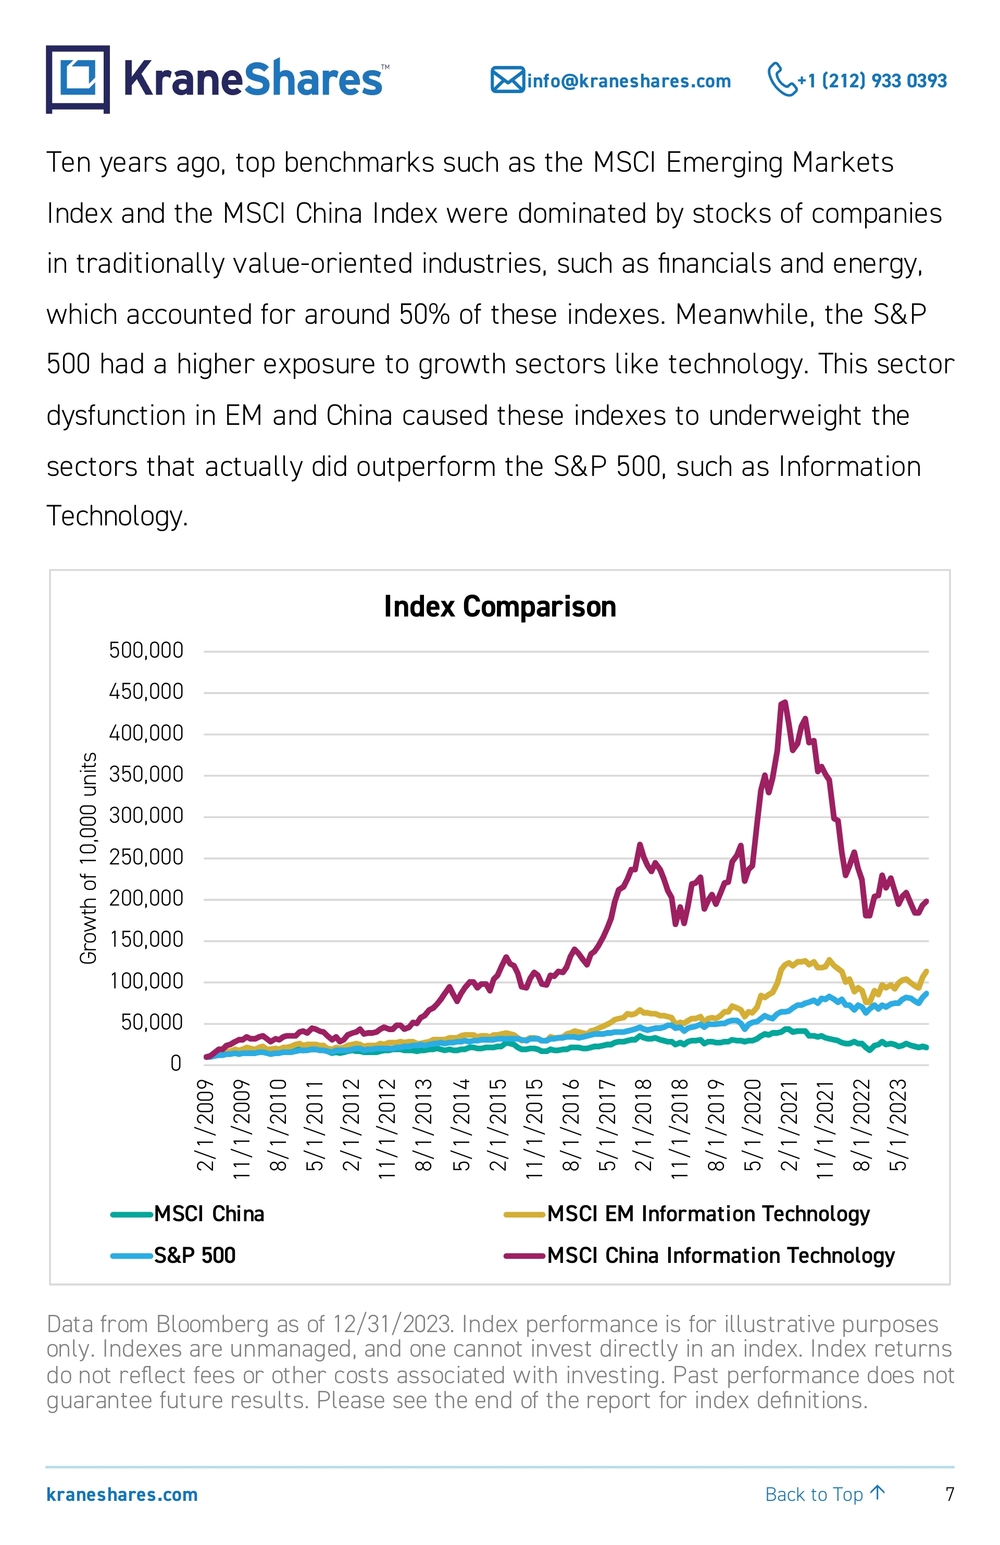
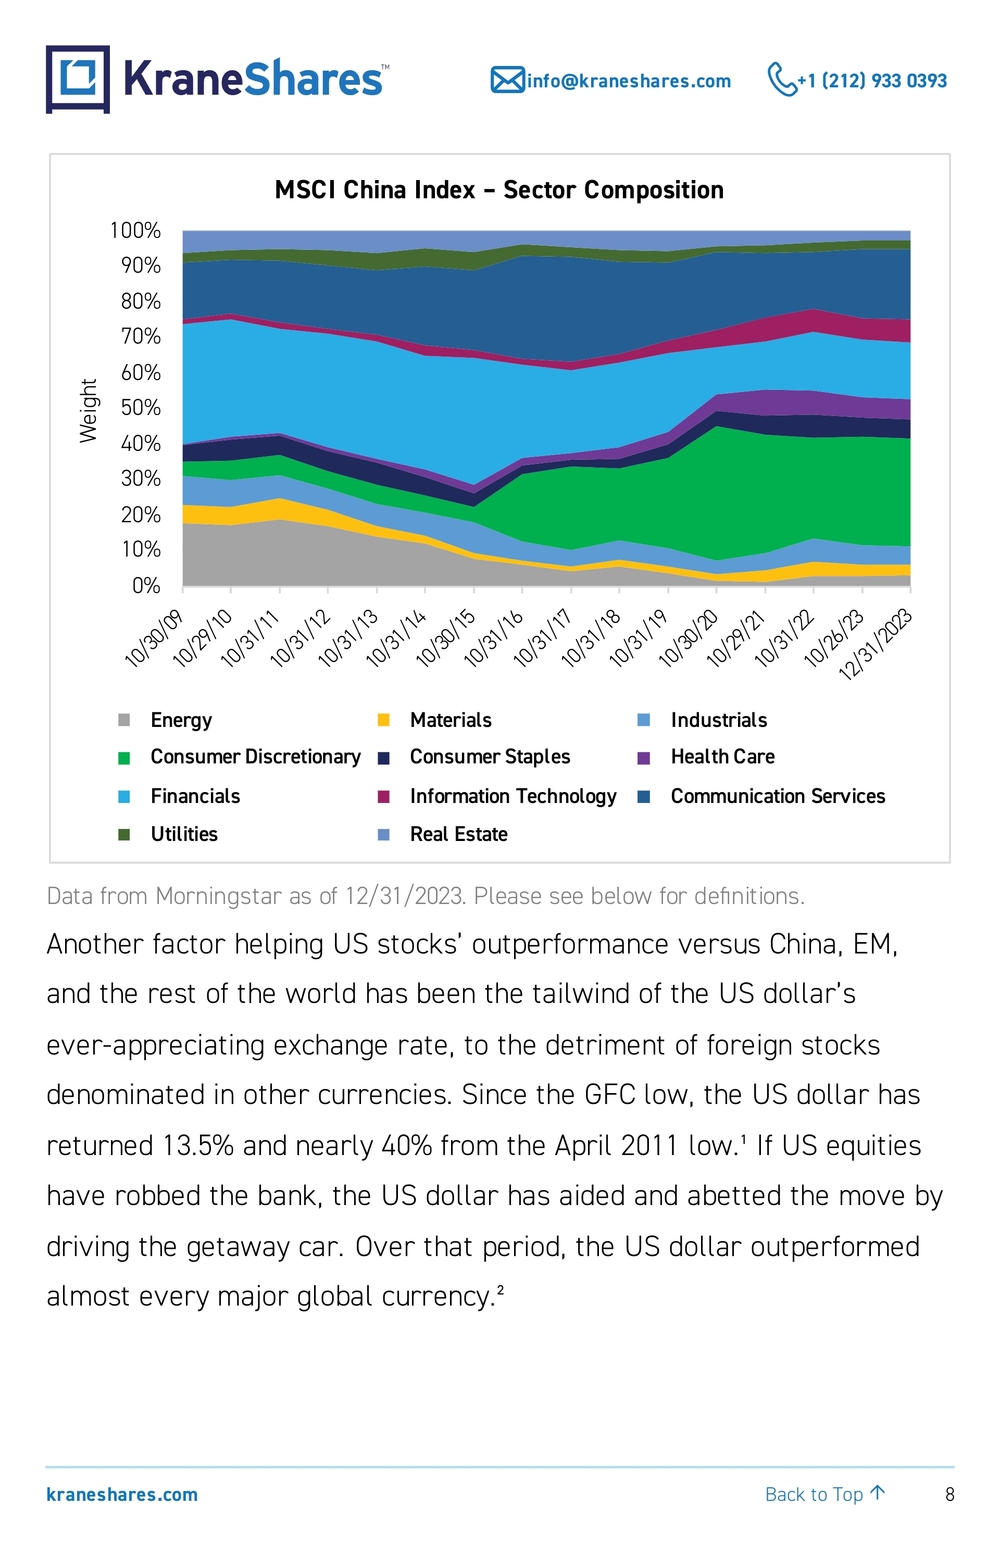
7 kraneshares.com info@kraneshares.com +1 (212) 933 0393 Back to Top ↑Ten years ago, top benchmarks such as the MSCI Emerging Markets Index and the MSCI China Index were dominated by stocks of companies in traditionally value-oriented industries, such as financials and energy, which accounted for around 50% of these indexes. Meanwhile, the S&P 500 had a higher exposure to growth sectors like technology. This sector dysfunction in EM and China caused these indexes to underweight the sectors that actually did outperform the S&P 500, such as Information Technology. 050,000100,000150,000200,000250,000300,000350,000400,000450,000500,000 2/1/2009 11/1 /2009 8/1/2010 5/1/2011 2/1/2012 11/1 /2012 8/1/2013 5/1/2014 2/1/2015 11/1 /2015 8/1/2016 5/1/2017 2/1/2018 11/1 /2018 8/1/2019 5/1/2020 2/1/2021 11/1 /2021 8/1/2022 5/1/2023Growth of 10,000 unitsIndex Comparison MSCIChina MSCIEMInformationTechnology S&P 500 MSCIChinaInformationTechnology Data from Bloomberg as of 12/31/2023. Index performance is for illustrative purposes only. Indexes are unmanaged, and one cannot invest directly in an index. Index returns do not reflect fees or other costs associated with investing. Past performance does not guarantee future results. Please see the end of the report for index definitions.
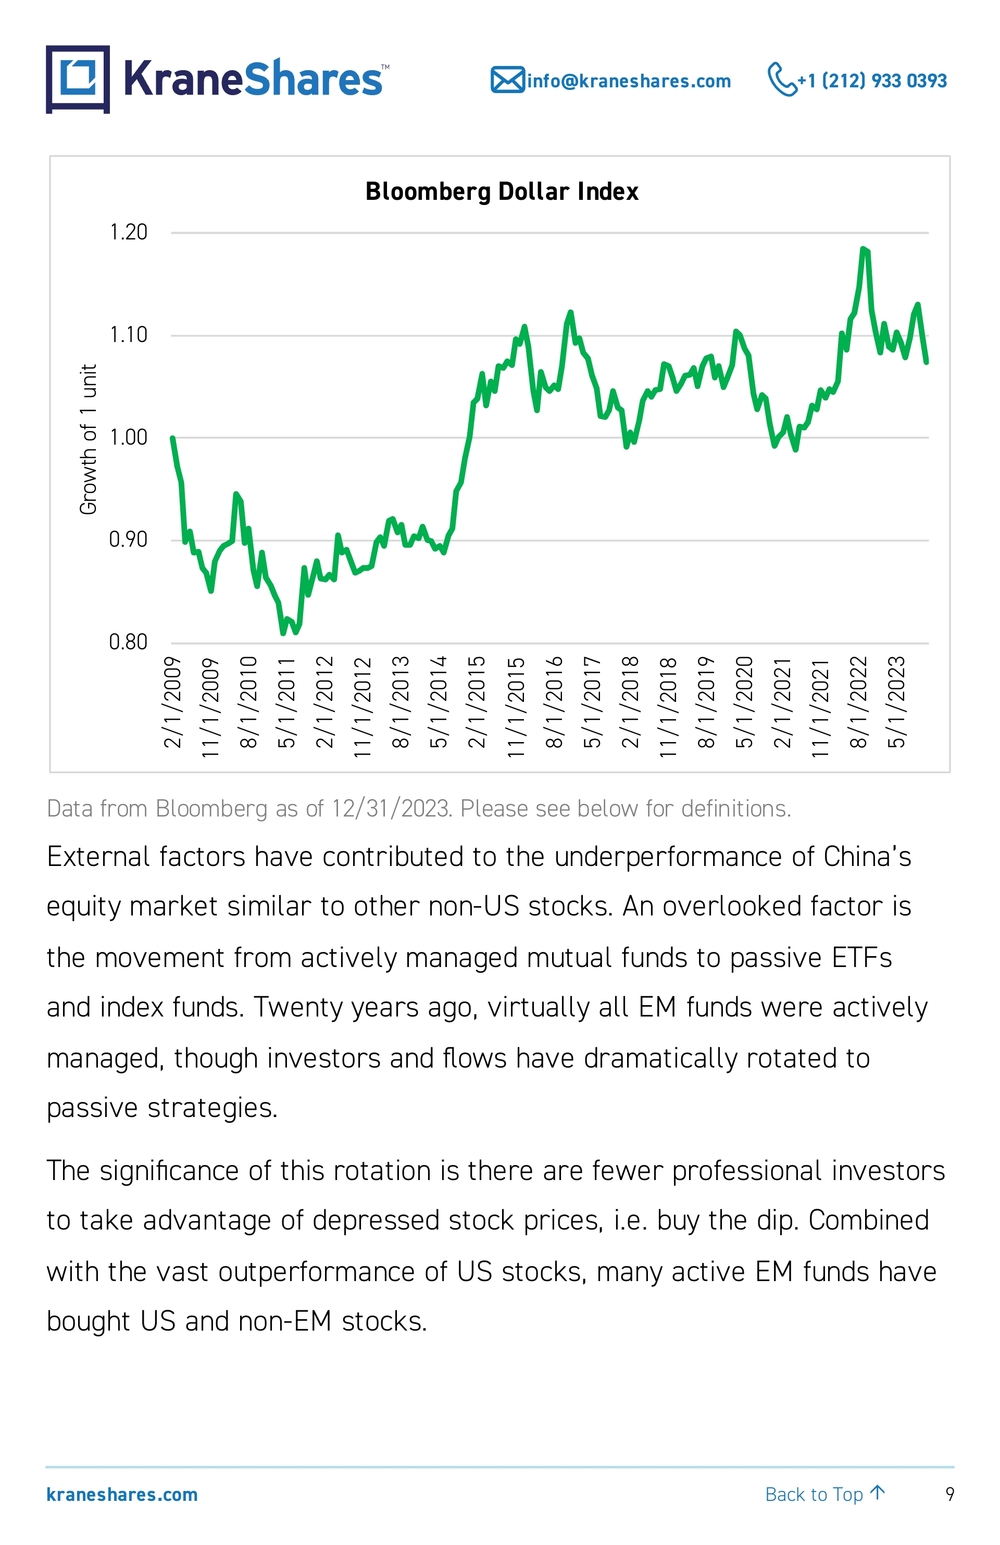
8 kraneshares.com info@kraneshares.com +1 (212) 933 0393 Back to Top ↑0%10%20%30%40%50%60%70%80%90%100% 10/30/09 10/29/10 10/31/11 10/31/12 10/31/13 10/31/14 10/30/15 10/31/16 10/31/17 10/31/18 10/31/19 10/30/20 10/29/21 10/31/22 10/26/23 12/31/2023WeightMSCI China Index – Sector Composition Energy Materials Industrials ConsumerDiscretionary ConsumerStaples HealthCare Financials InformationTechnology Commun icationServices Utilities RealEstate Data from Morningstar as of 12/31/2023. Please see below for definitions. Another factor helping US stocks’ outperformance versus China, EM, and the rest of the world has been the tailwind of the US dollar’s ever-appreciating exchange rate, to the detriment of foreign stocks denominated in other currencies. Since the GFC low, the US dollar has returned 13.5% and nearly 40% from the April 2011 low.¹ If US equities have robbed the bank, the US dollar has aided and abetted the move by driving the getaway car. Over that period, the US dollar outperformed almost every major global currency.²
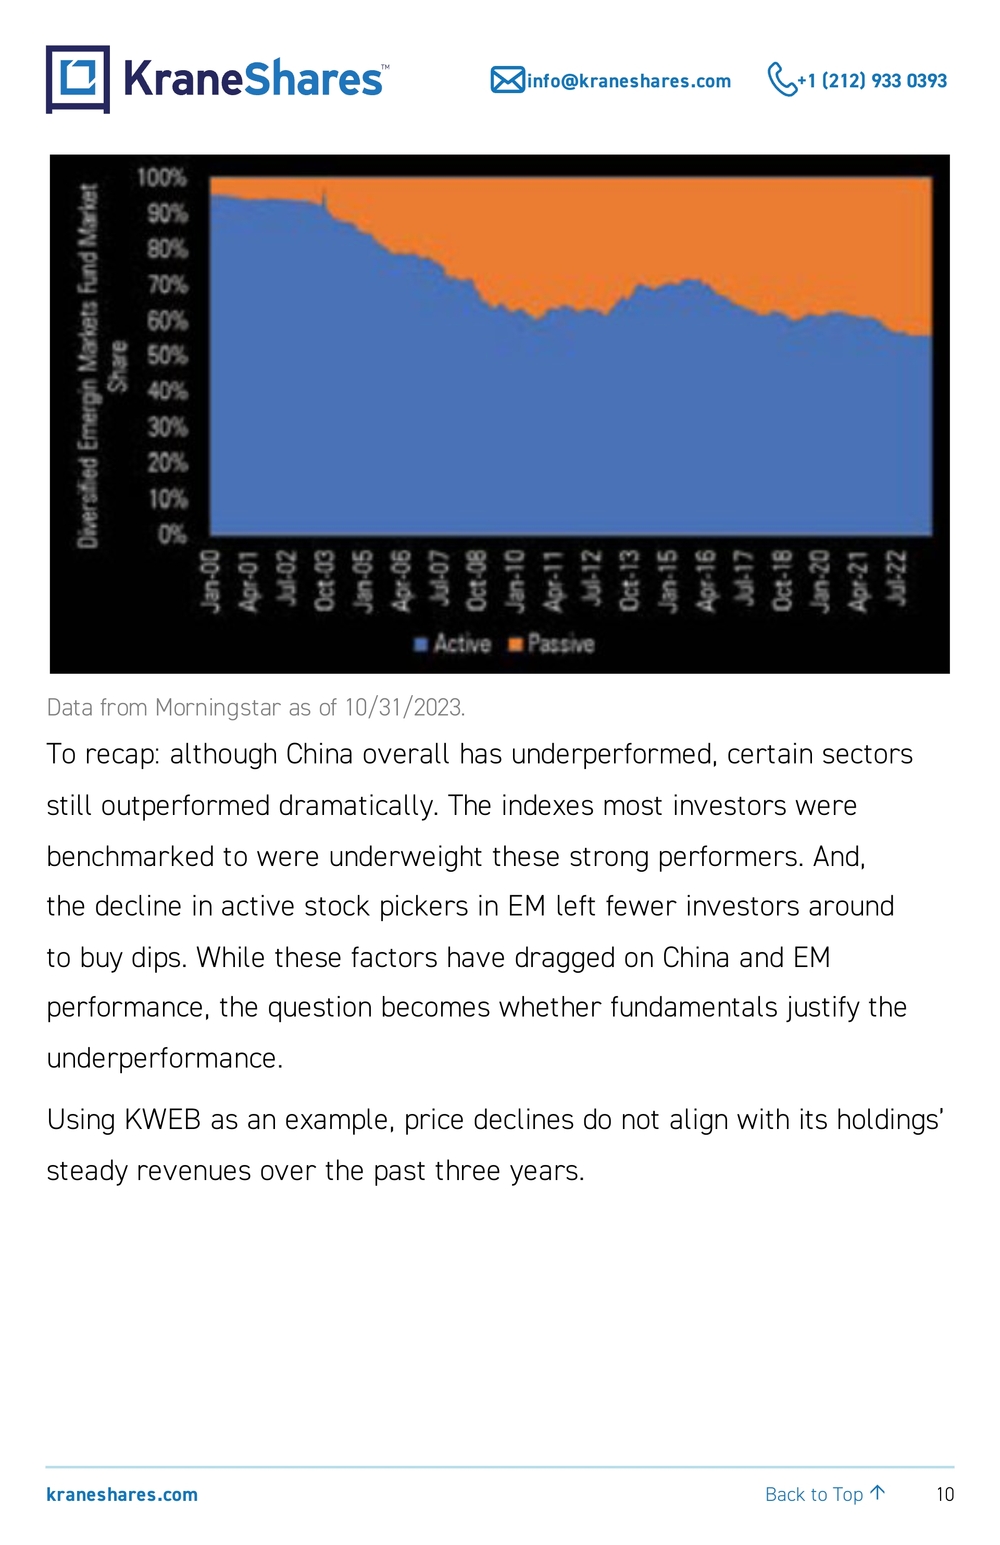
9 kraneshares.com info@kraneshares.com +1 (212) 933 0393 Back to Top ↑0.800.901.001.101.20 2/1/2009 11/1 /2009 8/1/2010 5/1/2011 2/1/2012 11/1 /2012 8/1/2013 5/1/2014 2/1/2015 11/1 /2015 8/1/2016 5/1/2017 2/1/2018 11/1 /2018 8/1/2019 5/1/2020 2/1/2021 11/1 /2021 8/1/2022 5/1/2023Growth of 1 unitBloomberg Dollar Index Data from Bloomberg as of 12/31/2023. Please see below for definitions. External factors have contributed to the underperformance of China’s equity market similar to other non-US stocks. An overlooked factor is the movement from actively managed mutual funds to passive ETFs and index funds. Twenty years ago, virtually all EM funds were actively managed, though investors and flows have dramatically rotated to passive strategies. The significance of this rotation is there are fewer professional investors to take advantage of depressed stock prices, i.e. buy the dip. Combined with the vast outperformance of US stocks, many active EM funds have bought US and non-EM stocks.
10 kraneshares.com info@kraneshares.com +1 (212) 933 0393 Back to Top ↑ Data from Morningstar as of 10/31/2023. To recap: although China overall has underperformed, certain sectors still outperformed dramatically. The indexes most investors were benchmarked to were underweight these strong performers. And, the decline in active stock pickers in EM left fewer investors around to buy dips. While these factors have dragged on China and EM performance, the question becomes whether fundamentals justify the underperformance. Using KWEB as an example, price declines do not align with its holdings’ steady revenues over the past three years.
11 kraneshares.com info@kraneshares.com +1 (212) 933 0393 Back to Top ↑0102030405060708090 -101030507090110130150 12/31/2019 3/31/2 020 6/30/2 020 9/30/2 020 12/31/2020 3/31/2 021 6/30/2 021 9/30/2 021 12/31/2021 3/31/2 022 6/30/2 022 9/30/2 022 12/30/2022 3/31/2 023 6/30/2 023 9/30/2 023 $$ BillionsKWEB Price vs. Top 10 Revenue & Net Income (Quarterly) KWEBTop10Revenue KWEBTop10NetIncome KWEBPrice(RightAxis) Data from Bloomberg as of 9/30/2023. Past performance does not guarantee future results KWEB price used is NYSE closing price on the last trading day of each quarter, not NAV. Top 10 Holdings are updated on a semi-annual basis. For KWEB standard performance and top 10 holdings, please click here . Interestingly, US multinationals with a high exposure to China give a similar revenue growth picture, but a different picture when it comes to stock performance. If China’s economy is facing challenges that have the potential to negatively impact corporate earnings over the long term, then the earnings and stock prices of these companies should be adversely affected, too. US multinationals with high revenue exposure to China have done well, returning +25.57%, on average, over the past year despite the MSCI

12 kraneshares.com info@kraneshares.com +1 (212) 933 0393 Back to Top ↑China All Shares Index being down -15.02%. If China’s negative stock performance was indeed fundamentally driven, wouldn’t that be reflected in the revenues of these US companies, too? % Revenu efrom Chin a % Revenu eGrowt h % Change 1-Year Company Name 61.26 -18.96 23.88 Qualcomm Inc. 52.33 48.55 72.71 Monolithic Powe rSystems 42.00 32.66 52.95 Marvel lTechnology 35.59 19.36 39.84 NXPSemiconductor s 34.34 7.88 106.61 Broadcom Inc. 33.00 119.96 -39.42 Albemarl e 30.16 11.98 -6.91 Aptiv PLC 29.96 0.76 -6.08 Corning Inc. 28.13 2.84 52.70 Applie dMaterials Inc. 27.95 -10.30 -40.57 Estee Lauder Companies 37.47 21.47 25.57 Averag e
-
- -15.02 MSCI Chin aAllSharesTop10 US Companie sBy China Revenu e China revenue from Morningstar as of 10/31/2023. Other data from Bloomberg. % Change 1-Year is as of 12/18/2023. Revenue Growth is year-over-year as of the latest earnings release. Applying a System Two approach to analyzing China’s performance reveals that external factors such as a US bias, the negative impact of a continually strengthening US dollar, and index dysfunctions have been driving performance in China’s equity market, not fundamentals. As more investors begin to doubt the trajectory of the US, we believe it might be time to take a second look at the world’s second largest economy. A Gradual Recovery China’s economy is gradually recovering from the zero COVID policy of 2022, which weighed heavily on the consumer. Consumer spending came back in 2023, though was heavily focused on services, as spending on

13 kraneshares.com info@kraneshares.com +1 (212) 933 0393 Back to Top ↑larger items such as furniture lagged. However, markets had expected a faster, more broad-based recovery. 7.617.1 11.2 1.7 024681012141618 Total Retail Sales CateringServices OnlineRetailSales Furniture% Growth, year- over-year2023 Retail Sales Growth By Selecteed Categories Data from Bloomberg and the National Bureau of Statistics of China as of 10/31/2023. Although geopolitics and real estate continued to weigh on investor sentiment in 2023, significant progress has been made on multiple fronts, especially those that captured investor attention in 2022.

14 kraneshares.com info@kraneshares.com +1 (212) 933 0393 Back to Top ↑Comments Jan. 24’ Oct. ’2 2 Issue Complete ;interne tcompanies aligne dwith domestic consumption policy Gree n On Watc hInternet regulation Chinese la wchanged allowing PCAO Binspector stogain access to Chin aauditpapers , December 2022 PCAO Bannouncemen ton first roun dof audi treviewsGree n Red ADRdelisting Remove d Gree n Red Zero-Covid Policy Multiple cities’ home buying restrictions removed, definition of first -timebuyer changed, mortgage rate lowered; distressed developers will continue tostruggleGree n Red Real Estate Status quomaintaine don Taiwan, US Secretary of Stat eBlinken,T reasur ySecretary Yellen an dSecretary of Commerce Gina Raimondo have visited China, Biden Xi metat APEC in San Francisco in November .On watc h Red Geopolitical Risk Concern Le vel High Low The government has also begun to ease real estate policies. Both Beijing and Shanghai recently lowered the required downpayments for homebuyers, and many provinces have rescinded moratoriums on mortgages for second homes. Meanwhile, the central government has extended working capital loans to developers so that they can complete pre-purchased homes. Completing these homes could significantly improve consumer sentiment due to the wealth effect. Bloomberg Intelligence recently indicated that the largest downside risks in the property sector are likely behind us, and some developers have even resumed bond issuance at par value. China has been trying to stimulate the economy, though it continues to proceed with caution. This contrasts with the US’ massive fiscal stimulus during the pandemic, which has resulted in high inflation. Nonetheless, China has pursued monetary easing through cuts to multiple rates, including banks’ reserve requirement ratios (RRRs) and the one and five- year medium-term lending facility (MLF) rates.

15 kraneshares.com info@kraneshares.com +1 (212) 933 0393 Back to Top ↑Conditions also continued to improve on the geopolitical front in 2023. Secretary of State Blinken’s trip to China in June was followed by China trips from Treasury Secretary Yellen, climate envoy John Kerry, the late Henry Kissinger, and Commerce Secretary Gina Raimondo. These efforts then culminated in President Biden’s meeting with President Xi at the November Asia Pacific Economic Cooperation (APEC) Summit in San Francisco. The two leaders agreed to curb the production of fentanyl ingredients, step up military dialogue, and cooperate on the global regulation of AI technology. Preparing For The Next Decade The past 12 years and the decade before are mirror images regarding the performance of EM and US Large Cap. With interest rates at decade highs and the potential for a rate cut cycle, the coming decade might see the MSCI Emerging Markets Index outperform the S&P 500 Index on an annualized basis like it did from 2001 to 2012. 13.3 2.5 -2.9 -10.81.412.0 2.610.7 -15-10-5051015 MSCIEmergingMarket sS &P500 USDollarIndexS &POutperformanceOverEMAnnualized % EM vs. US Large Cap & US Dollar - Returns By Decade 1/2001to4/2012 4/2012to10/2023 Data from Bloomberg as of 10/31/2023. Index returns are for illustrative purposes only. Indexes are unmanaged and one cannot invest directly in an index. Index returns do not reflect fees or other costs associated with investing. Past performance does not guarantee future results. Data above represented by monthly returns.

16 kraneshares.com info@kraneshares.com +1 (212) 933 0393 Back to Top ↑Going into 2024, China’s economic fundamentals appear attractive relative to other major markets, such as the US, the UK, and the Eurozone, which are facing headwinds from higher interest rates, high valuations, and high debt. China has been cutting interest rates all year and still possesses significant dry powder that it can use to try to stimulate the economy. This dry powder consists of $3 trillion in foreign reserves and a low debt-to-GDP ratio at the sovereign level that is half that of the US.6 1-Year Forward P/ E5Probability of Recession In 1-Year(%)*10-Year Gov. Bond Yield (% )4 M2Growth (% )3CPI(%)22024 Est. GDP Growth (% ) 12023 Est. GDP Growth (%)12022 GDP Growth (% ) 9.3 15 2.6 12.4 -0.5 4.9 5.4 2.7 China 21.5 50 3.9 -4.6 3.1 1.5 3.1 1.9 USA 11.2 75 2.0 0.9 3.2 0.6 -0.6 1.8 German y 14.3 20 0.6 2.5 2.3 1.1 1.1 1.2 Japan 11.1 60 3.5 -4.7 4.6 0.7 0.5 0.0 UKHeadline Economic Indicators –China vs .Selecte dMajor Economies
- GDP forecasts are nominal from the US Congressional Budget Office, European Central Bank, UBS, the World Bank, and Bloomberg as of 9/30/2023. 2022 GDP from the World Bank.
- Data from Bloomberg, Trading Economics, UK Parliament (as of 10/31/2023), and the European Central Bank (ECB) as of 11/30/2023.
- Data from Trading Economics as of 12/31/2022. M2 Growth is for 12/31/2021 to 12/31/2022 period.
- Data from Bloomberg as of 6/30/2023.
- Data from FactSet as of 12/19/2023. CPIs, M2, Bond Yield, are as of as of 11/30/2023. Forward P/E as of 6/13/2023. Forward P/E = Forward Price to earnings ratio of the MSCI China All Shares Index for China. For all others, forward P/E of the representative MSCI index for each country’s equity market (harmonic, weighted average) is used. CPI = consumer price index. GDP = Gross Domestic Product. Please see the end of the report for definitions. *According to Bloomberg’s recession probability calculator, value as at 12/20/2023.

17 kraneshares.com info@kraneshares.com +1 (212) 933 0393 Back to Top ↑Meanwhile, investors on the sidelines may choose to reallocate due to China’s attractive valuation. On average, the earnings multiples within the MSCI China All Shares Index are 20% lower than the MSCI Emerging Markets Index. We believe China’s valuations, which declined in 2023, may catch up with the rest of EM in 2024. 9.09.510.010.511.011.512.012.513.0 30-DEC-2022 31-JAN-2023 28-FEB-2023 31-MAR-2023 28-APR-2023 31-MAY-2023 30-JUN-2023 31-JUL-2023 31-AUG-2023 29-SEP-2023 31-OCT-2023 30-NOV-2023 12-DEC-2023P/E Ratio MSCIEM MSCIChinaAllShares Data from FactSet as of 12/12/2023. Please see below for definitions. We believe that China’s gradual and focused recovery in 2023 will accelerate and broaden in 2024. Further policy support for the real estate sector is also expected and may raise investor sentiment, potentially leading to a rebound in Chinese equity markets. China, particularly China's internet sector, are top ideas for 2024 among Wall Street analysts, and researchers have been vocal about this in the media recently. Kinger Lau, the Chief Equity Strategist at Goldman Sachs,

18 kraneshares.com info@kraneshares.com +1 (212) 933 0393 Back to Top ↑discussed his firm’s views on China in a CNBC interview. Goldman’s house view is that China could see its first annual equity index gains in four years in 2024.³ These more favorable views towards China stocks could lead to a reversal in US managers’ underweighting of the market, and KWEB could be the primary beneficiary due to its low valuation and high beta to economic releases. Furthermore, we believe China has become an even better diversifier* to portfolios following the pandemic. China exhibits the lowest correlation to the S&P 500 Index among the thirteen major EMs shown below, making the asset class a potentially attractive choice for diversification in 2024. 00.10.20.30.40.50.6 Korea Taiwan Brazil South Africa India EMexmainlandChina Indonesia Türkiye Colombia Egypt Saudi ArabiaUAE ChinaCorrelation CoefficientMajor Emerging Markets: Ranking By Sensitivity to Changes in S&P 500 Index Data from Bloomberg as of 12/31/2023. Weekly observations starting 12/31/2021. Each country is represented by its country constituents in the MSCI Emerging Markets Index.

19 kraneshares.com info@kraneshares.com +1 (212) 933 0393 Back to Top ↑Conclusion We are entering a new era for global markets. With interest rates at the highest levels in two decades, we believe now is the time to reevaluate assumptions that defined portfolio management decisions over the past decade because the next decade is unlikely to look like the last. We believe that an overweight to US equities due to their outperformance should not be treated as a forgone conclusion. Furthermore, when considering exposure to Emerging Markets, we believe China, specifically China Internet, is most attractive due to its low valuation, accommodative monetary policy environment, low investor positioning, and sensitivity to any potential improvements in China’s economic data. *Diversification does not ensure a profit or guarantee against a loss. Citations:
- Data from Bloomberg as of 12/31/2023.
- CLSA Research as of 11/30/2023.
- Tan, Clement. “Goldman Sachs expects China stocks to make first annual gain in 4 years in 2024,” CNBC. November 21, 2023.
- Pettit, Drew. “ETF Perspectives: Trading China’s Economic Trajectory,” Citi Research. September 15, 2023.
- Kapteyn, Arend. “Global Economics & Markets Outlook 2024-2025,” UBS Research. October 13, 2023.
- Data from Bloomberg as of 9/30/2023. Definitions: MSCI Emerging Markets Index: The MSCI Emerging Markets Index is

20 kraneshares.com info@kraneshares.com +1 (212) 933 0393 Back to Top ↑a free-float weighted equity index that captures large and mid-cap representation across Emerging Market (EM) countries. The index covers approximately 85% of the free float adjusted market capitalization in each country. The index was launched on January 1, 2001. MSCI All Country World (ACWI) ex USA Index: The ACWI ex USA captures large and mid-cap representation across 22 of 23 developed markets (excluding the US) and 24 Emerging Markets (EM) countries. With 2,312 constituents, the index covers approximately 85% of the global equity opportunity set outside the US. The index was launched on January 1, 2001. S&P 500 Index: The S&P 500 Index is widely regarded as the best single gauge of large-cap U.S. equities. There is over USD 9.9 trillion indexed or benchmarked to the index, with indexed assets comprising approximately USD 3.4 trillion of this total. The index includes 500 leading companies and covers approximately 80% of available market capitalization. The index was launched on March 4, 1957. MSCI Emerging Markets Information Technology Index: The MSCI Emerging Markets Information Technology Net Total Return USD Index is a free-float weighted equity index. The parent is the MSCI Emerging Markets Index. The index was launched on January 1, 2001. MSCI China Information Technology Index: The MSCI China Information Technology Index captures large and mid-cap representation across China H shares, B shares, Red chips, and P chips. Currently, the index includes Large Cap A and Mid Cap A shares represented at 20% of their

21 kraneshares.com info@kraneshares.com +1 (212) 933 0393 Back to Top ↑free float-adjusted market capitalization. All securities in the index are classified in the Information Technology sector as per the Global Industry Classification Standard (GICS). The index was launched on September 15, 1999. MSCI China All Shares Index: The MSCI China All Shares Index captures large and mid-cap representation across China A‐shares, B‐shares, H‐ shares, Red‐chips, P‐ chips and foreign listings (e.g. ADRs). The index aims to reflect the opportunity set of China share classes listed in Hong Kong, Shanghai, Shenzhen, and outside of China. It is based on the concept of the integrated MSCI China equity universe with China A-shares included. The index was launched on June 26, 2014. MSCI China Index: The MSCI China Index captures large and mid-cap representation across China A shares, H shares, B shares, red chips, P chips, and foreign listings (e.g., ADRs). With 703 constituents, the index covers about 85% of this China equity universe. Currently, the index includes Large Cap A and Mid-Cap A-shares represented at 20% of their free float-adjusted market capitalization. The index was launched on October 31, 1995. Bloomberg Dollar Index: The Bloomberg Dollar Index is an index that tracks the exchange rate between the US dollar and the currencies that trade the most with the United States. Consumer Price Index (CPI): The consumer price index is a gauge of consumer price inflation. It measures the change in price of a basket of common consumer goods over a certain period and is usually calculated

22 kraneshares.com info@kraneshares.com +1 (212) 933 0393 Back to Top ↑by government agencies for a given country. M2 Growth: M2 is the measure of cash plus credit in an economy. Growth in M2 is usually interpreted as an expansion of credit, i.e. more borrowing, while a decrease in M2 is usually an indication of less borrowing and, consequently, stricter financial conditions. Gross Domestic Product (GDP): The total amount of goods and services produced by a country over a given period. Price to Earnings (P/E) Ratio: The share price of a company divided by a company’s earnings per share. The P/E ratio is the most used measure of valuing a company. A lower P/E ratio means a company is cheaper based on its current earnings. Correlation: A measure of the degree to which two variables move in tandem with one another. Correlation is usually measured in coefficients, which range from -1 to 1, with negative values indicating an inverse relationship, positive values indicating a positive correlation, and a value of 0 indicating no correlation whatsoever. Reserve Requirement Ratio (RRR): The amount of money that banks are required to hold on their balance sheets as opposed to being used for lending, expressed as a percentage of the bank’s total assets. Medium-term Lending Facility (MLF): A policy rate target that is set by the People’s Bank of China and is directly related to mortgage lending. Sovereign Debt to GDP: The ratio of a country’s government debt at the national level to its GDP. Foreign Reserves: Foreign currency held by goverments on their balance

23 kraneshares.com info@kraneshares.com +1 (212) 933 0393 Back to Top ↑sheets. Debt to GDP Ratio: The ratio of a country's total debt, in this case at the sovereign level, to its annual gross domestic product (GDP). This ratio is generally used to assess whether a country is overlevereged. Important Notes: Carefully consider the Funds’ investment objectives, risk factors, charges and expenses before investing. This and additional information can be found in the Funds' full and summary prospectus, which may be obtained by visiting www.kraneshares.com. Read the prospectus carefully before investing. Risk Disclosures: Investing involves risk, including possible loss of principal. There can be no assurance that a Fund will achieve its stated objectives. Indices are unmanaged and do not include the effect of fees. One cannot invest directly in an index. This information should not be relied upon as research, investment advice, or a recommendation regarding any products, strategies, or any security in particular. This material is strictly for illustrative, educational, or informational purposes and is subject to change. Certain content represents an assessment of the market environment at a specific time and is not intended to be a forecast of future events or a guarantee of future results; material is as of the dates noted and is subject to change without notice. The Fund may invest in derivatives, which are often more volatile than other investments and may magnify the Fund’s gains or losses. A derivative (i.e., futures/forward contracts, swaps, and options) is a contract that derives its value from the performance of an underlying asset. The primary risk of derivatives is that changes in the asset’s market value and the derivative may not be proportionate, and some derivatives can have the potential for unlimited losses. Derivatives are also subject to liquidity and counterparty risk. The

24 kraneshares.com info@kraneshares.com +1 (212) 933 0393 Back to Top ↑Fund is subject to liquidity risk, meaning that certain investments may become difficult to purchase or sell at a reasonable time and price. If a transaction for these securities is large, it may not be possible to initiate, which may cause the Fund to suffer losses. Counterparty risk is the risk of loss in the event that the counterparty to an agreement fails to make required payments or otherwise comply with the terms of the derivative. The ability of the Fund to achieve its respective investment objectives is dependent, in part, on the continuous availability of A Shares and the ability to obtain, if necessary, additional A Shares quota. If the Fund is unable to obtain sufficient exposure to limited availability of A Share quota, the Fund could seek exposure to the component securities of the Underlying Index by investment in other types of securities. The Fund is subject to political, social or economic instability within China which may cause decline in value. Emerging markets involve heightened risk related to the same factors as well as increase volatility and lower trading volume. Fluctuations in currency of foreign countries may have an adverse effect to domestic currency values. The Fund may invest in Initial Public Offerings (IPOs). Securities issued in IPOs have no trading history, and information about the companies may be available for very limited periods. In addition, the prices of securities sold in IPOs may be highly volatile. In addition, as the Fund increases in size, the impact of IPOs on the Fund’s performance will generally decrease. Narrowly focused investments typically exhibit higher volatility. The Fund’s assets are expected to be concentrated in a sector, industry, market, or group of concentrations to the extent that the Underlying Index has such concentrations. The securities or futures in that concentration could react similarly to market developments. Thus, the Fund is subject to loss due to adverse occurrences that affect that concentration. In addition to the normal risks associated with investing, investments in smaller companies typically exhibit higher volatility. KWEB is non-diversified.

25 kraneshares.com info@kraneshares.com +1 (212) 933 0393 Back to Top ↑ETF shares are bought and sold on an exchange at market price (not NAV) and are not individually redeemed from the Fund. However, shares may be redeemed at NAV directly by certain authorized broker-dealers (Authorized Participants) in very large creation/redemption units. The returns shown do not represent the returns you would receive if you traded shares at other times. Shares may trade at a premium or discount to their NAV in the secondary market. Brokerage commissions will reduce returns. Beginning 12/23/2020, market price returns are based on the official closing price of an ETF share or, if the official closing price isn't available, the midpoint between the national best bid and national best offer ("NBBO") as of the time the ETF calculates the current NAV per share. Prior to that date, market price returns were based on the midpoint between the Bid and Ask price. NAVs are calculated using prices as of 4:00 PM Eastern Time. The KraneShares ETFs and KFA Funds ETFs are distributed by SEI Investments Distribution Company (SIDCO), 1 Freedom Valley Drive, Oaks, PA 19456, which is not affiliated with Krane Funds Advisors, LLC, the Investment Adviser for the Funds, or any sub-advisers for the Funds.

info@kraneshares.com +1 (212) 933 0393 ABOUT KRANESHARES Krane Funds Advisors, LLC is the investment manager for KraneShares ETFs. KraneShares offers innovative investment solutions tailored to three key pillars: China, Climate, and Uncorrelated Assets. Our team is determined to provide industry- leading, differentiated, and high-conviction investment strategies that offer access to key market trends. Our mission is to empower investors with the knowledge and tools necessary to capture the importance of these themes as an essential element of a well- designed investment portfolio. ABOUT CICC In 2017, China International Capital Corporation (CICC) formed a strategic partnership with Krane Funds Advisors, LLC, becoming the largest shareholder. CICC is a leading, publicly traded, Chinese financial services company with expertise in research, asset management, investment banking, private equity, and wealth management. Founded as the first Sino-US joint venture investment bank in 1995 with Morgan Stanley and China Construction Bank as the largest initial shareholders. Today CICC is majority owned by China Investment Corporation (CIC), the second largest sovereign wealth fund with roughly $1 trillion AUM. In 2020, The CICC Research Team ranked #1 in Institutional Investor’s All-China Research Category for the eighth year in a row. CICC has over 200 branches across Mainland China, with offices in Hong Kong, Singapore, New York, San Francisco, and London.
