KGRN ETF: China Clean Tech ETF | Renewable Energy
by Kraneshares
Opportunities from China's Environmental Renaissance
Overview of the KraneShares MSCI China Clean Technology Index ETF (Ticker: KGRN)
KGRN | 3/31/2026
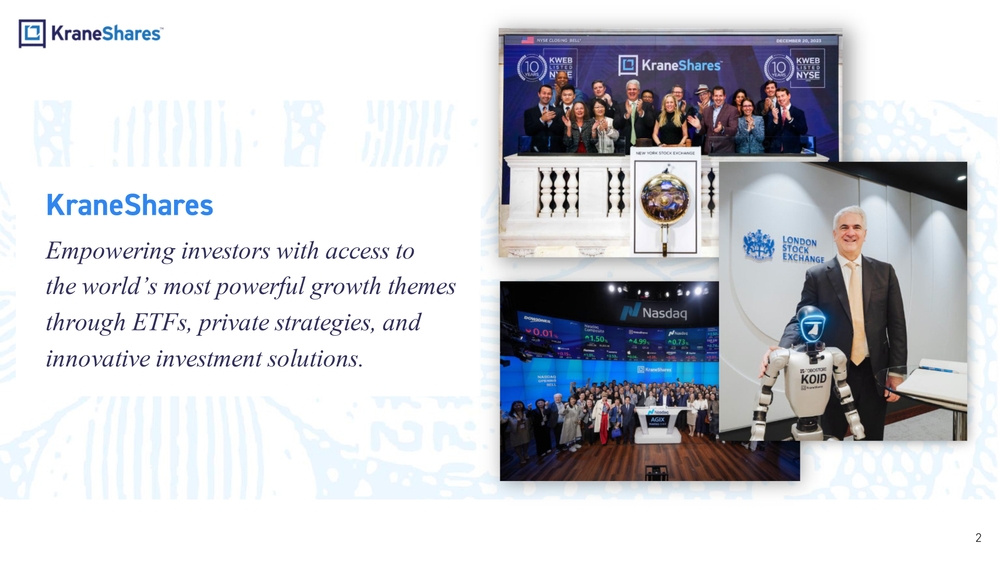
KraneShares
Empowering investors with access to the world's most powerful growth themes through ETFs, private strategies, and innovative investment solutions.
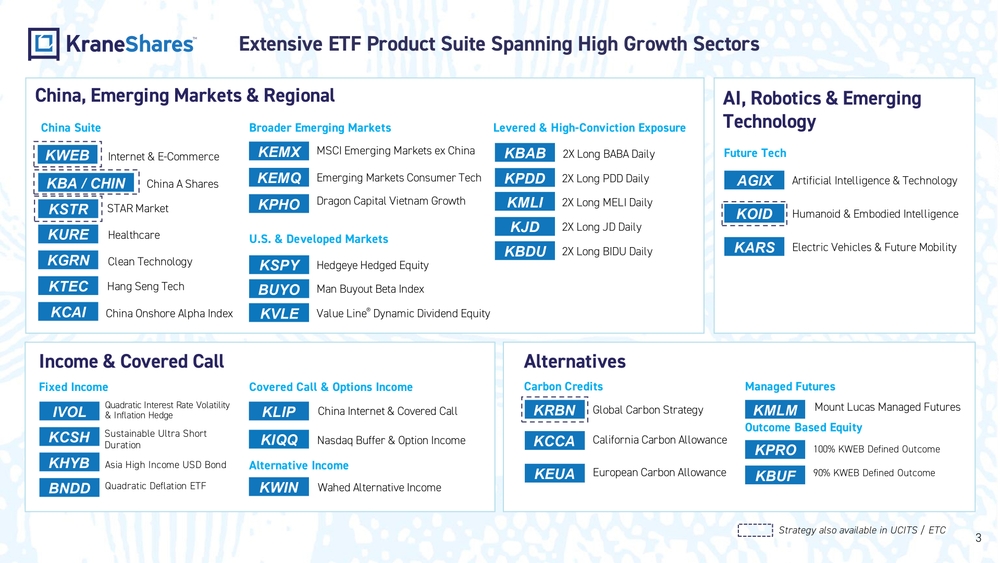
Extensive ETF Product Suite Spanning High Growth Sectors
China, Emerging Markets & Regional
China Suite
- KWEB – Internet & E-Commerce
- KBA / CHIN – China A Shares
- KSTR – STAR Market
- KURE – Healthcare
- KGRN – Clean Technology
- KTEC – Hang Seng Tech
- KCAI – China Onshore Alpha Index
Broader Emerging Markets
- KEMQ – Emerging Markets Consumer Tech
- KPHO – Dragon Capital Vietnam Growth
- KEMX – MSCI Emerging Markets ex China
U.S. & Developed Markets
- KVLE – Value Line® Dynamic Dividend Equity
- KSPY – Hedgeye Hedged Equity
- BUYO – Man Buyout Beta Index
Levered & High-Conviction Exposure
- KBAB – 2X Long BABA Daily
- KPDD – 2X Long PDD Daily
- KMLI – 2X Long MELI Daily
- KJD – 2X Long JD Daily
- KBDU – 2X Long BIDU Daily
AI, Robotics & Emerging Technology
Future Tech
- AGIX – Artificial Intelligence & Technology
- KOID – Humanoid & Embodied Intelligence
- KARS – Electric Vehicles & Future Mobility
Income & Covered Call
Fixed Income
- BNDD – Quadratic Deflation ETF
- IVOL – Quadratic Interest Rate Volatility & Inflation Hedge
- KHYB – Asia High Income USD Bond
- KCSH – Sustainable Ultra Short Duration
Covered Call & Options Income
- KLIP – China Internet & Covered Call
- KIQQ – Nasdaq Buffer & Option Income
Alternative Income
- KWIN – Wahed Alternative Income
Alternatives
Carbon Credits
- KRBN – Global Carbon Strategy
- KCCA – California Carbon Allowance
- KEUA – European Carbon Allowance
Managed Futures
- KMLM – Mount Lucas Managed Futures
Outcome Based Equity
- KPRO – 100% KWEB Defined Outcome
- KBUF – 90% KWEB Defined Outcome
Strategy also available in UCITS / ETC
KGRN – KraneShares MSCI China Clean Technology Index ETF
Investment Strategy
The KraneShares MSCI China Clean Technology Index ETF (KGRN) seeks to track the performance of the MSCI China IMI Environment 10/40 Index. The Index comprises securities that derive at least 50% of their revenues from renewable energy and clean technology products and services. The index is based on four key clean technology and renewable energy themes: Energy Efficiency, Alternative Energy, Sustainable Water, and Pollution Prevention. The index aims to serve as a benchmark for investors seeking exposure to Chinese companies that are poised to experience increased demand stemming from the global energy transition.
China's Environmental Protection Highlights
- The renewable energy sector has become a transformative force in China's economy, playing a crucial role in shaping its investment landscape and growth trajectory.
- In 2025, clean energy technologies contributed 15.4 trillion yuan ($2.1 trillion) to China's economy, accounting for 11.4% of GDP, with the sector continuing to drive more than one-third of economic growth.
- As part of its commitment to peak carbon emissions before 2030 and reach carbon neutrality by 2060, China will roll out a package of major climate initiatives. These include the development of offshore wind farms and the rapid construction of large-scale renewable energy bases in its desert regions, the National Development and Reform Commission announced.
- Historically, China has a proven track record of achieving ambitious long-term renewable energy goals set forth within The Five-Year Plan.
KGRN Features
- Access to China's fast-growing environmental protection industry that has rapidly become the largest renewable energy market in the world.
- Exposure to companies that stand to benefit from China's increased focus and spending on clean energy technologies.
- Exposure to companies that stand to benefit from the energy transition globally.
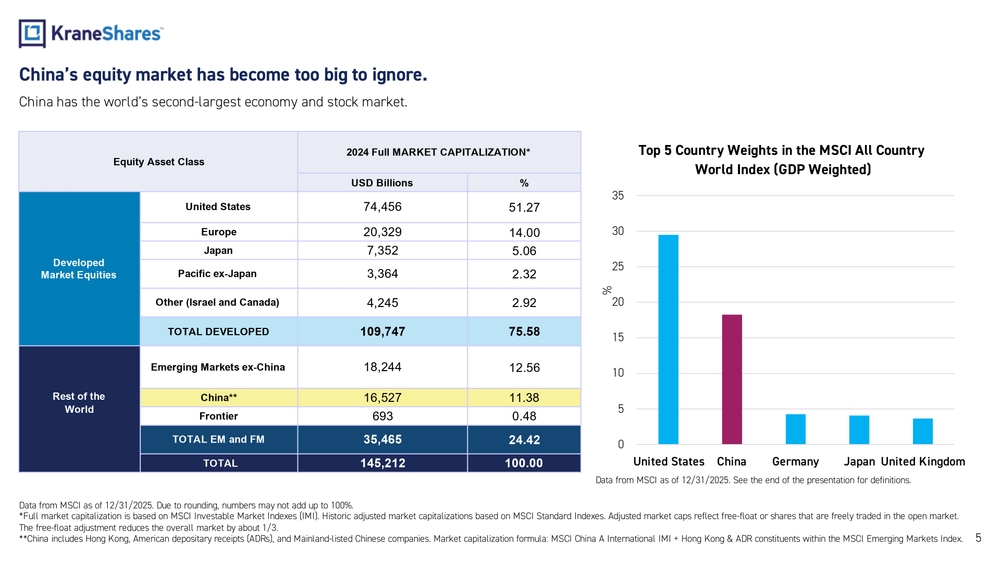
China's equity market has become too big to ignore.
China has the world's second-largest economy and stock market.
2024 Full Market Capitalization
| Equity Asset Class | USD Billions | % |
|---|---|---|
| Developed Market Equities | ||
| United States | 74,456 | 51.27 |
| Europe | 20,329 | 14.00 |
| Japan | 7,352 | 5.06 |
| Pacific ex-Japan | 3,364 | 2.32 |
| Other (Israel and Canada) | 4,245 | 2.92 |
| TOTAL DEVELOPED | 109,747 | 75.58 |
| Rest of the World | ||
| Emerging Markets ex-China | 18,244 | 12.56 |
| China** | 16,527 | 11.38 |
| Frontier | 693 | 0.48 |
| TOTAL EM and FM | 35,465 | 24.42 |
| TOTAL | 145,212 | 100.00 |
Top 5 Country Weights in the MSCI All Country World Index (GDP Weighted)
United States, China, Germany, Japan, United Kingdom
Data from MSCI as of 12/31/2025.
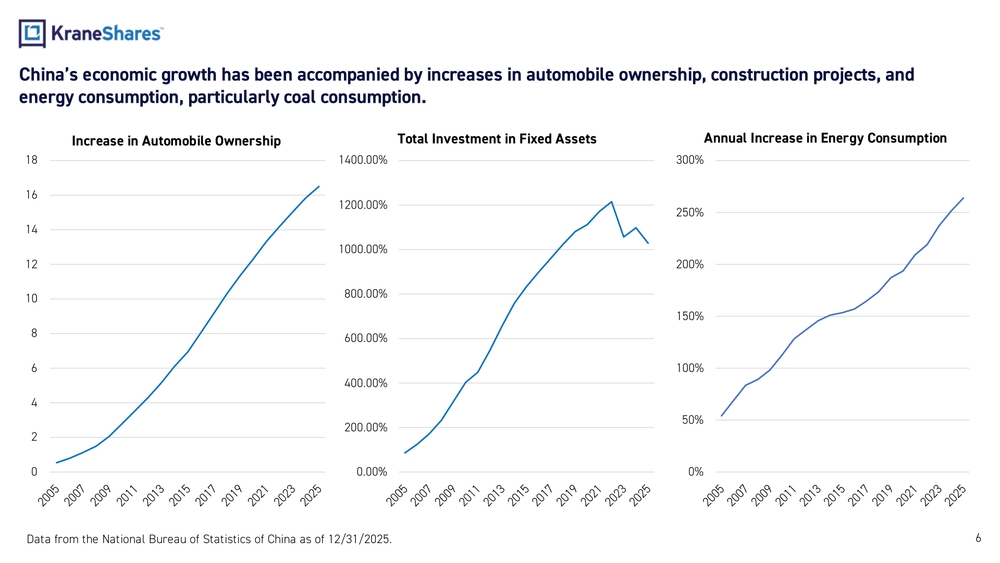
China's economic growth has been accompanied by increases in automobile ownership, construction projects, and energy consumption, particularly coal consumption.
Increase in Automobile Ownership
(2005–2025)
Total Investment in Fixed Assets
(2005–2025, % increase)
Annual Increase in Energy Consumption
(2005–2025, % increase)
Data from the National Bureau of Statistics of China as of 12/31/2025.
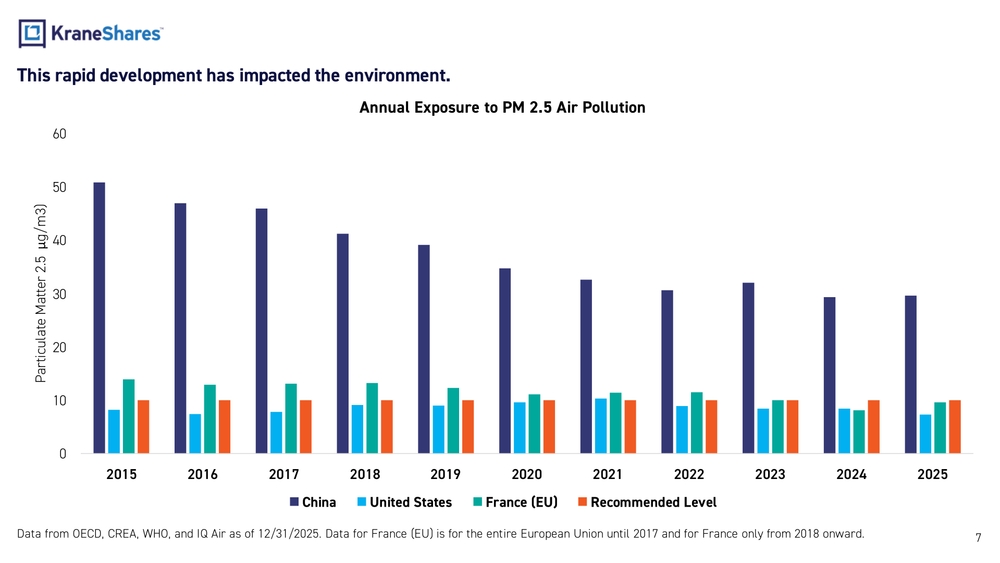
This rapid development has impacted the environment.
Annual Exposure to PM 2.5 Air Pollution
(2015–2025, µg/m³)
| Year | China | United States | France (EU) | Recommended Level |
|---|---|---|---|---|
| 2015 | ~51 | ~8 | ~14 | ~10 |
| 2016 | ~47 | ~7 | ~13 | ~10 |
| 2017 | ~46 | ~8 | ~13 | ~10 |
| 2018 | ~41 | ~9 | ~13 | ~10 |
| 2019 | ~39 | ~9 | ~12 | ~10 |
| 2020 | ~35 | ~10 | ~11 | ~10 |
| 2021 | ~32 | ~10 | ~11 | ~10 |
| 2022 | ~31 | ~9 | ~11 | ~10 |
| 2023 | ~32 | ~8 | ~10 | ~10 |
| 2024 | ~30 | ~8 | ~8 | ~10 |
| 2025 | ~30 | ~7 | ~10 | ~10 |
Data from OECD, CREA, WHO, and IQ Air as of 12/31/2025. Data for France (EU) is for the entire European Union until 2017 and for France only from 2018 onward.
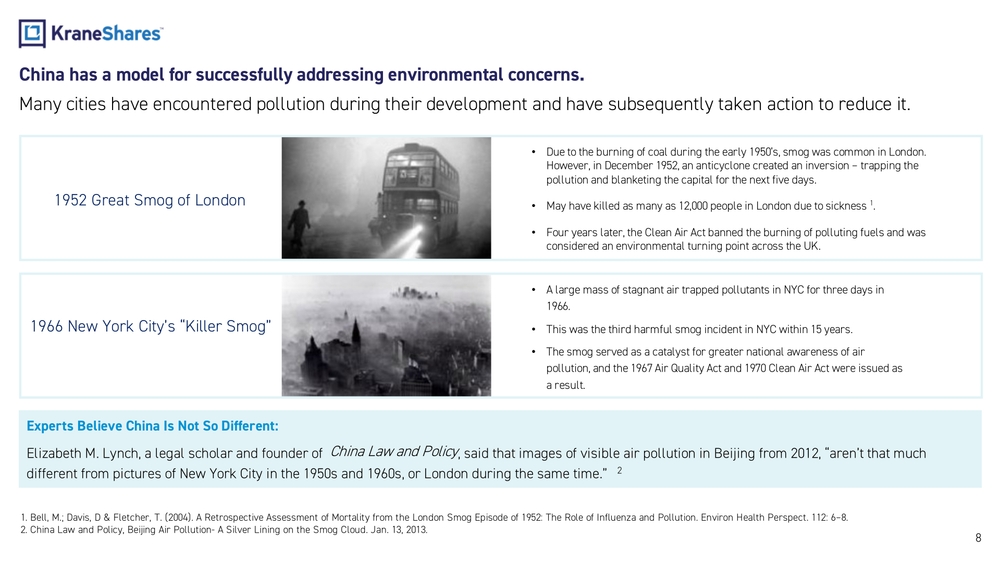
China has a model for successfully addressing environmental concerns.
Many cities have encountered pollution during their development and have subsequently taken action to reduce it.
1952 Great Smog of London
- Due to the burning of coal during the early 1950's, smog was common in London. However, in December 1952, an anticyclone created an inversion – trapping the pollution and blanketing the capital for the next five days.
- May have killed as many as 12,000 people in London due to sickness.
- Four years later, the Clean Air Act banned the burning of polluting fuels and was considered an environmental turning point across the UK.
1966 New York City's "Killer Smog"
- A large mass of stagnant air trapped pollutants in NYC for three days in 1966.
- This was the third harmful smog incident in NYC within 15 years.
- The smog served as a catalyst for greater national awareness of air pollution, and the 1967 Air Quality Act and 1970 Clean Air Act were issued as a result.
Experts Believe China Is Not So Different
Elizabeth M. Lynch, a legal scholar and founder of China Law and Policy, said that images of visible air pollution in Beijing from 2012, "aren't that much different from pictures of New York City in the 1950s and 1960s, or London during the same time."
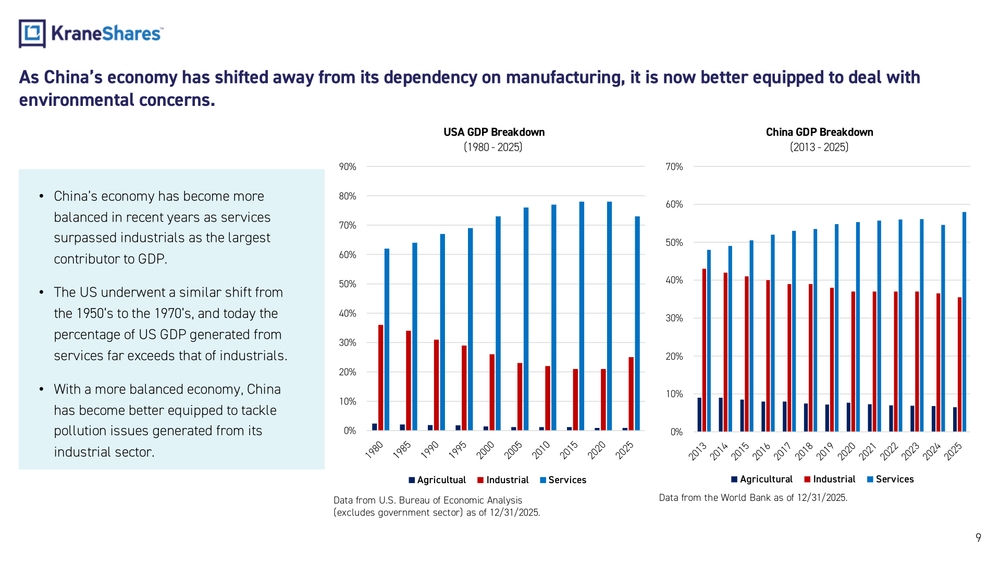
As China's economy has shifted away from its dependency on manufacturing, it is now better equipped to deal with environmental concerns.
- China's economy has become more balanced in recent years as services surpassed industrials as the largest contributor to GDP.
- The US underwent a similar shift from the 1950's to the 1970's, and today the percentage of US GDP generated from services far exceeds that of industrials.
- With a more balanced economy, China has become better equipped to tackle pollution issues generated from its industrial sector.
USA GDP Breakdown (1980–2025)
Agricultural | Industrial | Services
China GDP Breakdown (2013–2025)
Agricultural | Industrial | Services
Data from U.S. Bureau of Economic Analysis (excludes government sector) as of 12/31/2025. Data from the World Bank as of 12/31/2025.
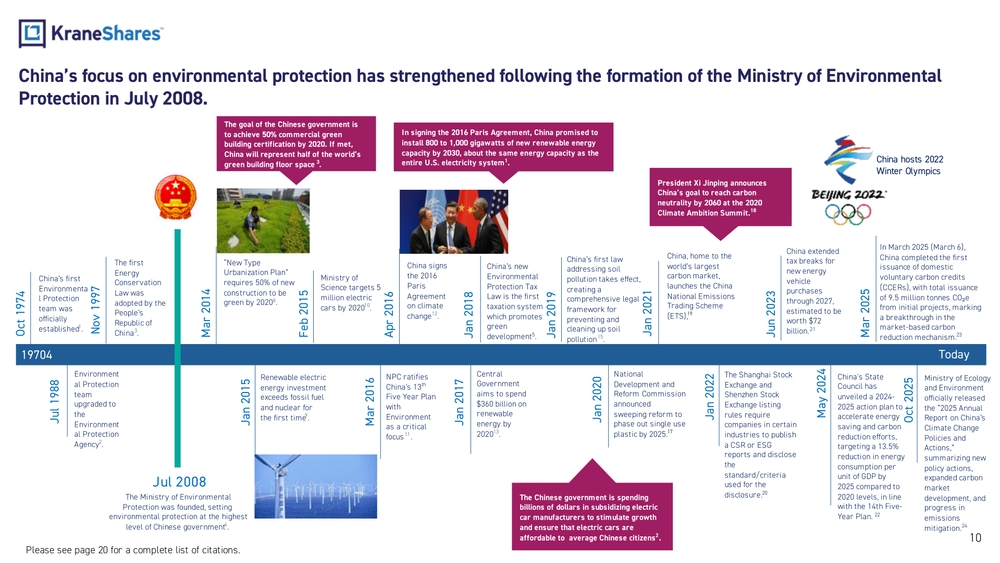
China's focus on environmental protection has strengthened following the formation of the Ministry of Environmental Protection in July 2008.
Timeline of Key Environmental Milestones
- Oct 1974 – China's first Environmental Protection team was officially established.
- Nov 1997 – The first Energy Conservation Law was adopted by the People's Republic of China.
- Jul 1988 – Environmental Protection team upgraded to the Environmental Protection Agency.
- Jul 2008 – The Ministry of Environmental Protection was founded, setting environmental protection at the highest level of Chinese government.
- Jan 2015 – Renewable electric energy investment exceeds fossil fuel and nuclear for the first time.
- Mar 2014 – "New Type Urbanization Plan" requires 50% of new construction to be green by 2020.
- Feb 2015 – Ministry of Science targets 5 million electric cars by 2020.
- Mar 2016 – NPC ratifies China's 13th Five Year Plan with Environment as a critical focus.
- Apr 2016 – China signs the 2016 Paris Agreement on climate change. China promised to install 800 to 1,000 gigawatts of new renewable energy capacity by 2030.
- Jan 2017 – Central Government aims to spend $360 billion on renewable energy by 2020.
- Jan 2018 – China's new Environmental Protection Tax Law is the first taxation system which promotes green development.
- Jan 2019 – China's first law addressing soil pollution takes effect, creating a comprehensive legal framework for preventing and cleaning up soil pollution.
- Jan 2020 – National Development and Reform Commission announced sweeping reform to phase out single use plastic by 2025.
- Jan 2021 – The Chinese government is spending billions of dollars subsidizing electric car manufacturers. China launches the China National Emissions Trading Scheme (ETS), home to the world's largest carbon market.
- Jan 2022 – The Shanghai Stock Exchange and Shenzhen Stock Exchange listing rules require companies in certain industries to publish a CSR or ESG report.
- Jun 2023 – China extended tax breaks for new energy vehicle purchases through 2027, estimated to be worth $72 billion.
- May 2024 – China's State Council unveiled a 2024-2025 action plan targeting a 13.5% reduction in energy consumption per unit of GDP by 2025 compared to 2020 levels.
- Mar 2025 – China completed the first issuance of domestic voluntary carbon credits (CCERs), with total issuance of 9.5 million tonnes CO₂e.
- Oct 2025 – Ministry of Ecology and Environment officially released the "2025 Annual Report on China's Climate Change Policies and Actions."
- China hosts 2022 Winter Olympics.
- President Xi Jinping announces China's goal to reach carbon neutrality by 2060 at the 2020 Climate Ambition Summit.
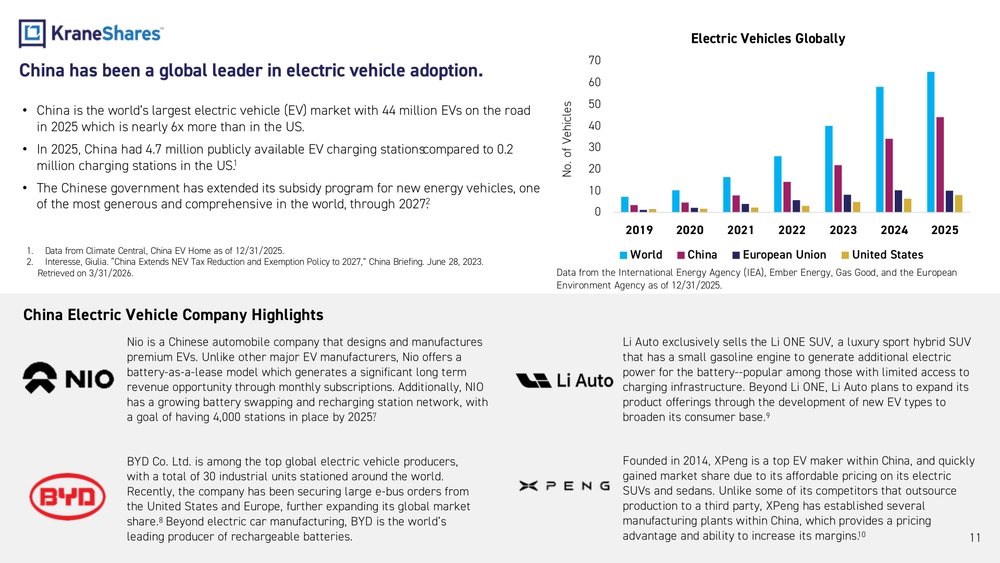
China has been a global leader in electric vehicle adoption.
- China is the world's largest electric vehicle (EV) market with 44 million EVs on the road in 2025 which is nearly 6x more than in the US.
- In 2025, China had 4.7 million publicly available EV charging stations compared to 0.2 million charging stations in the US.
- The Chinese government has extended its subsidy program for new energy vehicles, one of the most generous and comprehensive in the world, through 2027.
China Electric Vehicle Company Highlights
NIO is a Chinese automobile company that designs and manufactures premium EVs. Unlike other major EV manufacturers, Nio offers a battery-as-a-lease model which generates a significant long term revenue opportunity through monthly subscriptions. Additionally, NIO has a growing battery swapping and recharging station network, with a goal of having 4,000 stations in place by 2025.
BYD Co. Ltd. is among the top global electric vehicle producers, with a total of 30 industrial units stationed around the world. Recently, the company has been securing large e-bus orders from the United States and Europe, further expanding its global market share. Beyond electric car manufacturing, BYD is the world's leading producer of rechargeable batteries.
Li Auto exclusively sells the Li ONE SUV, a luxury sport hybrid SUV that has a small gasoline engine to generate additional electric power for the battery--popular among those with limited access to charging infrastructure. Beyond Li ONE, Li Auto plans to expand its product offerings through the development of new EV types to broaden its consumer base.
XPeng is a top EV maker within China, and quickly gained market share due to its affordable pricing on its electric SUVs and sedans. Unlike some of its competitors that outsource production to a third party, XPeng has established several manufacturing plants within China, which provides a pricing advantage and ability to increase its margins.
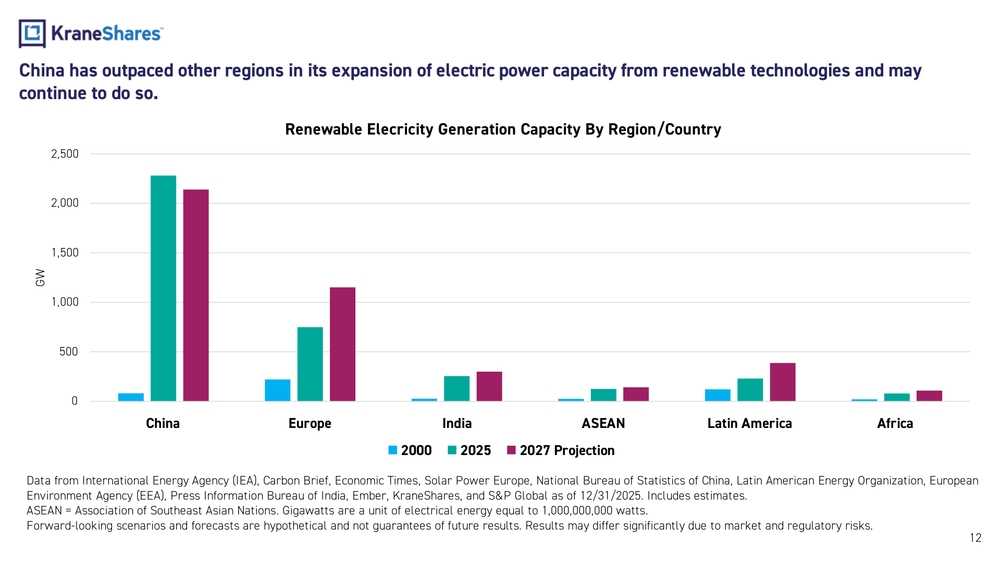
China has outpaced other regions in its expansion of electric power capacity from renewable technologies and may continue to do so.
Renewable Electricity Generation Capacity By Region/Country
Chart showing renewable electricity generation capacity (in GW) for China, Europe, India, ASEAN, Latin America, and Africa for years 2000, 2025, and 2027 Projection.
China leads all regions with approximately 2,300 GW in 2025 and a projected ~2,150 GW in 2027. Europe is second with ~750 GW in 2025 and ~1,150 GW projected in 2027.
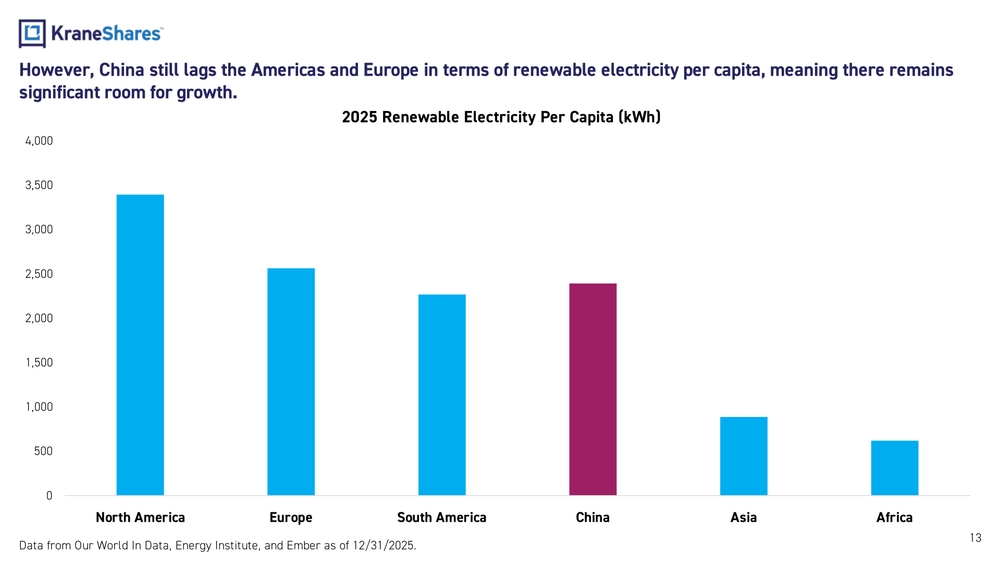
However, China still lags the Americas and Europe in terms of renewable electricity per capita, meaning there remains significant room for growth.
2025 Renewable Electricity Per Capita (kWh)
Chart comparing 2025 renewable electricity per capita (kWh) across regions:
- North America: ~3,400 kWh
- Europe: ~2,600 kWh
- South America: ~2,300 kWh
- China: ~2,400 kWh
- Asia: ~900 kWh
- Africa: ~600 kWh
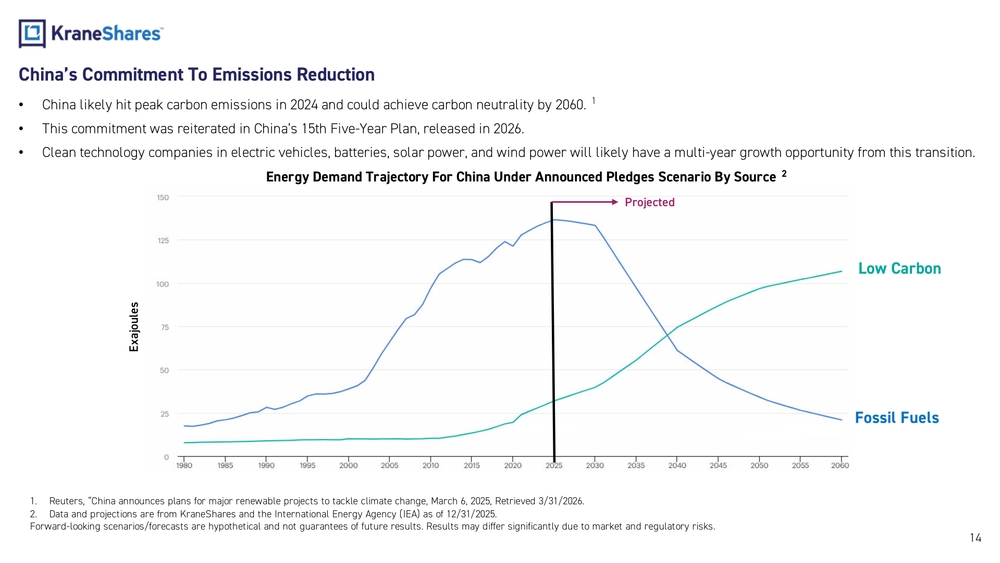
China's Commitment To Emissions Reduction
- China likely hit peak carbon emissions in 2024 and could achieve carbon neutrality by 2060.
- This commitment was reiterated in China's 15th Five-Year Plan, released in 2026.
- Clean technology companies in electric vehicles, batteries, solar power, and wind power will likely have a multi-year growth opportunity from this transition.
Energy Demand Trajectory For China Under Announced Pledges Scenario By Source
Chart showing China's energy demand trajectory (in Exajoules) from 1980 to 2060, with a projected crossover where Low Carbon energy surpasses Fossil Fuels after approximately 2025.
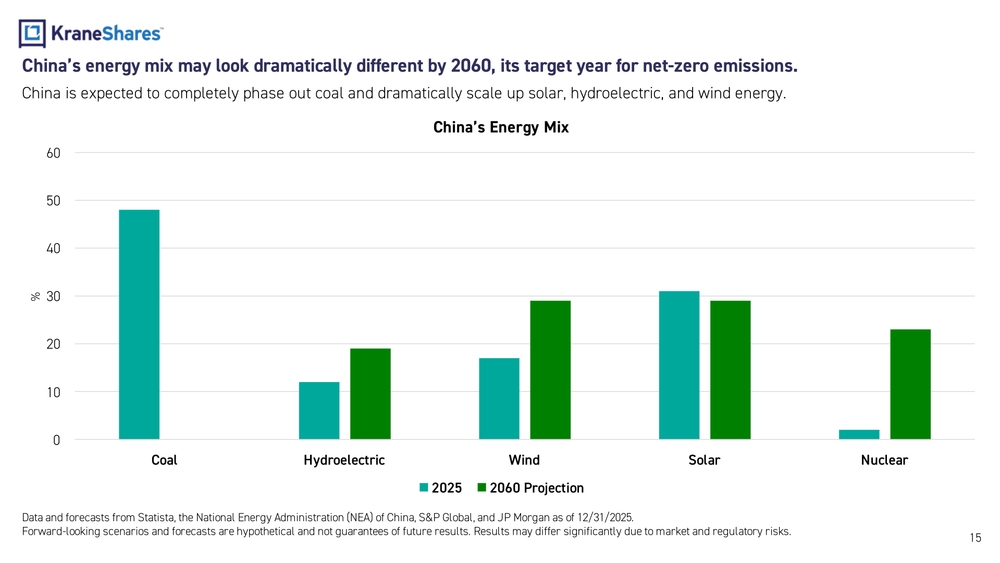
China's energy mix may look dramatically different by 2060, its target year for net-zero emissions.
China is expected to completely phase out coal and dramatically scale up solar, hydroelectric, and wind energy.
China's Energy Mix
Chart comparing China's energy mix (%) in 2025 vs. 2060 Projection:
- Coal: ~48% (2025) → ~0% (2060)
- Hydroelectric: ~12% (2025) → ~19% (2060)
- Wind: ~17% (2025) → ~29% (2060)
- Solar: ~31% (2025) → ~29% (2060)
- Nuclear: ~2% (2025) → ~23% (2060)
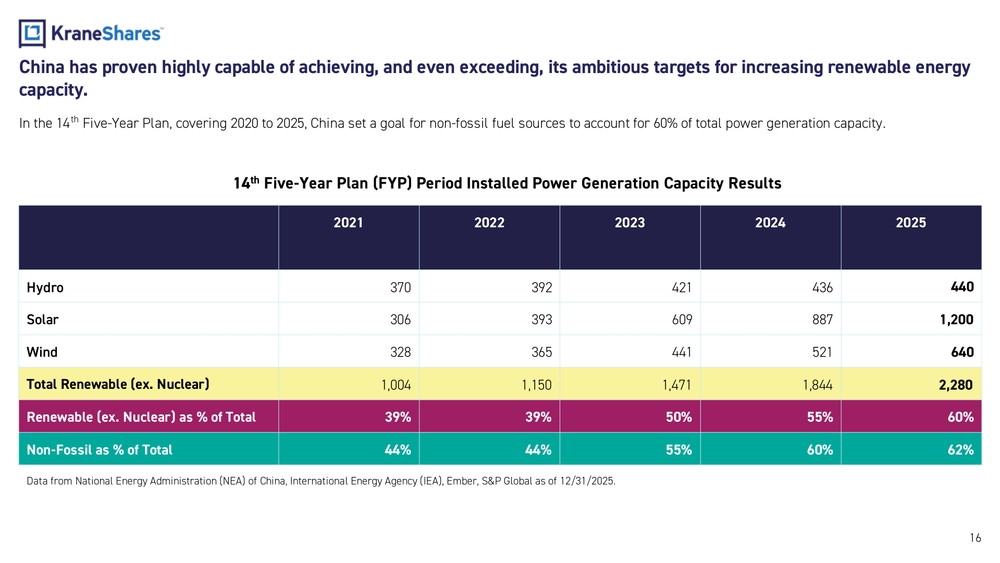
China has proven highly capable of achieving, and even exceeding, its ambitious targets for increasing renewable energy capacity.
In the 14th Five-Year Plan, covering 2020 to 2025, China set a goal for non-fossil fuel sources to account for 60% of total power generation capacity.
14th Five-Year Plan (FYP) Period Installed Power Generation Capacity Results
| 2021 | 2022 | 2023 | 2024 | 2025 | |
|---|---|---|---|---|---|
| Hydro | 370 | 392 | 421 | 436 | 440 |
| Solar | 306 | 393 | 609 | 887 | 1,200 |
| Wind | 328 | 365 | 441 | 521 | 640 |
| Total Renewable (ex. Nuclear) | 1,004 | 1,150 | 1,471 | 1,844 | 2,280 |
| Renewable (ex. Nuclear) as % of Total | 39% | 39% | 50% | 55% | 60% |
| Non-Fossil as % of Total | 44% | 44% | 55% | 60% | 62% |
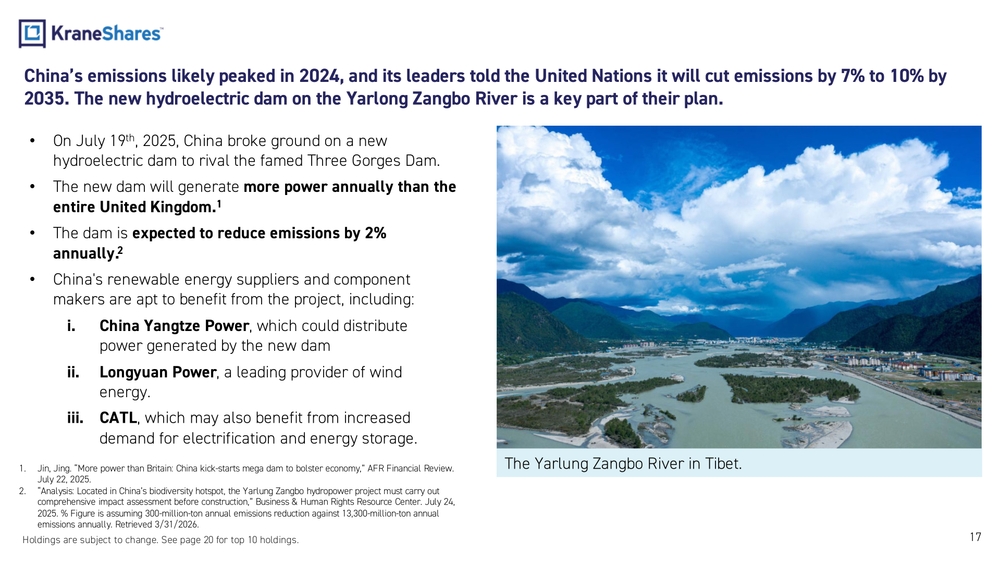
China's emissions likely peaked in 2024, and its leaders told the United Nations it will cut emissions by 7% to 10% by 2035. The new hydroelectric dam on the Yarlong Zangbo River is a key part of their plan.
- On July 19th, 2025, China broke ground on a new hydroelectric dam to rival the famed Three Gorges Dam.
- The new dam will generate more power annually than the entire United Kingdom.
- The dam is expected to reduce emissions by 2% annually.
- China's renewable energy suppliers and component makers are apt to benefit from the project, including:
- i. China Yangtze Power, which could distribute power generated by the new dam
- ii. Longyuan Power, a leading provider of wind energy.
- iii. CATL, which may also benefit from increased demand for electrification and energy storage.
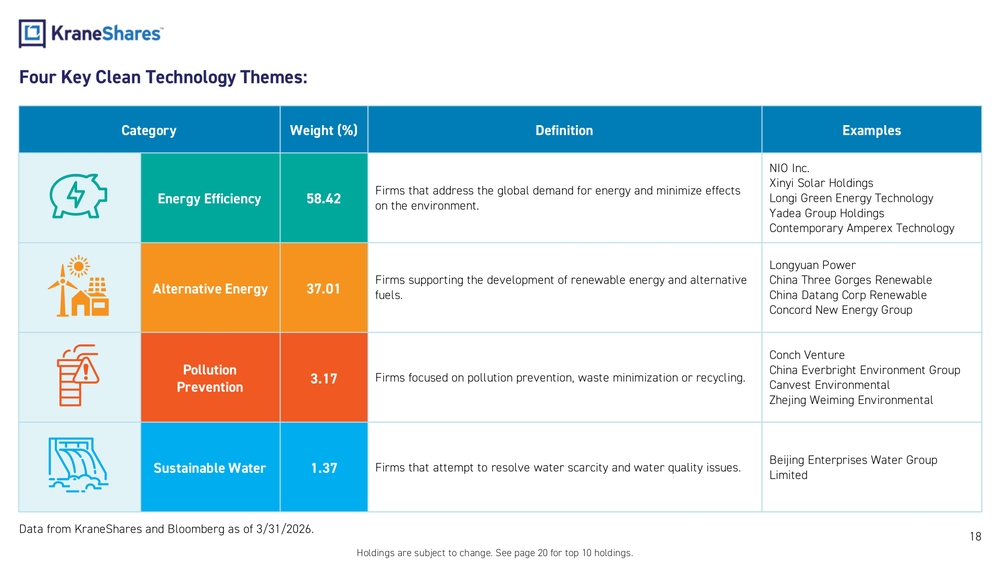
Four Key Clean Technology Themes:
| Category | Weight (%) | Definition | Examples |
|---|---|---|---|
| Energy Efficiency | 58.42 | Firms that address the global demand for energy and minimize effects on the environment. | NIO Inc., Xinyi Solar Holdings, Longi Green Energy Technology, Yadea Group Holdings, Contemporary Amperex Technology |
| Alternative Energy | 37.01 | Firms supporting the development of renewable energy and alternative fuels. | Longyuan Power, China Three Gorges Renewable, China Datang Corp Renewable, Concord New Energy Group |
| Pollution Prevention | 3.17 | Firms focused on pollution prevention, waste minimization or recycling. | Conch Venture, China Everbright Environment Group, Canvest Environmental, Zhejing Weiming Environmental |
| Sustainable Water | 1.37 | Firms that attempt to resolve water scarcity and water quality issues. | Beijing Enterprises Water Group Limited |
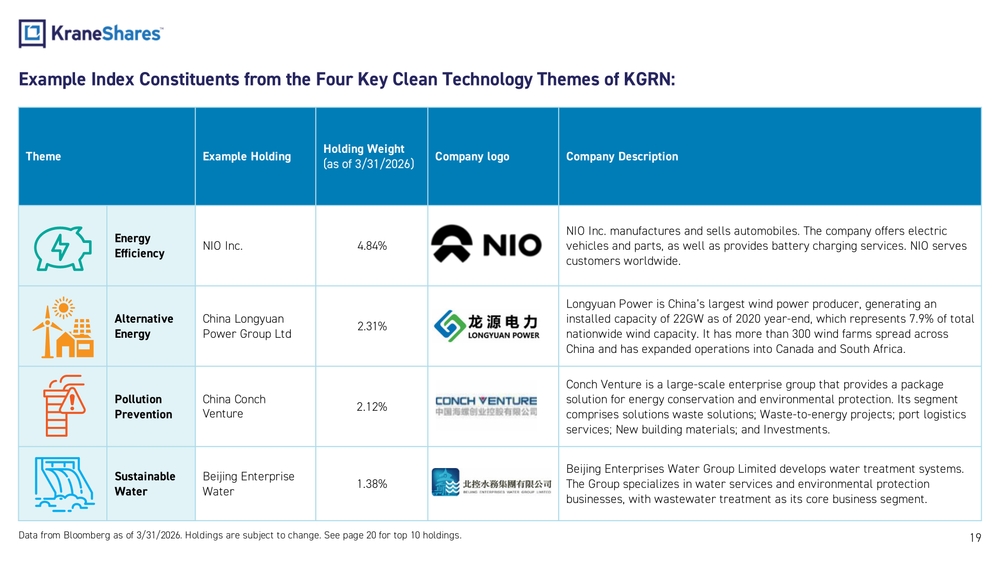
Example Index Constituents from the Four Key Clean Technology Themes of KGRN:
| Theme | Example Holding | Holding Weight (as of 3/31/2026) | Company Description |
|---|---|---|---|
| Energy Efficiency | NIO Inc. | 4.84% | NIO Inc. manufactures and sells automobiles. The company offers electric vehicles and parts, as well as provides battery charging services. NIO serves customers worldwide. |
| Alternative Energy | China Longyuan Power Group Ltd | 2.31% | Longyuan Power is China's largest wind power producer, generating an installed capacity of 22GW as of 2020 year-end, which represents 7.9% of total nationwide wind capacity. It has more than 300 wind farms spread across China and has expanded operations into Canada and South Africa. |
| Pollution Prevention | China Conch Venture | 2.12% | Conch Venture is a large-scale enterprise group that provides a package solution for energy conservation and environmental protection. Its segment comprises solutions waste solutions; Waste-to-energy projects; port logistics services; New building materials; and Investments. |
| Sustainable Water | Beijing Enterprise Water | 1.38% | Beijing Enterprises Water Group Limited develops water treatment systems. The Group specializes in water services and environmental protection businesses, with wastewater treatment as its core business segment. |
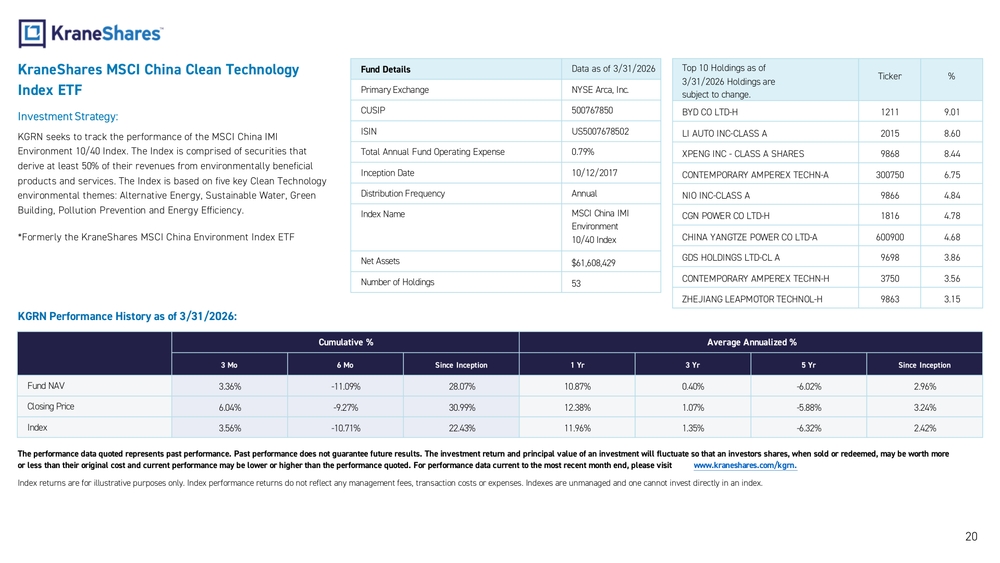
KraneShares MSCI China Clean Technology Index ETF
Investment Strategy:
KGRN seeks to track the performance of the MSCI China IMI Environment 10/40 Index. The Index is comprised of securities that derive at least 50% of their revenues from environmentally beneficial products and services. The Index is based on five key Clean Technology environmental themes: Alternative Energy, Sustainable Water, Green Building, Pollution Prevention and Energy Efficiency.
Formerly the KraneShares MSCI China Environment Index ETF
Fund Details (Data as of 3/31/2026)
| Primary Exchange | NYSE Arca, Inc. |
| CUSIP | 500767850 |
| ISIN | US5007678502 |
| Total Annual Fund Operating Expense | 0.79% |
| Inception Date | 10/12/2017 |
| Distribution Frequency | Annual |
| Index Name | MSCI China IMI Environment 10/40 Index |
| Net Assets | $61,608,429 |
| Number of Holdings | 53 |
Top 10 Holdings as of 3/31/2026
| Ticker | % |
|---|---|
| BYD CO LTD-H (1211) | 9.01 |
| LI AUTO INC-CLASS A (2015) | 8.60 |
| XPENG INC - CLASS A SHARES (9868) | 8.44 |
| CONTEMPORARY AMPEREX TECHN-A (300750) | 6.75 |
| NIO INC-CLASS A (9866) | 4.84 |
| CGN POWER CO LTD-H (1816) | 4.78 |
| CHINA YANGTZE POWER CO LTD-A (600900) | 4.68 |
| GDS HOLDINGS LTD-CL A (9698) | 3.86 |
| CONTEMPORARY AMPEREX TECHN-H (3750) | 3.56 |
| ZHEJIANG LEAPMOTOR TECHNOL-H (9863) | 3.15 |
KGRN Performance History as of 3/31/2026:
| Cumulative % | Average Annualized % | ||||||
|---|---|---|---|---|---|---|---|
| 3 Mo | 6 Mo | Since Inception | 1 Yr | 3 Yr | 5 Yr | Since Inception | |
| Fund NAV | 3.36% | -11.09% | 28.07% | 10.87% | 0.40% | -6.02% | 2.96% |
| Closing Price | 6.04% | -9.27% | 30.99% | 12.38% | 1.07% | -5.88% | 3.24% |
| Index | 3.56% | -10.71% | 22.43% | 11.96% | 1.35% | -6.32% | 2.42% |
Slide 10 List of Citations (retrieved 12/31/2025):
- China's Ministry of Environmental Protection website, About MEP, History.
- China's Ministry of Environmental Protection website, About MEP, History.
- The National People's Congress of the PRC, Database of Laws and Regulations, "Law of the People's Republic of China on Energy Conservation."
- China's Ministry of Environmental Protection website, About MEP, History.
- "5 Laws To Watch Out For In 2018" China Water Risk, Feb. 14, 2018.
- Library of Congress, "China: 2018 Constitutional Amendment Adopted", May 18, 2018.
- International Energy Agency, Policies and Measures of China, Wind Power Technology Development 12th Five Year Special Planning. Oct. 31, 2013.
- Ernst & Young, "China: Planning for an urban future".
- REN21 Renewables Global Status Report 2016.
- Tech in Asia, "China's government wants 5 million electric cars on the roads by 2020." Feb. 19, 2015.
- Central Committee of the Communist Party of China, "The 13th Five Year Plan for Economic and Social Development of the People's Republic of China, 2016-2020".
- United Nations Framework Convention on Climate Change, Paris Agreement – Status of Ratification. Nov. 4, 2016.
- New York Times, "China Aims to Spend at Least $360 Billion on Renewable Energy by 2020." Jan. 5, 2017.
- Supchina, "Electric vehicles now 1.2 percent of car market in China." May 26, 2017.
- Global Compliance News, "China's new Law on the Prevention and Control of Soil Pollution imposes new obligations on enterprises and landowners", October 16, 2018.
- Bloomberg News, "Chinese Food Giant Raises $2.1 Billion in Country's First Sustainability Loan." July 16, 2019.
- SCMP, "China unveils sweeping plan to reduce single-use plastic by 2025", Jan. 20, 2020.
- Xinhua, "Remarks by Chinese President Xi Jinping at Climate Ambition Summit", Dec. 12, 2020.
- Environmental Defense Fund, "China's National ETS Open for Business", Jan. 5, 2021.
- ESG Investor, "China's ESG Policy Dash," March 29, 2023.
- Reuters, "China unveils $72 billion tax break for EVs, other green cars to spur demand," Jun 21, 2023
- Climate Cooperation China, "China Issues Action Plan for Energy Saving and Carbon Reduction (2024-2025)," July 5, 2024
- Progress Report of China's National Carbon Market (2025), Oct 4, 2025
- China's PoliciesandActionsforAddressingClimateChange2025Annual Report, Oct 2025
Important Notes
Carefully consider the Funds' investment objectives, risk factors, charges and expenses before investing. This and additional information can be found in the Funds' full and summary prospectus, which may be obtained by visiting www.kraneshares.com/kgrn. Read the prospectus carefully before investing.
Risk Disclosures:
Investing involves risk, including possible loss of principal. There can be no assurance that a Fund will achieve its stated objectives. Indices are unmanaged and do not include the effect of fees. One cannot invest directly in an index.
This information should not be relied upon as research, investment advice, or a recommendation regarding any products, strategies, or any security in particular. This material is strictly for illustrative, educational, or informational purposes and is subject to change. Certain content represents an assessment of the market environment at a specific time and is not intended to be a forecast of future events or a guarantee of future results; material is as of the dates noted and is subject to change without notice.
The Fund may invest in derivatives, which are often more volatile than other investments and may magnify the Fund's gains or losses. A derivative (i.e., futures/forward contracts, swaps, and options) is a contract that derives its value from the performance of an underlying asset. The primary risk of derivatives is that changes in the asset's market value and the derivative may not be proportionate, and some derivatives can have the potential for unlimited losses. Derivatives are also subject to liquidity and counterparty risk. The Fund is subject to liquidity risk, meaning that certain investments may become difficult to purchase or sell at a reasonable time and price. If a transaction for these securities is large, it may not be possible to initiate, which may cause the Fund to suffer losses. Counterparty risk is the risk of loss in the event that the counterparty to an agreement fails to make required payments or otherwise comply with the terms of the derivative.
The ability of the Fund to achieve its respective investment objectives is dependent, in part, on the continuous availability of A Shares and the ability to obtain, if necessary, additional A Shares quota. If the Fund is unable to obtain sufficient exposure to limited availability of A Share quota, the Fund could seek exposure to the component securities of the Underlying Index by investment in other types of securities. The Fund is subject to political, social or economic instability within China which may cause decline in value. Emerging markets involve heightened risk related to the same factors as well as increase volatility and lower trading volume. Fluctuations in currency of foreign countries may have an adverse effect to domestic currency values. The Fund may underperform other similar funds that do not consider conscious company/ESG guidelines when making investment decisions. The Fund may invest in Initial Public Offerings (IPOs). Securities issued in IPOs have no trading history, and information about the companies may be available for very limited periods. In addition, the prices of securities sold in IPOs may be highly volatile. In addition, as the Fund increases in size, the impact of IPOs on the Fund's performance will generally decrease.
Risk Disclosures Continued:
Narrowly focused investments typically exhibit higher volatility. The Fund's assets are expected to be concentrated in a sector, industry, market, or group of concentrations to the extent that the Underlying Index has such concentrations. The securities or futures in that concentration could react similarly to market developments. Thus, the Fund is subject to loss due to adverse occurrences that affect that concentration. In addition to the normal risks associated with investing, investments in smaller companies typically exhibit higher volatility. KGRN is non-diversified.
ETF shares are bought and sold on an exchange at market price (not NAV) and are not individually redeemed from the Fund. However, shares may be redeemed at NAV directly by certain authorized broker-dealers (Authorized Participants) in very large creation/redemption units. The returns shown do not represent the returns you would receive if you traded shares at other times. Shares may trade at a premium or discount to their NAV in the secondary market. Brokerage commissions will reduce returns. Beginning 12/23/2020, market price returns are based on the official closing price of an ETF share or, if the official closing price isn't available, the midpoint between the national best bid and national best offer ("NBBO") as of the time the ETF calculates the current NAV per share. Prior to that date, market price returns were based on the midpoint between the Bid and Ask price. NAVs are calculated using prices as of 4:00 PM Eastern Time.
The KraneShares ETFs and KFA Funds ETFs are distributed by SEI Investments Distribution Company (SIDCO), 1 Freedom Valley Drive, Oaks, PA 19456, which is not affiliated with Krane Funds Advisors, LLC, the Investment Adviser for the Funds, or any sub-advisers for the Funds.