KAIT Presentation
by Kraneshares
info@kraneshares.comKAIT 8/19/2026 Investing in Asia’s Critical AI Supply - Chain Bottlenecks An overview of the KraneShares Asia AI Technology ETF (Ticker: KAIT)
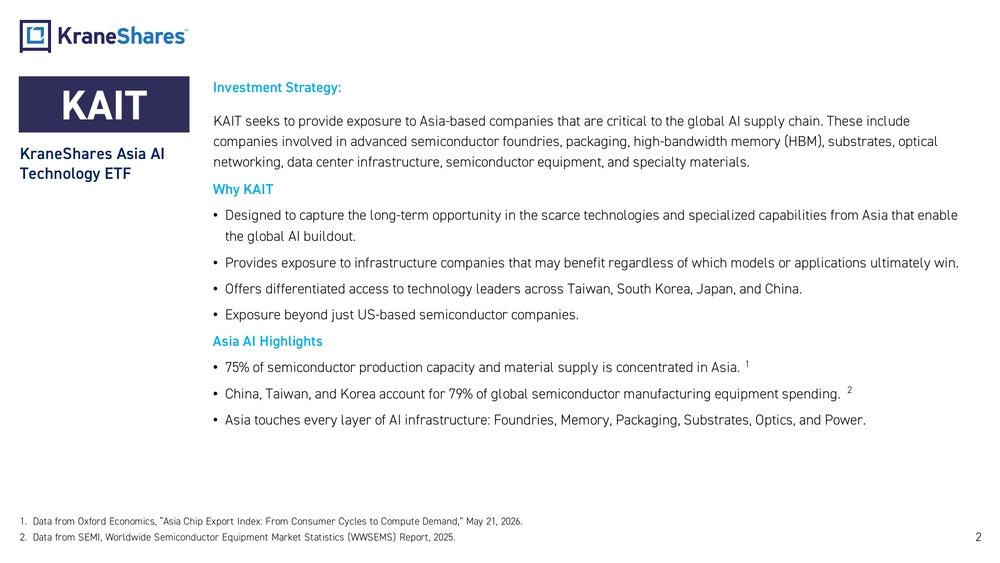
Investment Strategy: KAIT seeks to provide exposure to Asia -based companies that are critical to the global AI supply chain. These include companies involved in advanced semiconductor foundries, packaging, high -bandwidth memory (HBM), substrates, optical networking, data center infrastructure, semiconductor equipment, and specialty materials. Why KAIT •Designed to capture the long -term opportunity in the scarce technologies and specialized capabilities from Asia that enable the global AI buildout. •Provides exposure to infrastructure companies that may benefit regardless of which models or applications ultimately win. •Offers differentiated access to technology leaders across Taiwan, South Korea, Japan, and China. •Exposure beyond just US -based semiconductor companies. Asia AI Highlights •75% of semiconductor production capacity and material supply is concentrated in Asia.1 •China, Taiwan, and Korea account for 79% of global semiconductor manufacturing equipment spending.2 •Asia touches every layer of AI infrastructure: Foundries, Memory, Packaging, Substrates, Optics, and Power. KAIT KraneShares Asia AI Technology ETF 1.Data from Oxford Economics, “Asia Chip Export Index: From Consumer Cycles to Compute Demand,” May 21, 2026. 2.Data from SEMI, Worldwide Semiconductor Equipment Market Statistics (WWSEMS) Report, 2025. 2
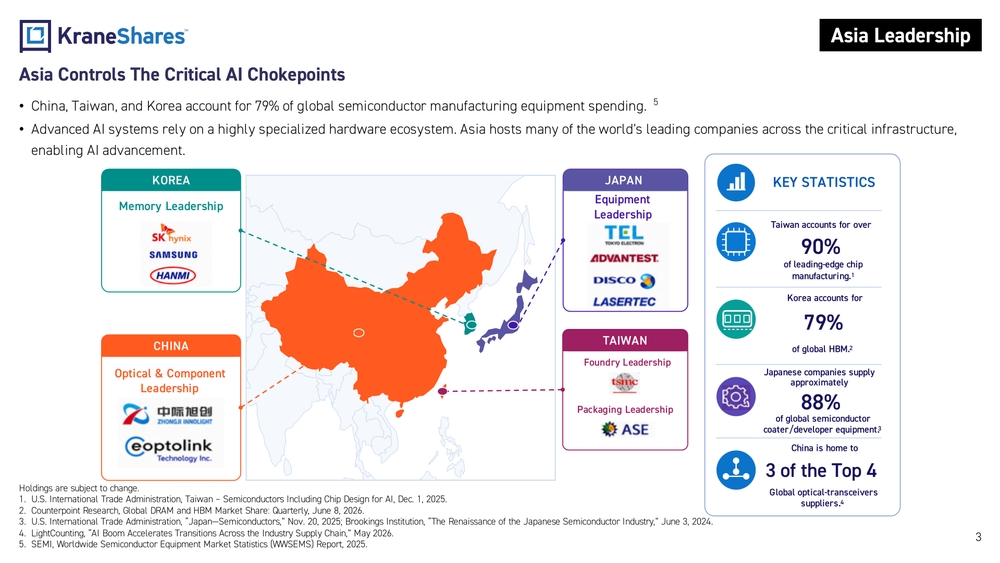
3Asia Leadership KOREA Memory Leadership CHINA Optical & Component LeadershipJAPAN Equipment Leadership TAIWAN Foundry Leadership Packaging LeadershipKEY STATISTICS Taiwan accounts for over 90% of leading -edge chip manufacturing.1 Korea accounts for 79% of global HBM.2 Japan ese companies supply approximately 88% of global semiconductor coater/developer equipment.3 China is home to 3 of the Top 4 Global optical -transceivers suppliers.4 Holdings are subject to change. 1.U.S. International Trade Administration, Taiwan – Semiconductors Including Chip Design for AI, Dec. 1, 2025. 2.Counterpoint Research, Global DRAM and HBM Market Share: Quarterly, June 8, 2026. 3.U.S. International Trade Administration, “Japan —Semiconductors,” Nov. 20, 2025; Brookings Institution, “The Renaissance of the J apanese Semiconductor Industry,” June 3, 2024. 4.LightCounting , “AI Boom Accelerates Transitions Across the Industry Supply Chain,” May 2026. 5.SEMI, Worldwide Semiconductor Equipment Market Statistics (WWSEMS) Report, 2025.Asia Controls The Critical AI Chokepoints •China, Taiwan, and Korea account for 79% of global semiconductor manufacturing equipment spending.5 •Advanced AI systems rely on a highly specialized hardware ecosystem . Asia hosts many of the world's leading companies across the critical infrastructure, enabling AI advancement.
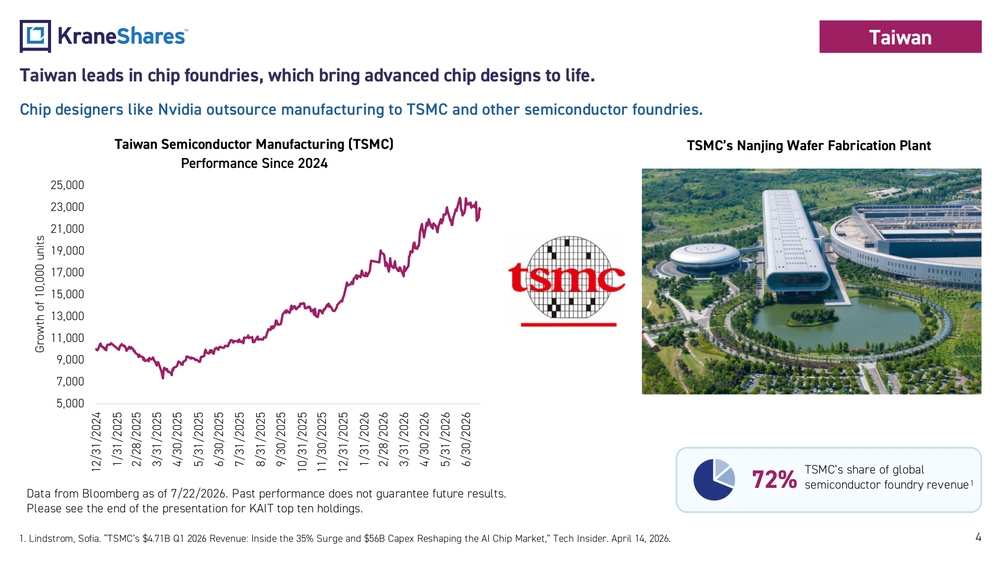
5,0007,0009,00011,00013,00015,00017,00019,00021,00023,00025,000 12/31/2024 1/31/2025 2/28/2025 3/31/2025 4/30/2025 5/31/2025 6/30/2025 7/31/2025 8/31/2025 9/30/2025 10/31/2025 11/30/2025 12/31/2025 1/31/2026 2/28/2026 3/31/2026 4/30/2026 5/31/2026 6/30/2026Growth of 10,000 unitsTaiwan Semiconductor Manufacturing (TSMC) Performance Since 2024 4Taiwan leads in chip foundries, which bring advanced chip designs to life.Taiwan Chip designers like Nvidia outsource manufacturing to TSMC and other semiconductor foundries. Data from Bloomberg as of 7/22/2026. Past performance does not guarantee future results. Please see the end of the presentation for KAIT top ten holdings.72%TSMC’s share of global semiconductor foundry revenue1
- Lindstrom, Sofia. “TSMC’s $4.71B Q1 2026 Revenue: Inside the 35% Surge and $56B Capex Reshaping the AI Chip Market,” Tech Insider. April 14, 2026. TSMC’s Nanjing Wafer Fabrication Plant
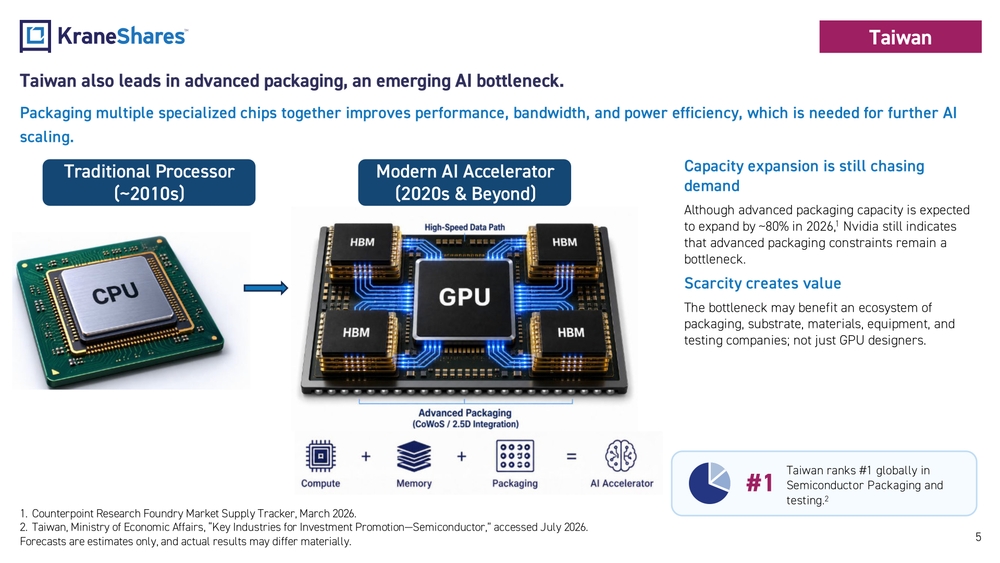
5Taiwan Traditional Processor (~2010s)Modern AI Accelerator (2020s & Beyond) Capacity expansion is still chasing demand Although advanced packaging capacity is expected to expand by ~80% in 2026,1 Nvidia still indicates that advanced packaging constraints remain a bottleneck. Scarcity creates value The bottleneck may benefit an ecosystem of packaging, substrate, materials, equipment, and testing companies; not just GPU designers. 1.Counterpoint Research Foundry Market Supply Tracker , March 2026. 2.Taiwan, Ministry of Economic Affairs, “Key Industries for Investment Promotion —Semiconductor,” accessed July 2026. Forecasts are estimates only, and actual results may differ materially.Taiwan also leads in advanced packaging, an emerging AI bottleneck. Packaging multiple specialized chips together improves performance, bandwidth, and power efficiency, which is needed for furt her AI scaling. #1Taiwan ranks #1 globally in Semiconductor Packaging and testing.2
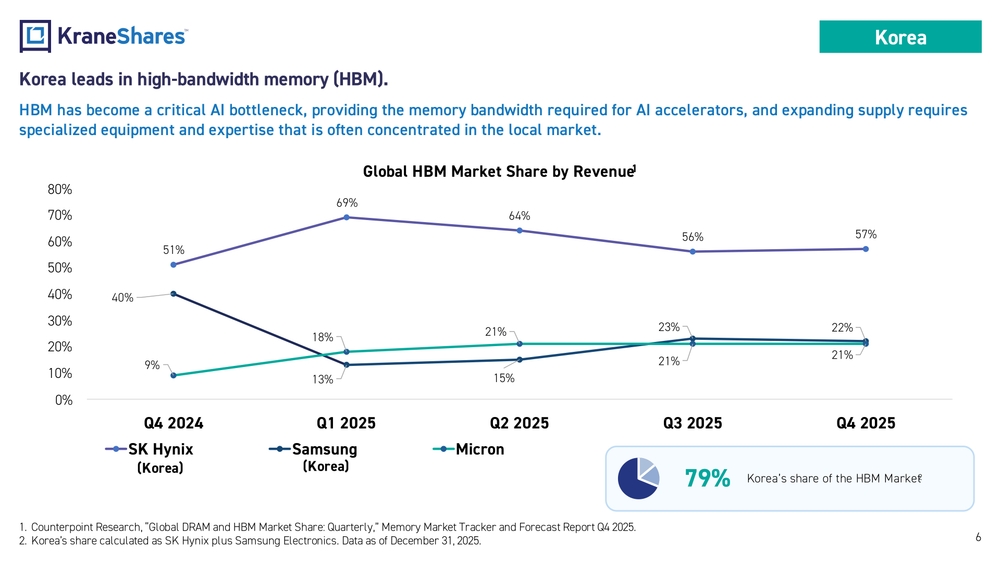
Korea leads in high -bandwidth memory (HBM). HBM has become a critical AI bottleneck, providing the memory bandwidth required for AI accelerators, and expanding supply re quires specialized equipment and expertise that is often concentrated in the local market. 51%69% 64% 56% 57% 40% 13% 15%23% 22% 9%18%21% 21%21% 0%10%20%30%40%50%60%70%80% Q4 2024 Q1 2025 Q2 2025 Q3 2025 Q4 2025Global HBM Market Share by Revenue1 SK Hynix Samsung Micron 1.Counterpoint Research, “Global DRAM and HBM Market Share: Quarterly,” Memory Market Tracker and Forecast Report Q4 2025. 2.Korea’s share calculated as SK Hynix plus Samsung Electronics. Data as of December 31, 2025. 6Korea 79% Korea’s share of the HBM Market2 (Korea) (Korea)
7China
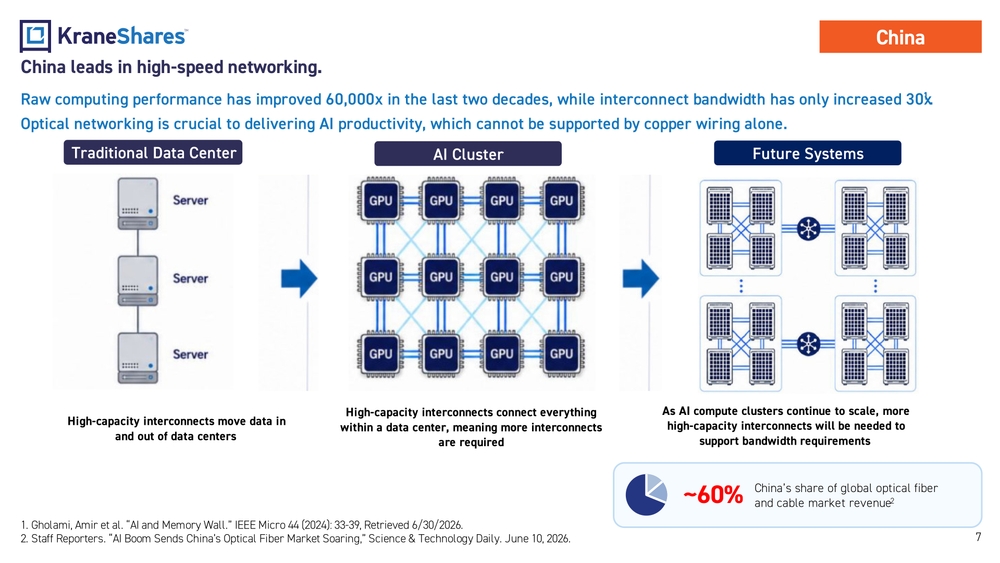
- Gholami, Amir et al. “AI and Memory Wall.” IEEE Micro 44 (2024): 33 -39, Retrieved 6/30/2026.
- Staff Reporters. “AI Boom Sends China’s Optical Fiber Market Soaring,” Science & Technology Daily. June 10, 2026.China leads in high -speed networking. Raw computing performance has improved 60,000x in the last two decades, while interconnect bandwidth has only increased 30x1. Optical networking is crucial to delivering AI productivity, which cannot be supported by copper wiring alone. ~60%China’s share of global optical fiber and cable market revenue2 Traditional Data Center AI Cluster High -capacity interconnects move data in and out of data centersHigh -capacity interconnects connect everything within a data center, meaning more interconnects are required Future Systems As AI compute clusters continue to scale, more high-capacity interconnects will be needed to support bandwidth requirements
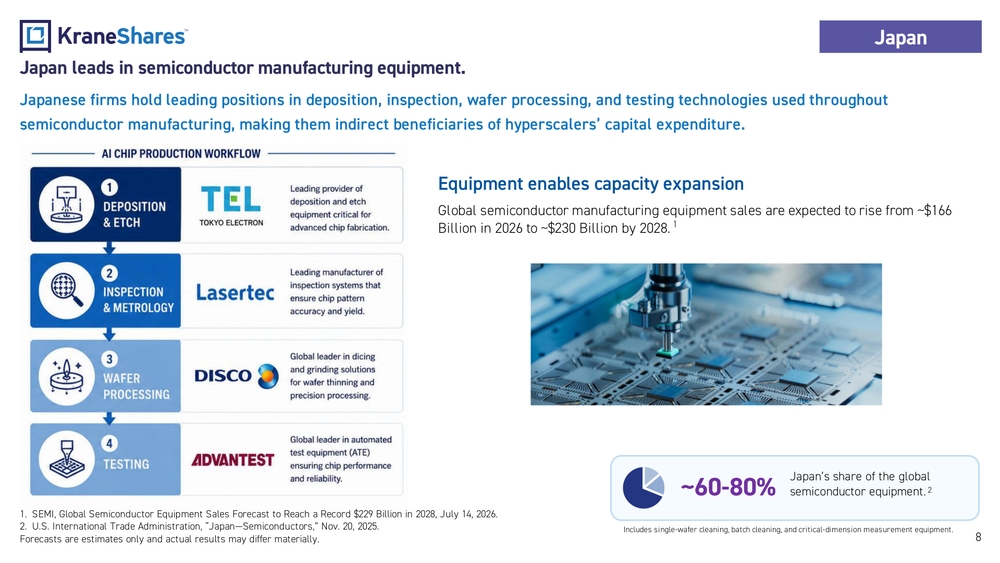
8Japan Equipment enables capacity expansion Global semiconductor manufacturing equipment sales are expected to rise from ~$166 Billion in 2026 to ~$230 Billion by 2028.1 1.SEMI, Global Semiconductor Equipment Sales Forecast to Reach a Record $229 Billion in 2028, July 14, 2026. 2.U.S. International Trade Administration, “Japan —Semiconductors,” Nov. 20, 2025. Forecasts are estimates only and actual results may differ materially.Japan leads in semiconductor manufacturing equipment. Japanese firms hold leading positions in deposition, inspection, wafer processing, and testing technologies used throughout semiconductor manufacturing, making them indirect beneficiaries of hyperscalers’ capital expenditure. ~60-80%Japan’s share of the global semiconductor equipment.2 Includes single -wafer cleaning, batch cleaning, and critical -dimension measurement equipment.
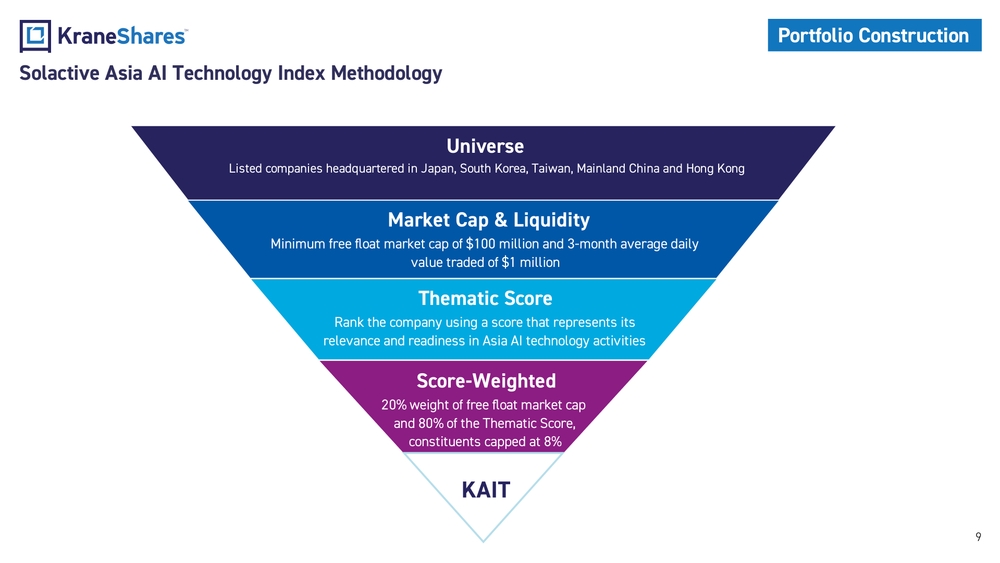
Solactive Asia AI Technology Index Methodology 9Portfolio Construction niverse
Mar et Ca i i it
T e atic Score
Score Weig te
AIT
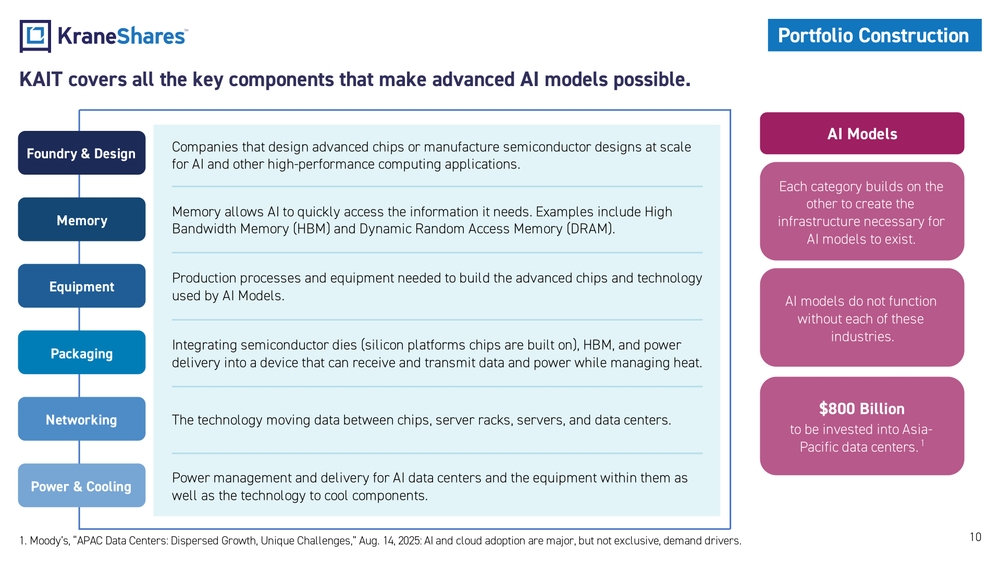
KAIT covers all the key components that make advanced AI models possible. Foundry & Design Memory Equipment Packaging Networking Power & CoolingCompanies that design advanced chips or manufacture semiconductor designs at scale for AI and other high -performance computing applications. Memory allows AI to quickly access the information it needs. Examples include High Bandwidth Memory (HBM) and Dynamic Random Access Memory (DRAM). Production processes and equipment needed to build the advanced chips and technology used by AI Models. Integrating semiconductor dies (silicon platforms chips are built on), HBM, and power delivery into a device that can receive and transmit data and power while managing heat. The technology moving data between chips, server racks, servers, and data centers. Power management and delivery for AI data centers and the equipment within them as well as the technology to cool components.AI Models Each category builds on the other to create the infrastructure necessary for AI models to exist. $800 Billion to be invested into Asia - Pacific data centers.1
- Moody’s, “APAC Data Centers: Dispersed Growth, Unique Challenges,” Aug. 14, 2025: AI and cloud adoption are major, but not exclusive, demand drivers. 10Portfolio Construction AI models do not function without each of these industries.
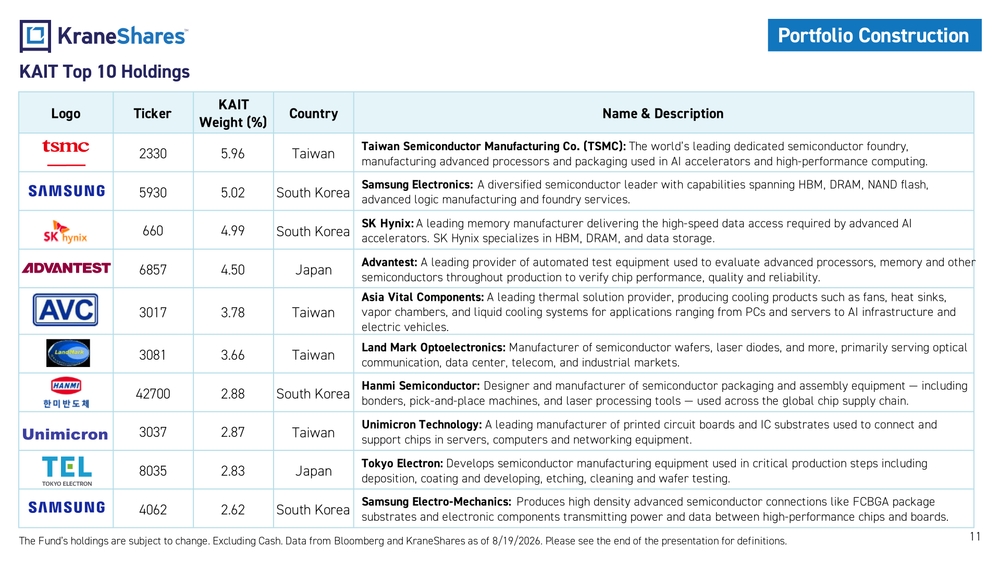
11KAIT Top 10 Holdings The Fund’s holdings are subject to change. Excluding Cash. Data from Bloomberg and KraneShares as of 8/19/2026. Please see th e end of the presentation for definitions.Portfolio Construction Logo TickerKAIT Weight (%)Country Name & Description 2330 5.96 TaiwanTaiwan Semiconductor Manufacturing Co. (TSMC): The world’s leading dedicated semiconductor foundry, manufacturing advanced processors and packaging used in AI accelerators and high -performance computing. 5930 5.02 South KoreaSamsung Electronics: A diversified semiconductor leader with capabilities spanning HBM, DRAM, NAND flash, advanced logic manufacturing and foundry services. 660 4.99 South KoreaSK Hynix: A leading memory manufacturer delivering the high -speed data access required by advanced AI accelerators. SK Hynix specializes in HBM, DRAM, and data storage. 6857 4.50 JapanAdvantest: A leading provider of automated test equipment used to evaluate advanced processors, memory and other semiconductors throughout production to verify chip performance, quality and reliability. 3017 3.78 TaiwanAsia Vital Components: A leading thermal solution provider, producing cooling products such as fans, heat sinks, vapor chambers, and liquid cooling systems for applications ranging from PCs and servers to AI infrastructure and electric vehicles. 3081 3.66 TaiwanLand Mark Optoelectronics: Manufacturer of semiconductor wafers, laser diodes, and more, primarily serving optical communication, data center, telecom, and industrial markets. 42700 2.88 South KoreaHanmi Semiconductor: Designer and manufacturer of semiconductor packaging and assembly equipment — including bonders, pick -and-place machines, and laser processing tools — used across the global chip supply chain. 3037 2.87 TaiwanUnimicron Technology: A leading manufacturer of printed circuit boards and IC substrates used to connect and support chips in servers, computers and networking equipment. 8035 2.83 JapanTokyo Electron: Develops semiconductor manufacturing equipment used in critical production steps including deposition, coating and developing, etching, cleaning and wafer testing. 4062 2.62 South KoreaSamsung Electro -Mechanics: Produces high density advanced semiconductor connections like FCBGA package substrates and electronic components transmitting power and data between high -performance chips and boards.
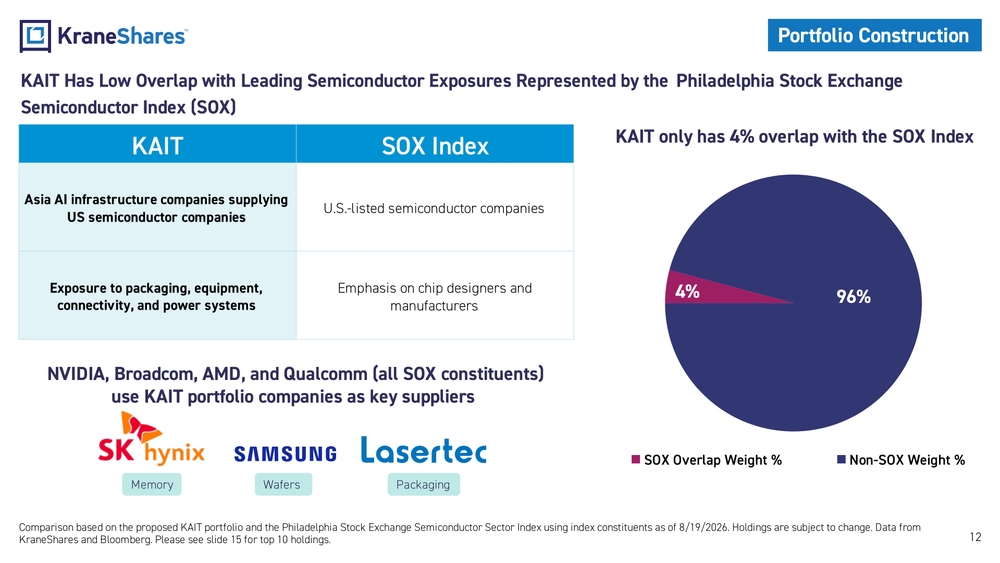
KAIT Has Low Overlap with Leading Semiconductor Exposures Represented by the Philadelphia Stock Exchange Semiconductor Index (SOX) 12Portfolio Construction Comparison based on the proposed KAIT portfolio and the Philadelphia Stock Exchange Semiconductor Sector Index using index co nstituents as of 8/19/2026. Holdings are subject to change. Data from KraneShares and Bloomberg. Please see slide 15 for top 10 holdings.4% 96% SOX Overlap Weight % Non-SOX Weight %KAIT only has 4% overlap with the SOX IndexKAIT SOX Index Asia AI infrastructure companies supplying US semiconductor companiesU.S.-listed semiconductor companies Exposure to packaging, equipment, connectivity, and power systemsEmphasis on chip designers and manufacturers NVIDIA, Broadcom, AMD, and Qualcomm (all SOX constituents) use KAIT portfolio companies as key suppliers Memory Wafers Packaging
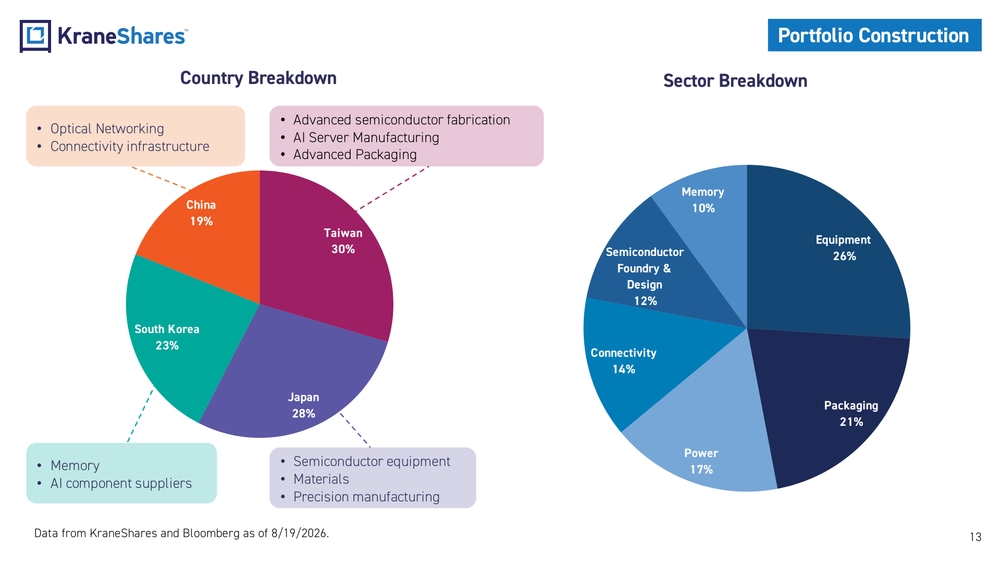
•Advanced semiconductor fabrication •AI Server Manufacturin g •Advanced PackagingPortfolio Construction 13Country Breakdown •Memory •AI component suppliers•Semiconductor equipment •Materials •Precision manufacturing•Optical Networking •Connectivity infrastructure Equipment 26% Packaging 21% Power 17%Connectivity 14%Semiconductor Foundry & Design 12%Memory 10%Sector Breakdown Data from KraneShares and Bloomberg as of 8/19/2026.Taiwan 30% Japan 28%South Korea 23%China 19%
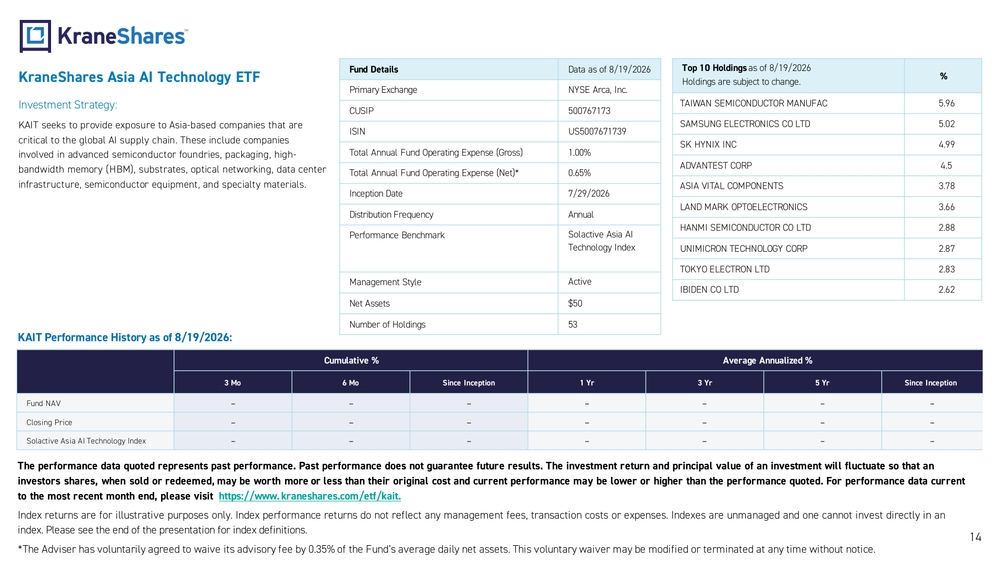
Fund Details Data asof8/19 /2026 Primary Exchange NYSE Arca, Inc. CUSIP 500767173 ISIN US5007671739 Total Annual Fund Operating Expense (Gross) 1.00% Total Annual Fund Operating Expense (Net)* 0.65% Inception Date 7/29/2026 Distribution Frequency Annual Performance Benchmark Solactive Asia AI Technology Index Management Style Active Net Assets $50 Number ofHoldings 53 KAIT Performance History asof8/19 /2026: Cumulative % Average Annualized % 3Mo 6Mo Since Inception 1Yr 3Yr 5Yr Since Inception Fund NAV – – – – – – – Closing Price – – – – – – – Solactive Asia AI Technology Index – – – – – – –KraneShares Asia AI Technology ETF Investment Strategy: KAIT seeks to provide exposure to Asia -based companies that are critical to the global AI supply chain. These include companies involved in advanced semiconductor foundries, packaging, high - bandwidth memory (HBM), substrates, optical networking, data center infrastructure, semiconductor equipment, and specialty materials.Top10Holdings asof8/19/2026 Holdings are subject to change.% TAIWAN SEMICONDUCTOR MANUFAC 5.96 SAMSUNG ELECTRONICS CO LTD 5.02 SK HYNIX INC 4.99 ADVANTEST CORP 4.5 ASIA VITAL COMPONENTS 3.78 LAND MARK OPTOELECTRONICS 3.66 HANMI SEMICONDUCTOR CO LTD 2.88 UNIMICRON TECHNOLOGY CORP 2.87 TOKYO ELECTRON LTD 2.83 IBIDEN CO LTD 2.62 Theperformance data quoted represents past performance. Past performance does notguarantee future results. Theinvestment return andprincipal value ofaninvestment willfluctuate sothat an investors shares, when sold orredeemed, may beworth more orless than their original cost andcurrent performance may belower orhigher than theperformance quoted. Forperformance data current tothemost recent month end, please visit https://www. kraneshares.com/etf/ kait. Index returns areforillustrative purposes only. Index performance returns donotreflect anymanagement fees, transaction costs orexpenses. Indexes areunmanaged andonecannot invest directly inan index. Please see the end of the presentation for index definitions. *The Adviser has voluntarily agreed to waive its advisory fee by 0.35% of the Fund’s average daily net assets. This voluntary waiver may be modified or terminated at any time without notice.14
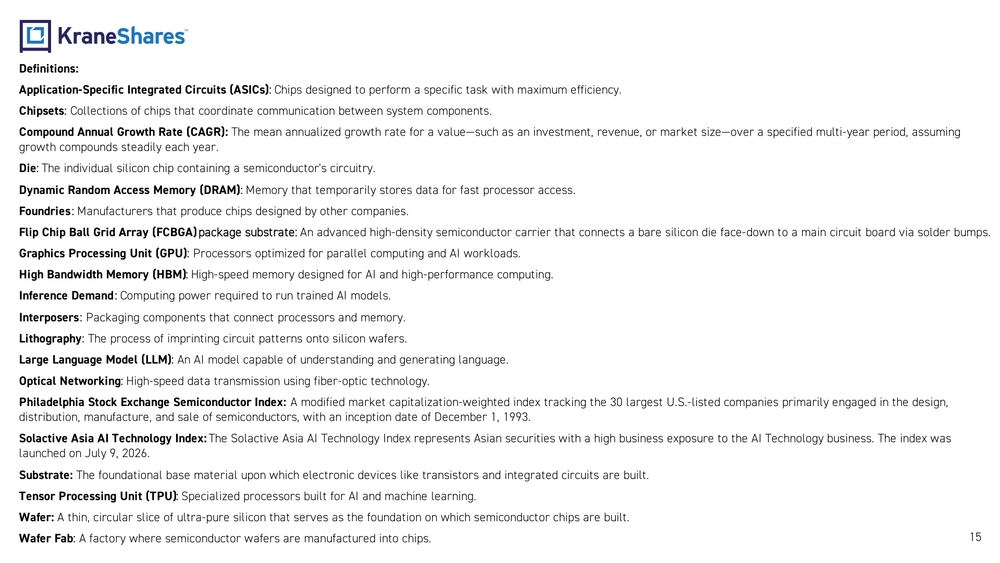
15Definitions: Application -Specific Integrated Circuits (ASICs) : Chips designed to perform a specific task with maximum efficiency. Chipsets : Collections of chips that coordinate communication between system components. Compound Annual Growth Rate (CAGR): The mean annualized growth rate for a value —such as an investment, revenue, or market size —over a specified multi -year period, a ssuming growth compounds steadily each year. Die: The individual silicon chip containing a semiconductor's circuitry. Dynamic Random Access Memory (DRAM) : Memory that temporarily stores data for fast processor access. Foundries : Manufacturers that produce chips designed by other companies. Flip Chip Ball Grid Array (FCBGA) package substrate: An advanced high -density semiconductor carrier that connects a bare silicon die face -down to a main circuit board via solder bu mps. Graphics Processing Unit (GPU) : Processors optimized for parallel computing and AI workloads. High Bandwidth Memory (HBM) : High -speed memory designed for AI and high -performance computing. Inference Demand : Computing power required to run trained AI models. Interposers : Packaging components that connect processors and memory. Lithography : The process of imprinting circuit patterns onto silicon wafers. Large Language Model (LLM) : An AI model capable of understanding and generating language. Optical Networking : High -speed data transmission using fiber -optic technology. Philadelphia Stock Exchange Semiconductor Index: A modified market capitalization -weighted index tracking the 30 largest U.S. -listed companies primarily engaged in the design, distribution, manufacture, and sale of semiconductors, with an inception date of December 1, 1993. Solactive Asia AI Technology Index: The Solactive Asia AI Technology Index represents Asian securities with a high business exposure to the AI Technology business. The index w as launched on July 9, 2026. Substrate: The foundational base material upon which electronic devices like transistors and integrated circuits are built. Tensor Processing Unit (TPU) : Specialized processors built for AI and machine learning. Wafer: A thin, circular slice of ultra -pure silicon that serves as the foundation on which semiconductor chips are built. Wafer Fab : A factory where semiconductor wafers are manufactured into chips.
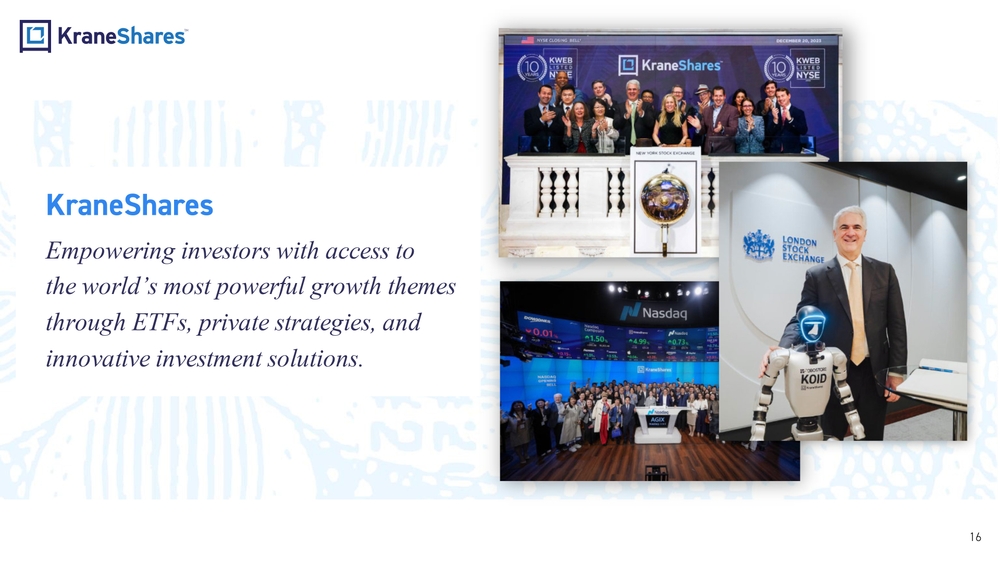
KraneShares Empowering investors with access to the world’ s most powerful growth themes through ETFs, private strategies, and innovative investment solutions. 16
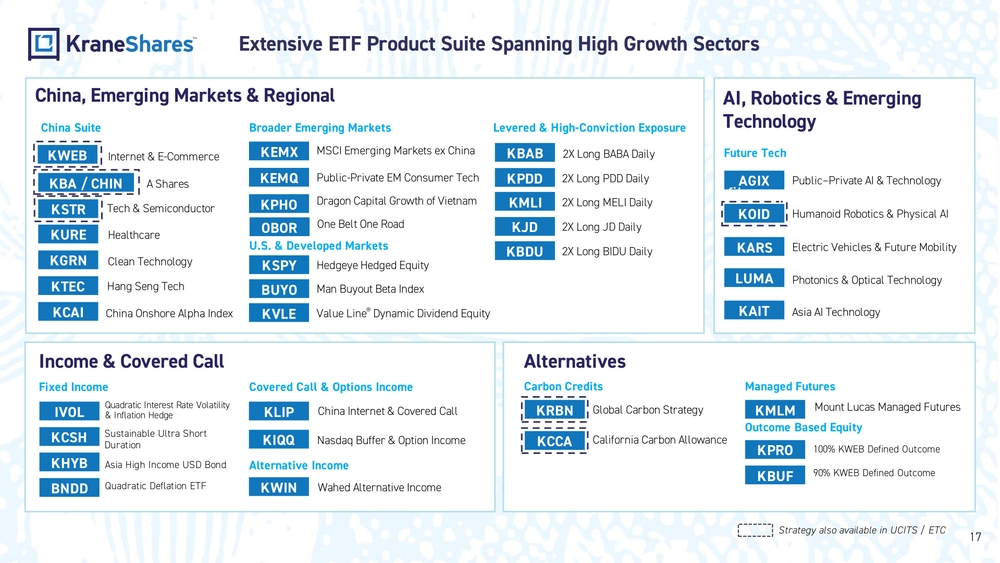
fiber optic network free stock photoChina, Emerging Markets & Regional Alternatives Income & Covered Call AI, Robotics & Emerging Technology KURE Healthcare KGRN Clean TechnologyKSTR Tech & Semiconductor KTEC Hang Seng TechKWEB Internet & E -Commerce A Shares KBA / CHIN KCAI China Onshore Alpha IndexAGIX Public –Private AI & Technology KOID Humanoid Robotics & Physical AI Electric Vehicles & Future Mobility KARSChina Suite Future TechBroader Emerging Markets KEMQ Public -Private EM Consumer Tech KPHODragon Capital Growth of VietnamKEMX MSCI Emerging Markets ex China U.S. & Developed Markets KVLE Value Line® Dynamic Dividend EquityHedgeye Hedged Equity KSPY Man Buyout Beta Index BUYO Fixed Income BNDDQuadratic Deflation ETFIVOLQuadratic Interest Rate Volatility & Inflation Hedge KHYB Asia High Income USD BondSustainable Ultra Short DurationKCSHGlobal Carbon Strategy KRBNCarbon CreditsKPDD 2X Long PDD Daily KJD 2X Long JD DailyKBAB 2X Long BABA Daily KMLI 2X Long MELI Daily Covered Call & Options Income Managed Futures KMLMMount Lucas Managed Futures KWIN Wahed Alternative IncomeKLIP China Internet & Covered Call Outcome Based Equity KIQQ Nasdaq Buffer & Option IncomeLevered & High -Conviction Exposure KBUF90% KWEB Defined Outcome100% KWEB Defined Outcome KPRO Alternative Income KCCA California Carbon AllowanceExtensive ETF Product Suite Spanning High Growth Sectors Strategy also available in UCITS / ETCKBDU 2X Long BIDU Daily 17Photonics & Optical Technology LUMA Asia AI Technology KAITOBOROne Belt One Road
Important Notes: Carefully consider the Funds’ investment objectives, risk factors, charges and expenses before investing. This and additional information can be found in the Funds' full and summary prospectus, which may be obtained by visiting www.kraneshares.com/etf/kait. Read the prospectus carefully before investing. Risk Disclosures: Investing involves risk, including possible loss of principal. There can be no assurance that a Fund will achieve its stated objectives. Indices are unmanaged and do not include the effect of fees. One cannot invest directly in an index. This information should not be relied upon as research, investment advice, or a recommendation regarding any products, strate gies, or any security in particular. This material is strictly for illustrative, educational, or informational purposes and is subject to change. Certain content represents an assessment of the market envir onment at a specific time and is not intended to be a forecast of future events or a guarantee of future results; material is as of the dates noted and is subject to change without notice. The Fund is subject to the political, social or economic instability associated with investing internationally which may caus e a decline in value. Emerging markets involve heightened risk related to the same factors as well as increase volatility and lower trading volume. Fluctuations in currency of foreign countries may have an ad verse effect to domestic currency values. A-Shares are issued by companies in mainland China and traded on local exchanges. They are available to domestic and certain fo reign investors, including QFIs and those participating in Stock Connect Programs like Shanghai -Hong Kong and Shenzhen -Hong Kong. Foreign investments in A -Shares face various regulations and restricti ons, including limits on asset repatriation. A -Shares may experience frequent trading halts and illiquidity, which can lead to volatility in the Fund’s share price and increased trading halt ris ks. The ability of the Fund to achieve its respective investment objectives is dependent, in part, on the continuous availability of A Shares and the ability to obtain, if necessary, additional A Shares q uota. If the Fund is unable to obtain sufficient exposure to limited availability of A Share quota, the Fund could seek exposure to the component securities of the Underlying Index by investment in other types of securities. The Chinese economy is an emerging market, vulnerable to domestic and regional economic and political changes, often showing more volatility than developed markets. Companies face ri sks from potential government interventions, and the export -driven economy is sensitive to downturns in key trading partners, impacting the Fund. U.S. -China tensions raise concerns over tariffs a nd trade restrictions, which could harm China’s exports and the Fund. China's regulatory standards are less stringent than in the U.S., resulting in limited information about issuers. Tax laws ar e unclear and subject to change, potentially impacting the Fund and leading to unexpected liabilities for foreign investors. Fluctuations in currency of foreign countries may have an adverse effect to dom estic currency values. Many Chinese companies raise capital offshore as Variable Interest Entities (VIEs), creating offshore entities —often in the Caym an Islands —that list on foreign exchanges and contract with the VIE to circumvent foreign ownership limits. Investors in these offshore entities, like the Fund, have exposure through contracts without actual ownership of the Chinese company. However, the offshore entity's control is restricted by agreements, which can risk investment value. Moreover, the VIE structure isn't formally recognized in China, ri sking government prohibition or invalidation of contracts. If these contracts become unenforceable, investors may incur losses with little recourse, and non -compliance with regulations could result in penalties fo r Chinese issuers. The Fund may invest in derivatives, which are often more volatile than other investments and may magnify the Fund’s gains or losses. A derivative (i.e., futures/forward contracts, swaps, and options) is a contract that derives its value from the performance of an underlying asset. The primary risk of derivatives is that changes in the asset’s market value and the derivative may not be proportionate, and some derivatives can have the potential for unlimited losses. Derivatives are also subject to liquidity and counterparty risk. The Fund is subject to liquidity risk, meaning that certain investments may become difficult to purchase or sell at a reasonable time and price. If a transaction for these securities is large, it may not be possible to initiate, which may cause the Fund to suffer losses. Counterparty risk is the risk of loss in the event that the counterparty to an agreement fails to make required payments or otherwise comply with the terms of the der ivative.18
Risk disclosures continued: AI-exposed companies face profitability challenges due to high research costs, competition, IP reliance, and regulatory risk. Pr oduct failures or safety concerns could be detrimental. Identifying AI companies accurately is complex. Tech firms face risks of product failure, obsolescence, regulatory impact, and uncertain profitability due to technological advancements and government policies. Certain tech investments may lack current profitability and future success is uncertain. The Fund is subject to non -U.S. issuers risk, which may be less liquid than investments in U.S. issuers, may have less governmental regulation and oversight, are typically subject to different investor protection standards than U.S. issuers, and the economic instability o f the non -U.S. countries. Fluctuations in currency of foreign countries may have an adverse effect to domestic currency values. The Fund may invest in Initial Public Offerings (IPOs). Securities issued in IPOs have no trading history, and information about the companies may be available for very limited periods. In addition, the prices of securities sold in IPOs may be highly volatile. In addition, as the Fund inc reases in size, the impact of IPOs on the Fund’s performance will generally decrease. Large capitalization companies may struggle to adapt fast, impacting their growth compared to smaller firms, especially in ex pansive times. This could result in lower stock returns than investing in smaller and mid-sized companies. In addition to the normal risks associated with investing, investments in smaller companies typically exhib it higher volatility. The Fund is new and does not yet have a significant number of shares outstanding. If the Fund does not grow in size, it will be at greater risk than larger funds of wider bid - ask spreads fo r its shares, trading at a greater premium or discount to NAV, liquidation and/or a trading halt. Narrowly focused investments typically exhibit higher volatility. The Fund’s assets are expected to be concentr ated in a sector, industry, market, or group of concentrations to the extent that the Underlying Index has such concentrations. The securities or futures in that concentration could react similarly to market dev elopments. Thus, the Fund is subject to loss due to adverse occurrences that affect that concentration. Investing in the securities of small and medium capitalization companies involves greater risk and the possibility of greater price volatility than investing in larger capitalization companies. The Fund may invest in privately -issued and private company securities, which are generally not registered, may carry resale res trictions, and often lack active markets. These investments can be less liquid, harder to value, and subject to larger price swings, which may result in delays or higher costs when buying or selling. Priva te companies may have limited operating histories, smaller or less established businesses, fewer financial resources, and less available information. They may be more vulnerable to competition, market con ditions, or economic downturns. A liquid market for their securities may never develop, and IPOs, if they occur, can be volatile and may negatively affect the Fund’s investment. A large number of shares of the Fund are held by a single shareholder or a small group of shareholders. Redemptions from thes e shareholders can harm Fund performance, especially in declining markets, leading to forced sales at disadvantageous prices, increased costs, and adverse tax effects for remaining shareholders. KAIT is non-diversified. ETF shares are bought and sold on an exchange at market price (not NAV) and are not individually redeemed from the Fund. Howe ver, shares may be redeemed at NAV directly by certain authorized broker - dealers (Authorized Participants) in very large creation/redemption units. The returns shown do not represent the returns you would receive if you traded shares at other times. Shares may trade at a premium or discount to their NAV in the secondary market. Brokerage commissions will reduce returns. Beginning 12/23/2020, market pri ce returns are based on the official closing price of an ETF share or, if the official closing price isn't available, the midpoint between the national best bid and national best offer ("NBBO") as of the time the ETF calculates the current NAV per share. Prior to that date, market price returns were based on the midpoint between the Bid and Ask price. NAVs are calculated using prices as of 4:00 PM Eastern Time. The KraneShares ETFs and KFA Funds ETFs are distributed by SEI Investments Distribution Company (SIDCO), 1 Freedom Valley Drive, Oaks, PA 194 56, which is not affiliated with Krane Funds Advisors, LLC, the Investment Adviser for the Funds, or any sub -advisers for the Funds. 19