China ETF Overview: KWEB | KraneShares China Internet ETF
by Kraneshares
KWEB 9/30/2026 The China Consumer E-Commerce Opportunity An Overview of the KraneShares CSI China Internet ETF (Ticker: KWEB ) info@kraneshares.com
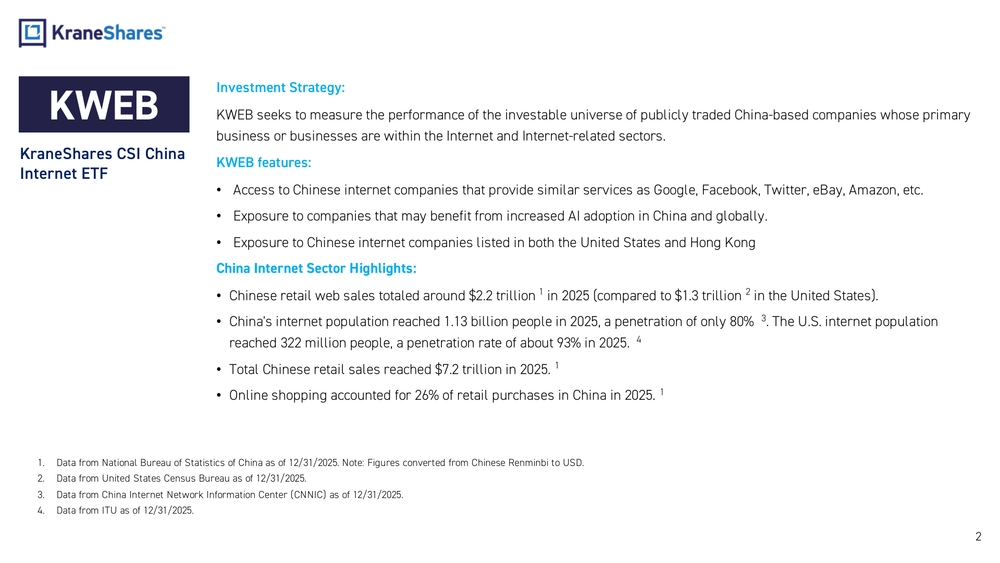
2Investment Strategy: KWEB seeks to measure the performance of the investable universe of publicly traded China -based companies whose primary business or businesses are within the Internet and Internet -related sectors. KWEB features: •Access to Chinese internet companies that provide similar services as Google, Facebook, Twitter, eBay, Amazon, etc. •Exposure to companies that may benefit from increased AI adoption in China and globally. •Exposure to Chinese internet companies listed in both the United States and Hong Kong China Internet Sector Highlights: •Chinese retail web sales totaled around $2.2 trillion1 in 2025 (compared to $1.3 trillion2 in the United States). •China's internet population reached 1.13 billion people in 2025, a penetration of only 80%3. The U.S. internet population reached 322 million people, a penetration rate of about 93% in 2025.4 •Total Chinese retail sales reached $7.2 trillion in 2025 .1 •Online shopping accounted for 26% of retail purchases in China in 2025 .1KWEB KraneShares CSI China Internet ETF 1.Data from National Bureau of Statistics of China as of 12/31/2025. Note: Figures converted from Chinese Renminbi to USD. 2.Data from United States Census Bureau as of 12/31/2025. 3.Data from China Internet Network Information Center (CNNIC) as of 12/31/2025. 4.Data from ITU as of 12/31/2025.
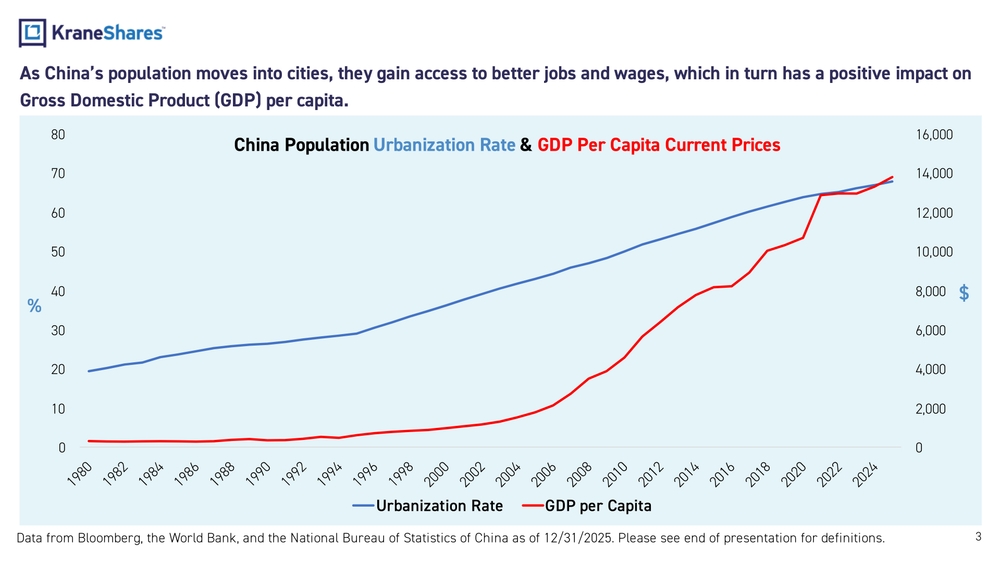
02,0004,0006,0008,00010,00012,00014,00016,000 01020304050607080 Urbanization Rate GDP per Capita 3As China’s population moves into cities, they gain access to better jobs and wages, which in turn has a positive impact on Gross Domestic Product (GDP) per capita. %China Population Urbanization Rate & GDP Per Capita Current Prices Data from Bloomberg, the World Bank, and the National Bureau of Statistics of China as of 12/31/2025. Please see end of prese ntation for definitions. $
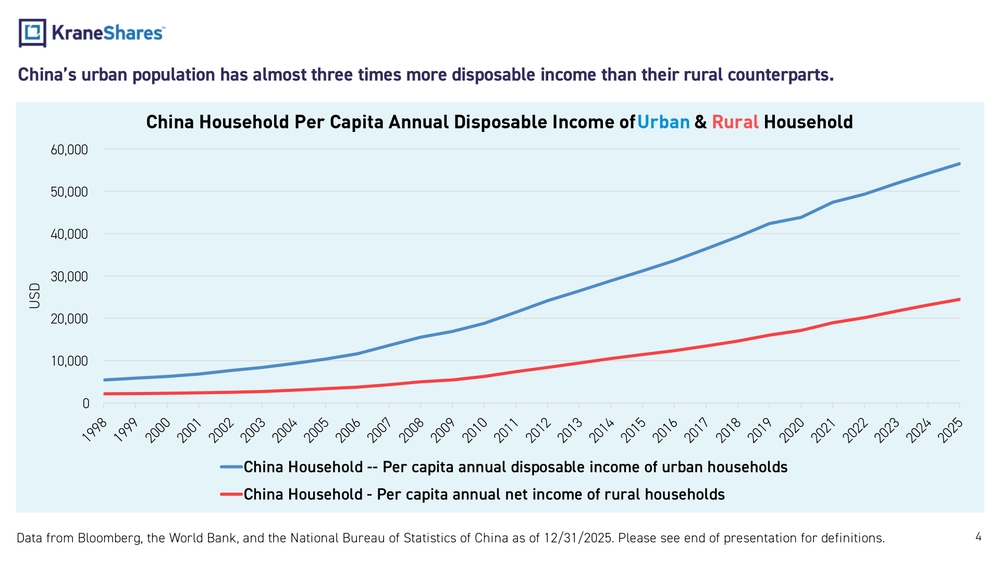
4China’s urban population has almost three times more disposable income than their rural counterparts. Data from Bloomberg, the World Bank, and the National Bureau of Statistics of China as of 12/31/2025. Please see end of prese ntation for definitions. 010,00020,00030,00040,00050,00060,000USDChina Household Per Capita Annual Disposable Income of Urban & Rural Household China Household -- Per capita annual disposable income of urban households China Household - Per capita annual net income of rural households
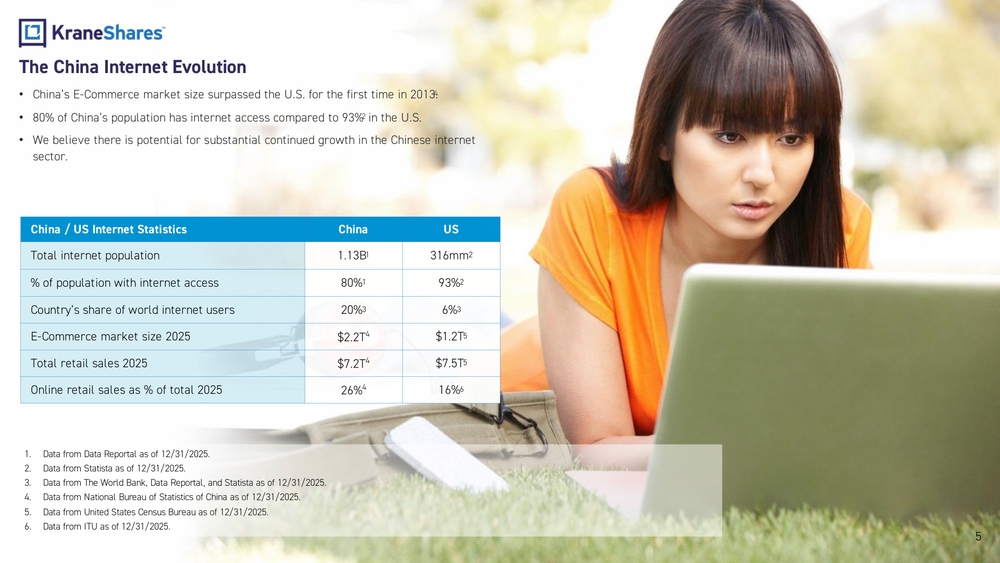
5The China Internet Evolution •China’s E -Commerce market size surpassed the U.S. for the first time in 2013.4 •80% of China’s population has internet access compared to 93%2 in the U.S. •We believe there is potential for substantial continued growth in the Chinese internet sector. China / US Internet Statistics China US Total internet population 1.13B1 316mm2 % of population with internet access 80%1 93%2 Country’s share of world internet users 20%3 6%3 E-Commerce market size 2025 $2.2T4$1.2T5 Total retail sales 2025 $7.2T4$7.5T5 Online retail sales as % of total 2025 26%416%6
- Data from Data Reportal as of 12/31/2025.
- Data from Statista as of 12/31/2025.
- Data from The World Bank, Data Reportal, and Statista as of 12/31/2025.
- Data from National Bureau of Statistics of China as of 12/31/2025.
- Data from United States Census Bureau as of 12/31/2025.
- Data from ITU as of 12/31/2025.
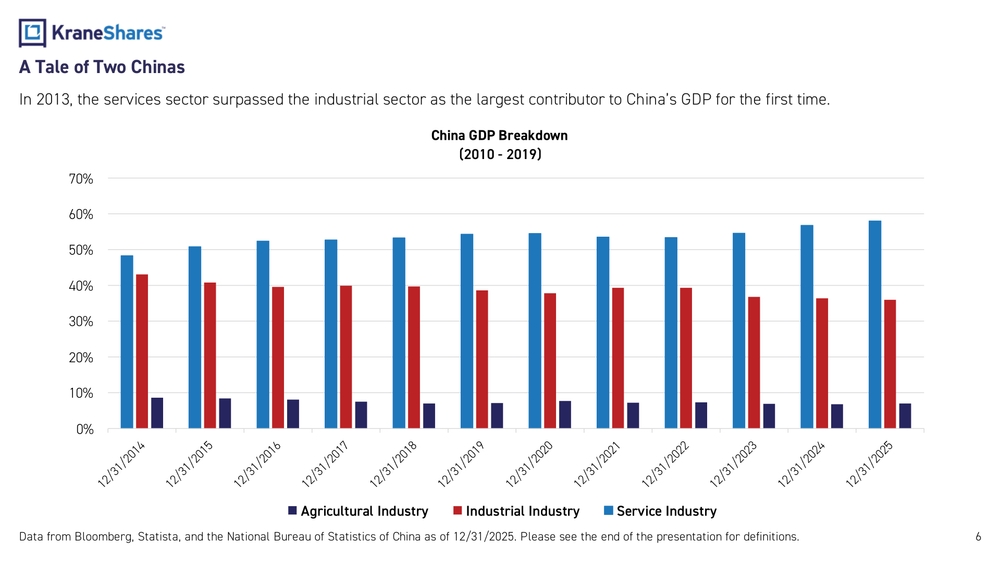
6A Tale of Two Chinas In 2013, the services sector surpassed the industrial sector as the largest contributor to China’s GDP for the first time. Data from Bloomberg, Statista, and the National Bureau of Statistics of China as of 12/31/2025. Please see the end of the pre sentation for definitions. 0%10%20%30%40%50%60%70%China GDP Breakdown (2010 - 2019) Agricultural Industry Industrial Industry Service Industry
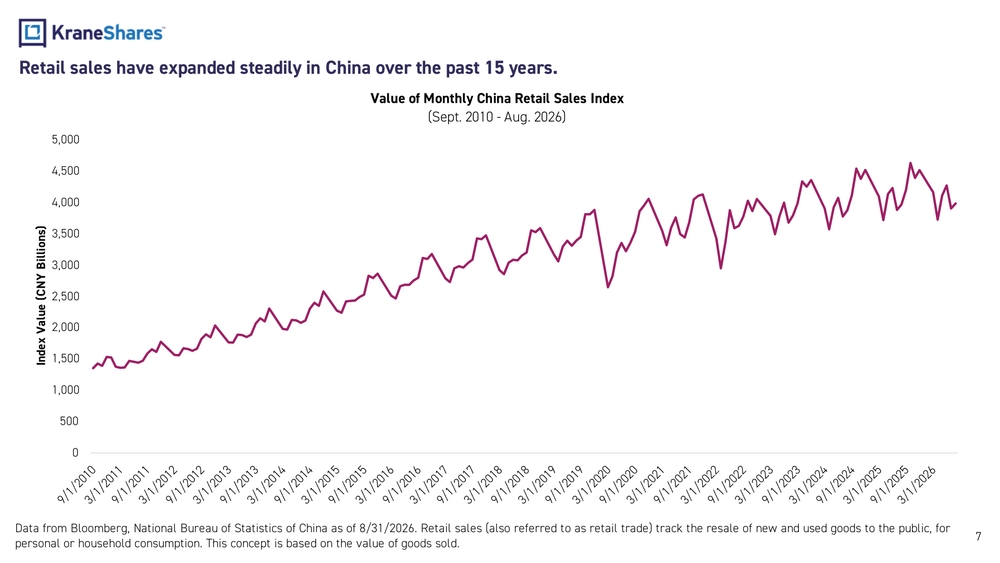
7Retail sales have expanded steadily in China over the past 15 years. Data from Bloomberg, National Bureau of Statistics of China as of 8/31/2026 . Retail sales (also referred to as retail trade) track the resale of new and used goods to the public, for personal or household consumption. This concept is based on the value of goods sold.05001,0001,5002,0002,5003,0003,5004,0004,5005,000Index Value (CNY Billions)Value of Monthly China Retail Sales Index (Sept. 2010 - Aug. 2026)
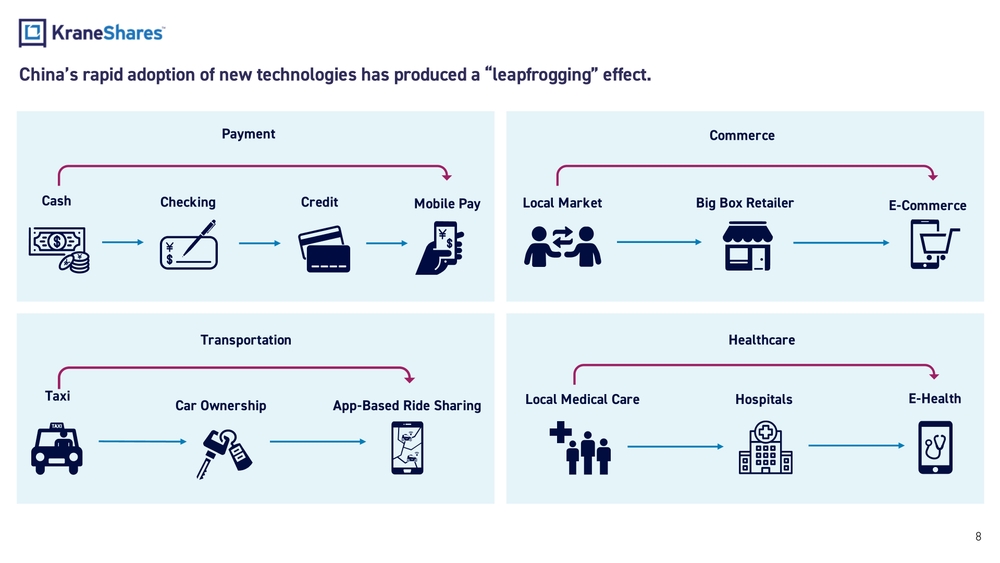
China’s rapid adoption of new technologies has produced a “leapfrogging” effect. Taxi Car Ownership App-Based Ride Sharing Local Market Local Medical Care Hospitals E-Health Big Box Retailer E-Commerce Cash Checking Credit Mobile PayPayment TransportationCommerce Healthcare 8
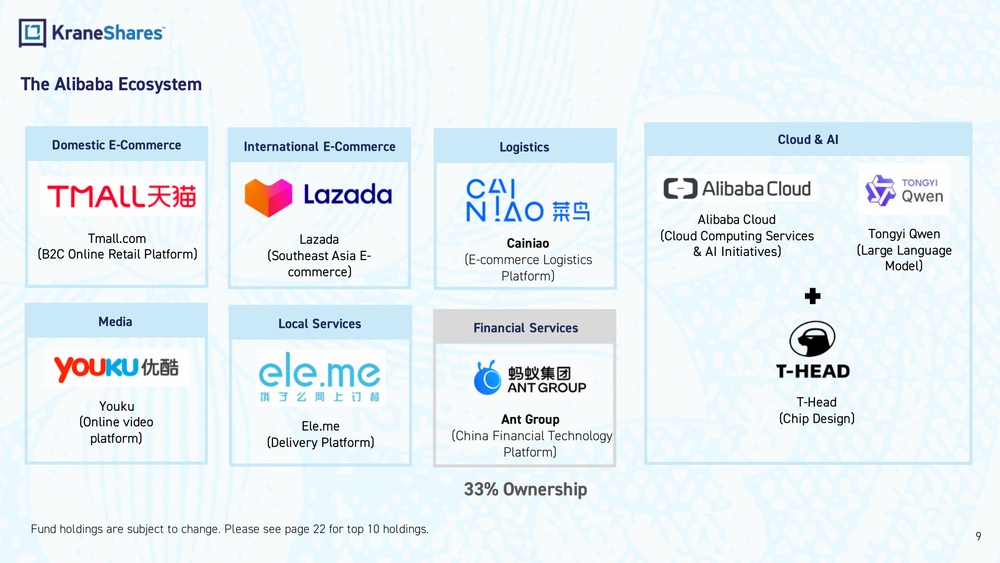
Lazada (Southeast Asia E - commerce) Tmall.com (B2C Online Retail Platform) Alibaba Cloud (Cloud Computing Services & AI Initiatives) Cainiao (E-commerce Logistics Platform)International E -Commerce 9 The Alibaba Ecosystem Local ServicesDomestic E -CommerceCloud & AI MediaLogistics Ele.me (Delivery Platform)Youku (Online video platform)Ant Group (China Financial Technology Platform)Financial Services 33% Ownership Tongyi Qwen (Large Language Model) Fund holdings are subject to change. Please see page 22 for top 10 holdings. T-Head (Chip Design)
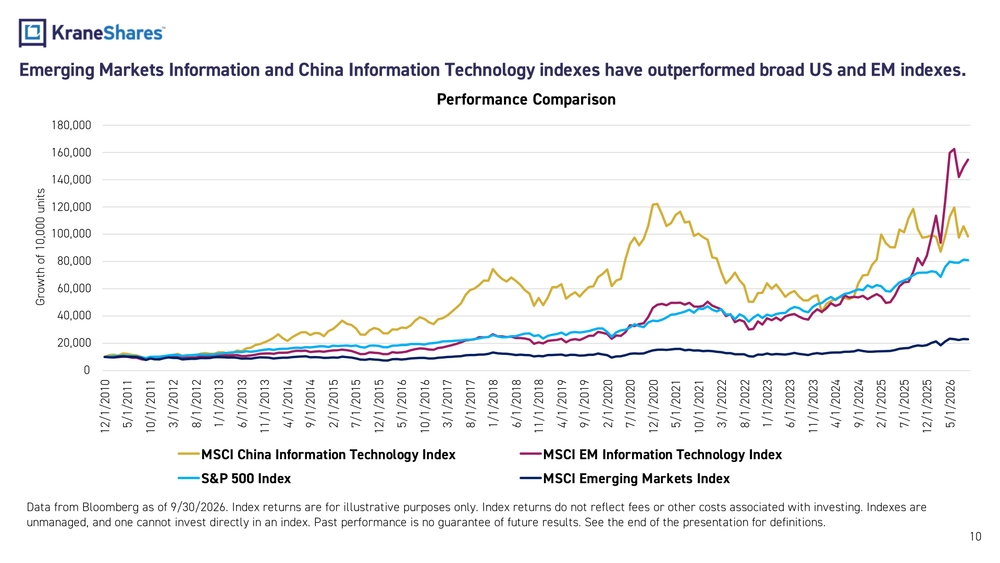
Emerging Markets Information and China Information Technology indexes have outperformed broad US and EM indexes. Data from Bloomberg as of 9/30/2026. Index returns are for illustrative purposes only. Index returns do not reflect fees or o ther costs associated with investing. Indexes are unmanaged, and one cannot invest directly in an index. Past performance is no guarantee of future results. See the end of the presentation for definitions. 10020,00040,00060,00080,000100,000120,000140,000160,000180,000 12/1/2010 5/1/2011 10/1/2011 3/1/2012 8/1/2012 1/1/2013 6/1/2013 11/1/2013 4/1/2014 9/1/2014 2/1/2015 7/1/2015 12/1/2015 5/1/2016 10/1/2016 3/1/2017 8/1/2017 1/1/2018 6/1/2018 11/1/2018 4/1/2019 9/1/2019 2/1/2020 7/1/2020 12/1/2020 5/1/2021 10/1/2021 3/1/2022 8/1/2022 1/1/2023 6/1/2023 11/1/2023 4/1/2024 9/1/2024 2/1/2025 7/1/2025 12/1/2025 5/1/2026Growth of 10,000 unitsPerformance Comparison MSCI China Information Technology Index MSCI EM Information Technology Index S&P 500 Index MSCI Emerging Markets Index
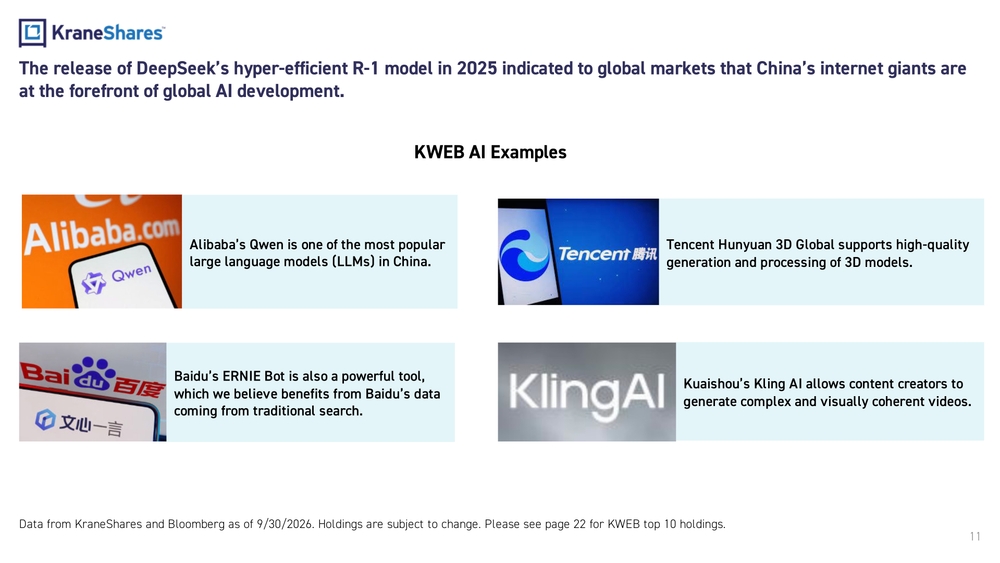
11The release of DeepSeek’s hyper -efficient R -1 model in 2025 indicated to global markets that China’s internet giants are at the forefront of global AI development. Data from KraneShares and Bloomberg as of 9/30/2026. Holdings are subject to change. Please see page 22 for KWEB top 10 holdi ngs.KWEB AI Examples Kuaishou’s Kling AI allows content creators to generate complex and visually coherent videos. Tencent Hunyuan 3D Global supports high -quality generation and processing of 3D models. Alibaba’s Qwen is one of the most popular large language models (LLMs) in China. Baidu’s ERNIE Bot is also a powerful tool, which we believe benefits from Baidu’s data coming from traditional search.
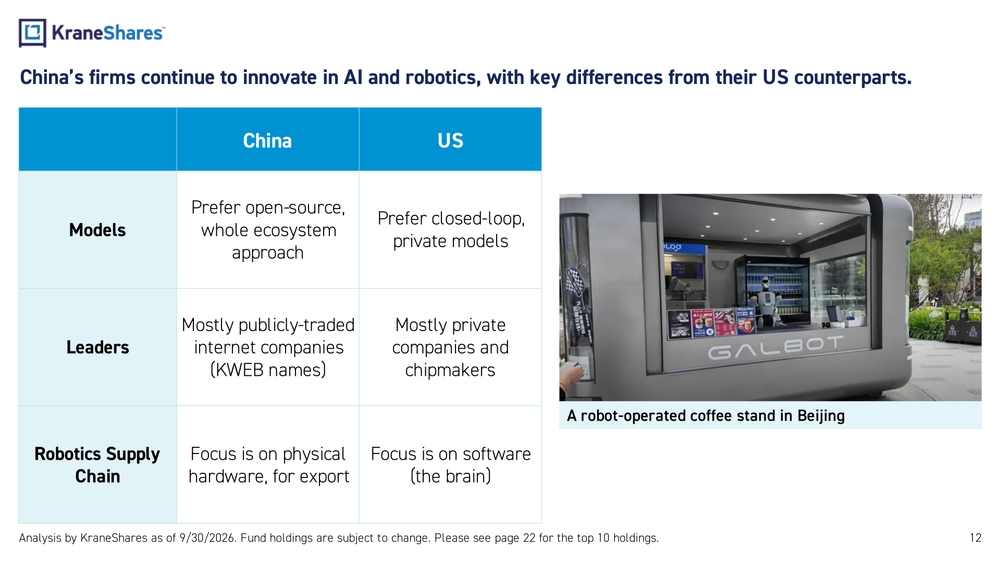
12China’s firms continue to innovate in AI and robotics, with key differences from their US counterparts. China US ModelsPrefer open -source, whole ecosystem approachPrefer closed -loop, private models LeadersMostly publicly -traded internet companies (KWEB names)Mostly private companies and chipmakers Robotics Supply ChainFocus is on physical hardware, for exportFocus is on software (the brain) A robot -operated coffee stand in Beijing Analysis by KraneShares as of 9/30/2026. Fund holdings are subject to change. Please see page 22 for the top 10 holdings.
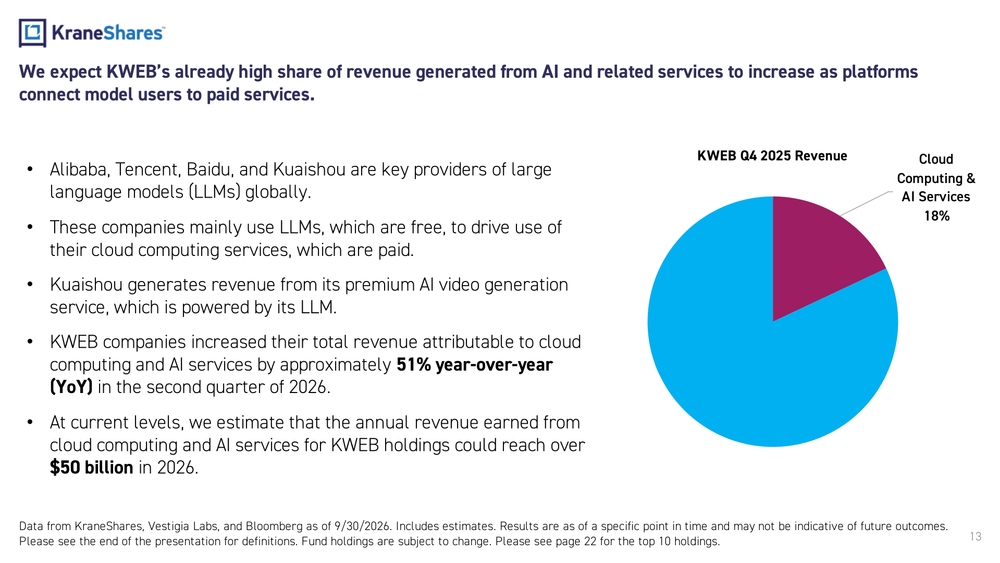
13We expect KWEB’s already high share of revenue generated from AI and related services to increase as platforms connect model users to paid services. Cloud Computing & AI Services 18%KWEB Q4 2025 Revenue •Alibaba, Tencent, Baidu, and Kuaishou are key providers of large language models (LLMs) globally. •These companies mainly use LLMs, which are free, to drive use of their cloud computing services, which are paid. •Kuaishou generates revenue from its premium AI video generation service, which is powered by its LLM. •KWEB companies increased their total revenue attributable to cloud computing and AI services by approximately 51% year -over -year (YoY) in the second quarter of 2026. •At current levels, we estimate that the annual revenue earned from cloud computing and AI services for KWEB holdings could reach over $50 billion in 2026. Data from KraneShares, Vestigia Labs, and Bloomberg as of 9/30/2026. Includes estimates. Results are as of a specific point i n time and may not be indicative of future outcomes. Please see the end of the presentation for definitions. Fund holdings are subject to change. Please see page 22 for the top 1 0 holdings.
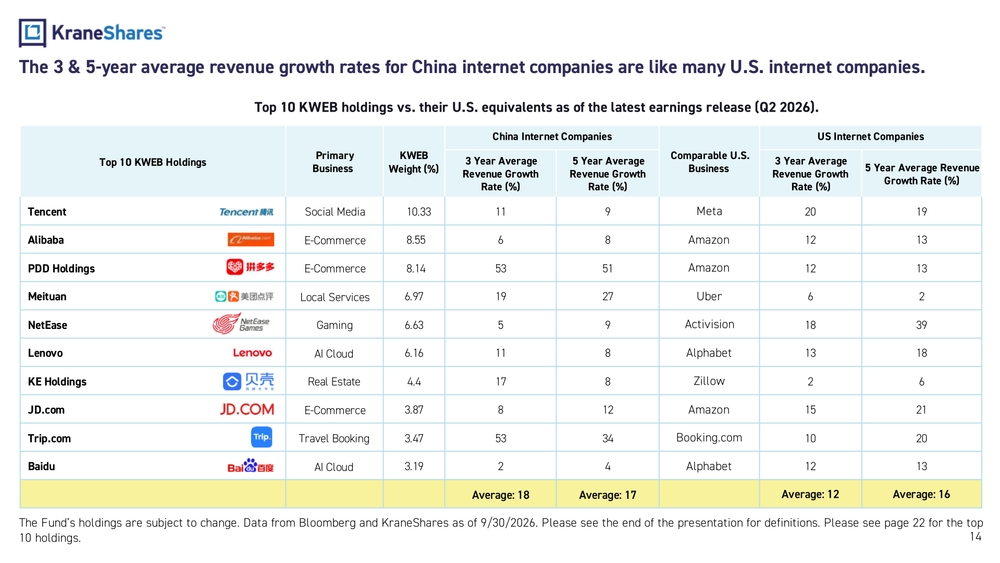
Top 10 KWEB HoldingsPrimary BusinessKWEB Weight (%)China Internet Companies Comparable U.S. BusinessUS Internet Companies 3 Year Average Revenue Growth Rate (%)5 Year Average Revenue Growth Rate (%)3 Year Average Revenue Growth Rate (%)5 Year Average Revenue Growth Rate (%) Tencent Social Media 10.33 11 9 Meta 20 19 Alibaba E-Commerce 8.55 6 8 Amazon 12 13 PDD Holdings E-Commerce 8.14 53 51 Amazon 12 13 Meituan Local Services 6.97 19 27 Uber 6 2 NetEase Gaming 6.63 5 9 Activision 18 39 Lenovo AI Cloud 6.16 11 8 Alphabet 13 18 KE Holdings Real Estate 4.4 17 8 Zillow 2 6 JD.com E-Commerce 3.87 8 12 Amazon 15 21 Trip.com Travel Booking 3.47 53 34 Booking.com 10 20 Baidu AI Cloud 3.19 2 4 Alphabet 12 13 Average: 18 Average: 17 Average: 12 Average: 16 Top 10 KWEB holdings vs. their U.S. equivalents as of the latest earnings release (Q2 2026). The Fund’s holdings are subject to change. Data from Bloomberg and KraneShares as of 9/30/2026. Please see the end of the pre sentation for definitions. Please see page 22 for the top 10 holdings. 14 The 3 & 5 -year average revenue growth rates for China internet companies are like many U.S. internet companies.
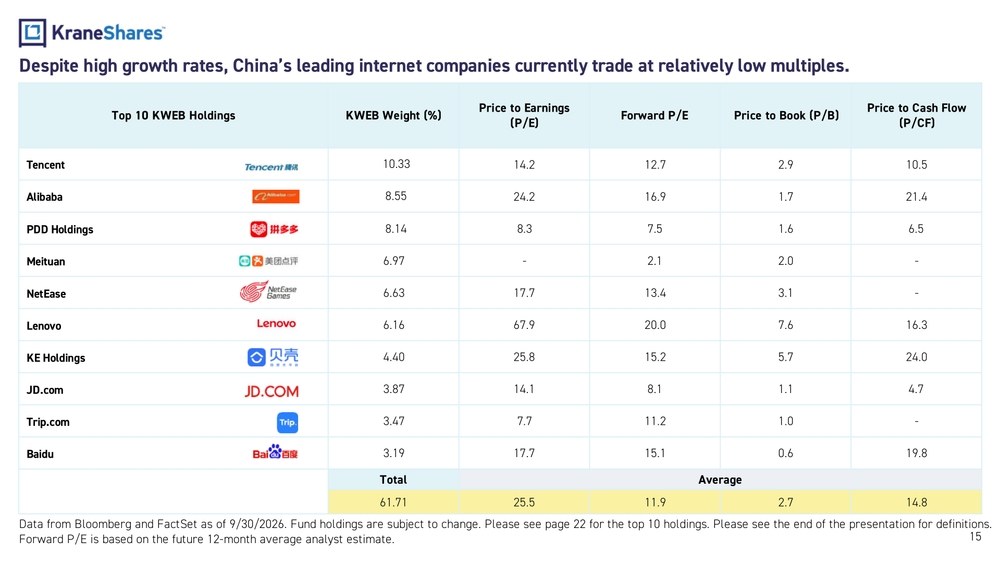
Top 10 KWEB Holdings KWEB Weight (%)Price to Earnings (P/E)Forward P/E Price to Book (P/B)Price to Cash Flow (P/CF) Tencent 10.33 14.2 12.7 2.9 10.5 Alibaba 8.55 24.2 16.9 1.7 21.4 PDD Holdings 8.14 8.3 7.5 1.6 6.5 Meituan 6.97 - 2.1 2.0 - NetEase 6.63 17.7 13.4 3.1 - Lenovo 6.16 67.9 20.0 7.6 16.3 KE Holdings 4.40 25.8 15.2 5.7 24.0 JD.com 3.87 14.1 8.1 1.1 4.7 Trip.com 3.47 7.7 11.2 1.0 - Baidu 3.19 17.7 15.1 0.6 19.8 Total Average 61.71 25.5 11.9 2.7 14.8 15Despite high growth rates, China’s leading internet companies currently trade at relatively low multiples. Data from Bloomberg and FactSet as of 9/30/2026. Fund holdings are subject to change. Please see page 22 for the top 10 holdi ngs. Please see the end of the presentation for definitions. Forward P/E is based on the future 12 -month average analyst estimate.
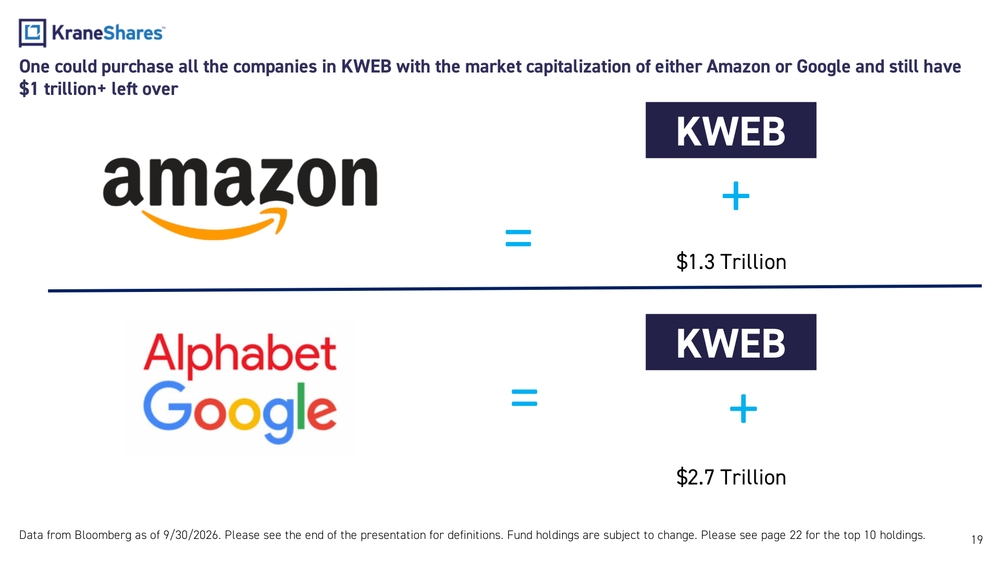
Data from Bloomberg and KraneShares as of 6/30/2026. Past performance does not guarantee future results. KWEB price used is N YSE closing price (USD) on the last trading day of each quarter, not NAV. Fund holdings are subject to change. Please see page 22 for the top 10 holdings. Please see the end of the presentation for definitions. KWEB’s top 10 holdings are profitable, as a whole, and remain undervalued compared to their US counterparts. 25.1x Dow Jones US Internet Composite Index13.5x CSI Overseas China Internet IndexPrice to Earnings (P/E) Ratio* *Data from FactSet as of 9/30/2026.0102030405060708090 -20020406080100120140160180200 12/31/2019 3/31/2020 6/30/2020 9/30/2020 12/31/2020 3/31/2021 6/30/2021 9/30/2021 12/31/2021 3/31/2022 6/30/2022 9/30/2022 12/30/2022 3/31/2023 6/30/2023 9/30/2023 12/31/2023 3/31/2024 6/30/2024 9/30/2024 12/31/2024 3/31/2025 6/30/2025 9/30/2025 12/31/2025 3/31/2026 6/30/2026 $$ BillionsKWEB Price vs. Top 10 Revenue & Net Income (Quarterly) KWEB Top 10 Revenue KWEB Top 10 Net Income KWEB Price (Right Axis) 16
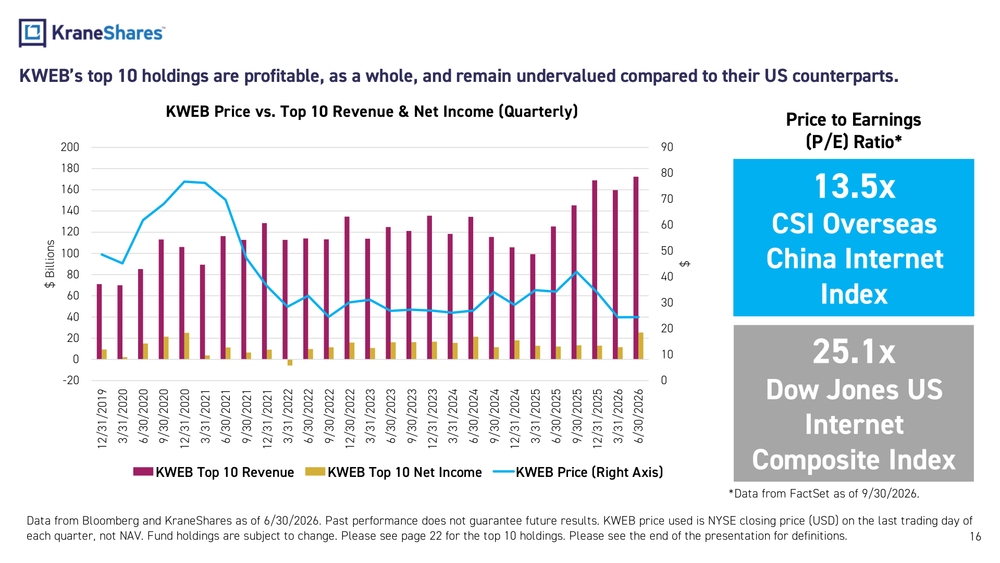
KWEB’s holdings have a combined $146 billion worth of cash on their balance sheets, more than Amazon and Alphabet combined. $146 Billion $87 Billion$31 BillionKWEB Data from Bloomberg as of 9/30/2026. Fund holdings are subject to change. Please see page 22 for the top ten holdings.17
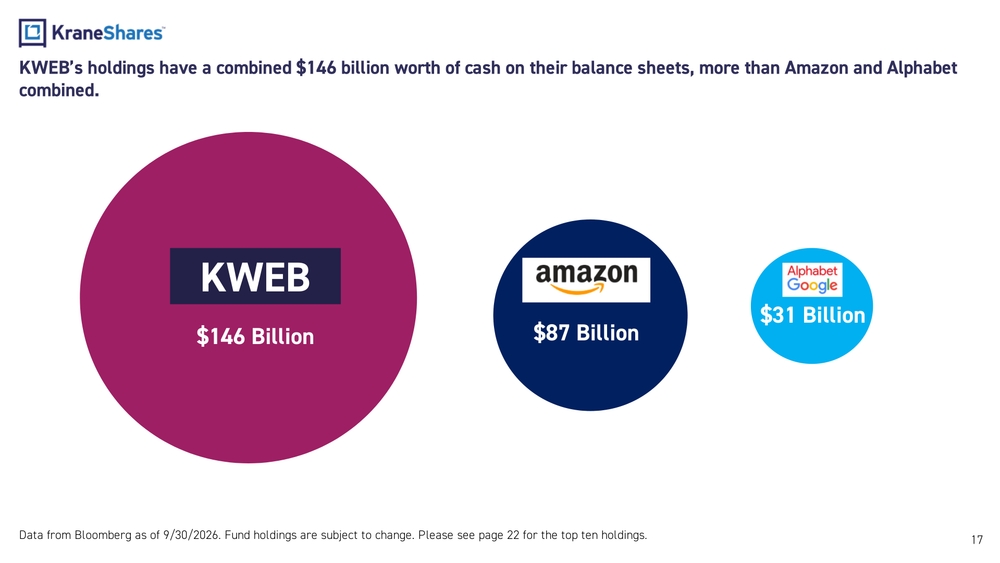
Data from Bloomberg as of 12/31/2025. Fund holdings are subject to change. Please see page 22 for top 10 holdings. Please see the end of the presentation for definitions. Historically, Alibaba has outperformed Amazon in terms of revenue growth and profit margins. 180%10%20%30%40%50%60%70%80% 2013 2014 2015 2016 2017 2018 2019 2020 2021 2022 2023 2024 2025YoY Revenue Growth Alibaba Amazon-5%0%5%10%15%20%25%30%35%40%45%50% 2013 2014 2015 2016 2017 2018 2019 2020 2021 2022 2023 2024 2025Profit Margins Alibaba Amazon
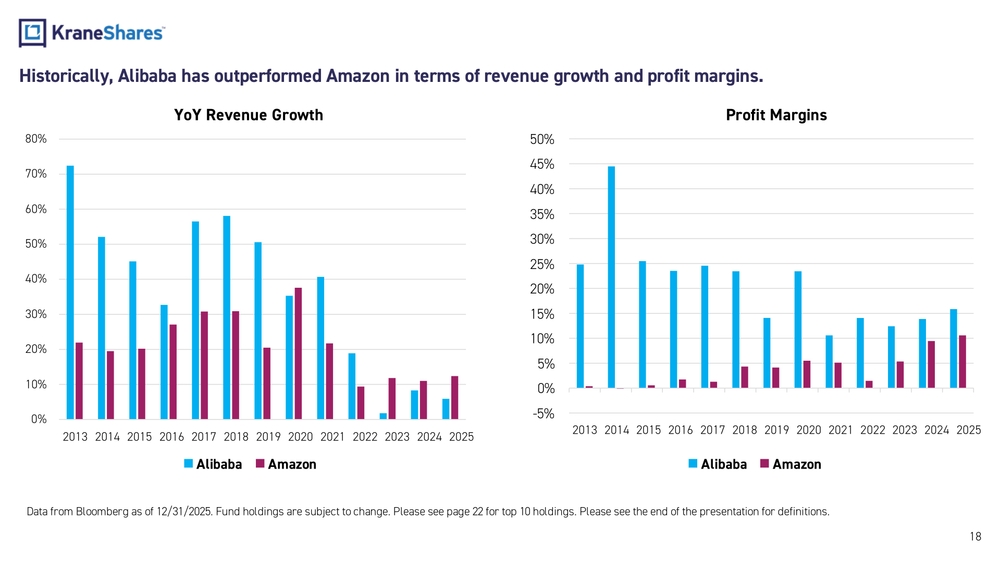
One could purchase all the companies in KWEB with the market capitalization of either Amazon or Google and still have $1 trillion+ left over =KWEB + $1.3 Trillion Data from Bloomberg as of 9/30/2026. Please see the end of the presentation for definitions. Fund holdings are subject to cha nge. Please see page 22 for the top 10 holdings.KWEB + $2.7 Trillion
19
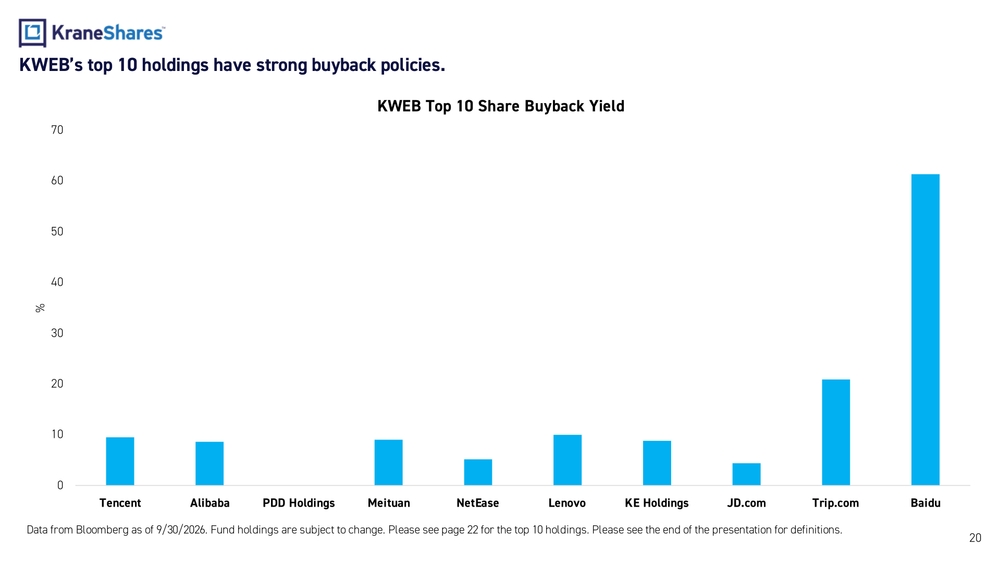
20KWEB’s top 10 holdings have strong buyback policies. Data from Bloomberg as of 9/30/2026. Fund holdings are subject to change. Please see page 22 for the top 10 holdings. Please see the end of the presentation for definitions.010203040506070 Tencent Alibaba PDD Holdings Meituan NetEase Lenovo KE Holdings JD.com Trip.com Baidu%KWEB Top 10 Share Buyback Yield
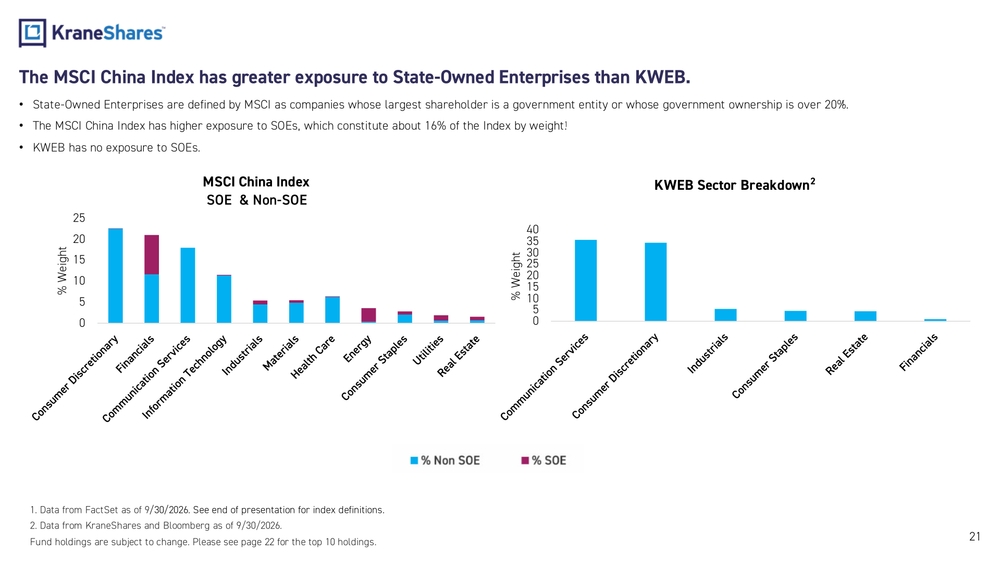
21The MSCI China Index has greater exposure to State -Owned Enterprises than KWEB. •State -Owned Enterprises are defined by MSCI as companies whose largest shareholder is a government entity or whose government ow nership is over 20%.1 •The MSCI China Index has higher exposure to SOEs, which constitute about 16% of the Index by weight.1 •KWEB has no exposure to SOEs.
- Data from FactSet as of 9/30/2026. See end of presentation for index definitions.
- Data from KraneShares and Bloomberg as of 9/30/2026. Fund holdings are subject to change. Please see page 22 for the top 10 holdings.0510152025303540% WeightKWEB Sector Breakdown2 0510152025% WeightMSCI China Index SOE & Non -SOE
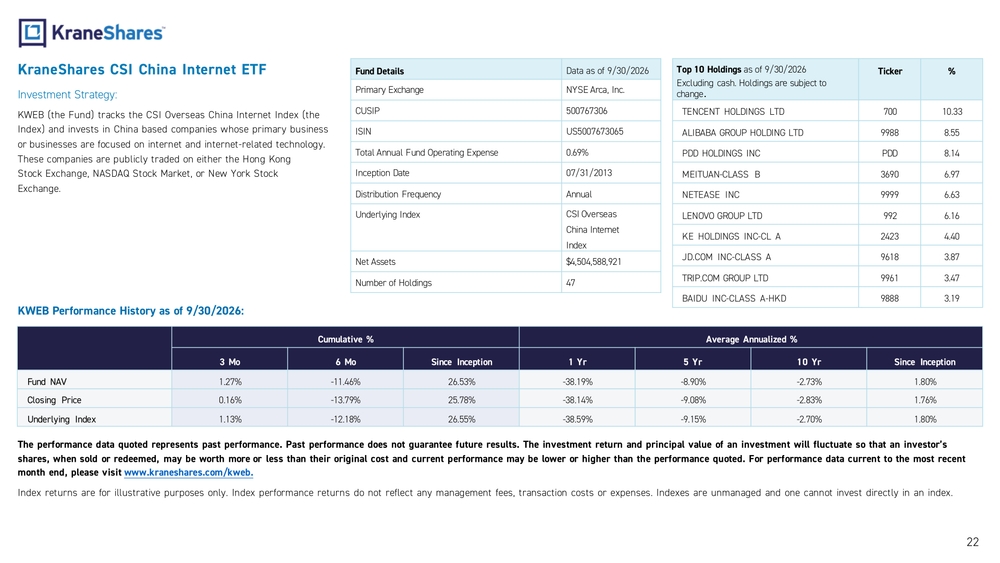
KraneShares CSI China Internet ETF Investment Strategy: KWEB (the Fund) tracks theCSIOverseas China Internet Index (the Index) andinvests inChina based companies whose primary business or businesses arefocused oninternet andinternet -related technology. These companies arepublicly traded oneither theHong Kong Stock Exchange, NASDAQ Stock Market, orNew York Stock Exchange.Fund Details Data asof9/30/202 6 Primary Exchange NYSE Arca, Inc. CUSIP 500767306 ISIN US5007673065 Total Annual Fund Operating Expense 0.69% Inception Date 07/31/2013 Distribution Frequency Annual Underlying Index CSIOverseas China Internet Index Net Assets $4,504,588,921 Number ofHoldings 47Top10Holdings asof9/30/202 6 Excluding cash. Holdings aresubject to change .Ticker % TENCENT HOLDINGS LTD 700 10.33 ALIBABA GROUP HOLDING LTD 9988 8.55 PDD HOLDINGS INC PDD 8.14 MEITUAN -CLASS B 3690 6.97 NETEASE INC 9999 6.63 LENOVO GROUP LTD 992 6.16 KEHOLDINGS INC-CLA 2423 4.40 JD.COM INC-CLASS A 9618 3.87 TRIP.COM GROUP LTD 9961 3.47 BAIDU INC-CLASS A-HKD 9888 3.19 KWEB Performance History asof9/30/2026 : Cumulative % Average Annualized % 3Mo 6Mo Since Inception 1Yr 5Yr 10Yr Since Inception Fund NAV 1.27% -11.46% 26.53% -38.19% -8.90% -2.73% 1.80% Closing Price 0.16% -13.79% 25.78% -38.14% -9.08% -2.83% 1.76% Underlying Index 1.13% -12.18% 26.55% -38.59% -9.15% -2.70% 1.80% Theperformance data quoted represents past performance. Past performance does notguarantee future results. The investment return andprincipal value ofaninvestment will fluctuate sothat aninvestor ’s shares, when sold orredeemed, may beworth more orless than their original cost andcurrent performance may belower orhigher than theperformance quoted. Forperformance data current tothemost recent month end, please visit www.kraneshares.com/kweb. Index returns areforillustrative purposes only. Index performance returns donotreflect anymanagement fees, transaction costs orexpenses. Indexes areunmanaged andonecannot invest directly inanindex. 22
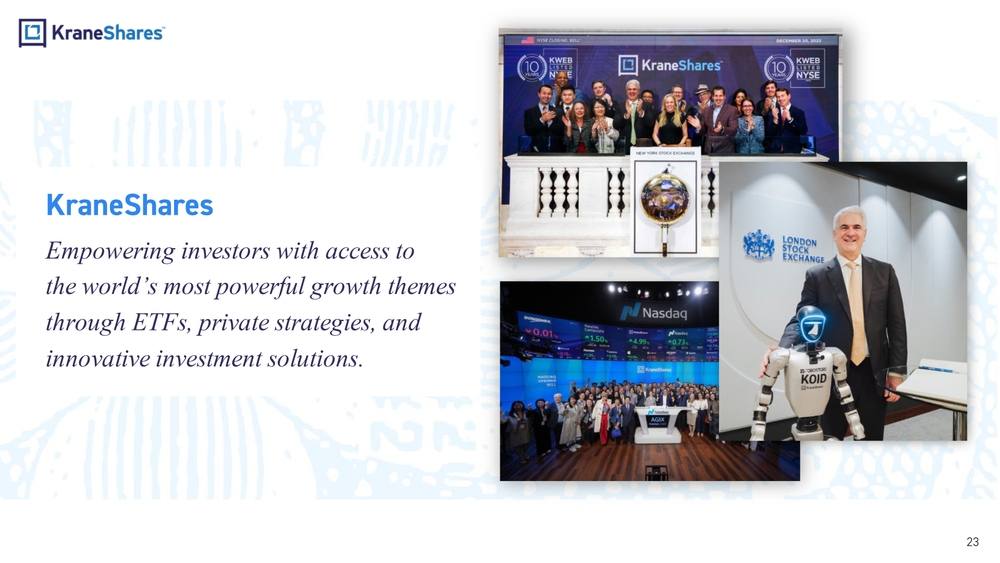
KraneShares Empowering investors with access to the world’ s most powerful growth themes through ETFs, private strategies, and innovative investment solutions. 23
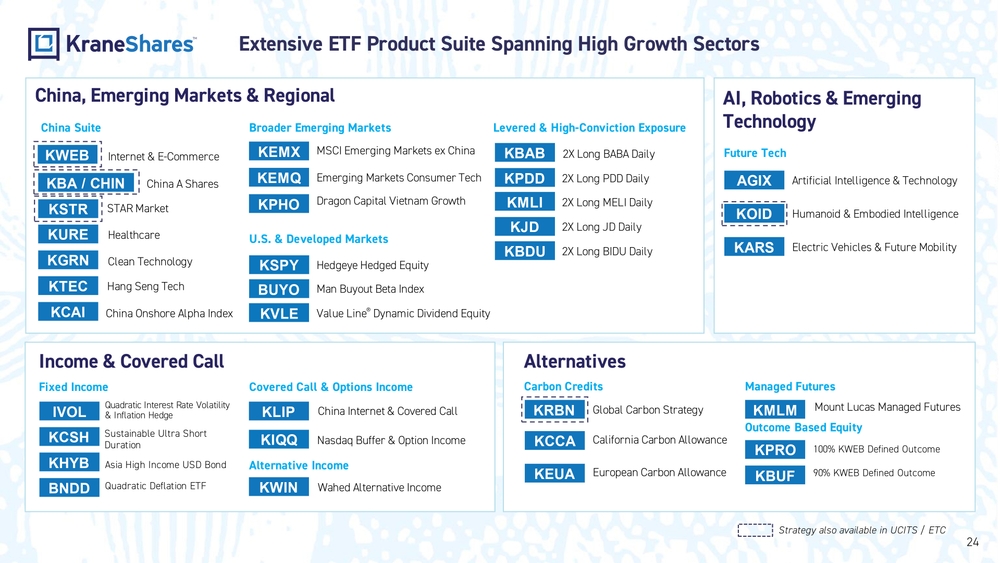
China, Emerging Markets & Regional Alternatives Income & Covered Call AI, Robotics & Emerging Technology KURE Healthcare KGRN Clean TechnologyKSTR STAR Market KTEC Hang Seng TechKWEB Internet & E -Commerce China A Shares KBA / CHIN KCAI China Onshore Alpha IndexAGIX Artificial Intelligence & Technology KOID Humanoid & Embodied Intelligence Electric Vehicles & Future Mobility KARSChina Suite Future TechBroader Emerging Markets KEMQ Emerging Markets Consumer Tech KPHODragon Capital Vietnam GrowthKEMX MSCI Emerging Markets ex China U.S. & Developed Markets KVLE Value Line® Dynamic Dividend EquityHedgeye Hedged Equity KSPY Man Buyout Beta Index BUYO Fixed Income BNDDQuadratic Deflation ETFIVOLQuadratic Interest Rate Volatility & Inflation Hedge KHYB Asia High Income USD BondSustainable Ultra Short DurationKCSH KEUA European Carbon AllowanceGlobal Carbon Strategy KRBNCarbon CreditsKPDD 2X Long PDD Daily KJD 2X Long JD DailyKBAB 2X Long BABA Daily KMLI 2X Long MELI Daily Covered Call & Options Income Managed Futures KMLMMount Lucas Managed Futures KWIN Wahed Alternative IncomeKLIP China Internet & Covered Call Outcome Based Equity KIQQ Nasdaq Buffer & Option IncomeLevered & High -Conviction Exposure KBUF90% KWEB Defined Outcome100% KWEB Defined Outcome KPRO Alternative Income KCCA California Carbon AllowanceExtensive ETF Product Suite Spanning High Growth Sectors Strategy also available in UCITS / ETCKBDU 2X Long BIDU Daily 24
25Important Notes The S&P 500 Index: The S&P 500 Index is an American stock market index based on the market capitalizations of 500 large companies having common stock listed on the NYSE or NASDAQ. The MSCI Emerging Markets Net USD Index : The MSCI Emerging Markets Net USD Index captures large and mid -cap representation across 23 Emerging Markets (EM) countries. With 834 constituents, the index covers approximately 85% of the free float -adjusted market capitalization in each country. The CSI Overseas China Internet Index : The CSI Overseas China Internet Index selects overseas listed Chinese Internet companies as the index constituents ; the index is weighted by free float market cap. The index can measure the overall performance of overseas -listed Chinese Internet companies . The Index is within the scope of the IOSCO Assurance Report as at 30 September 2018 . The index was launched on September 20, 2011 . Price -to-Earnings (P/E): The price -to-earnings ratio (P/E ratio) is the ratio for valuing a company that measures its current share price relative to its per-share earnings (EPS). The price - to-earnings ratio is also sometimes known as the price multiple or the earnings multiple. Forward Price -to-Earnings (P/E): Forward price -to-earnings (forward P/E) is a version of the ratio of price -to-earnings (P/E) that uses forecasted earnings for t he P/E calculation. While the earnings used in this formula are just an estimate and not as reliable as current or historical earnings data, there is s till benefit in estimated P/E analysis. Price -to-Book (P/B): Companies use the price -to-book ratio (P/B ratio) to compare a firm's market capitalization to its book value. It's calculated b y dividing the company's stock price per share by its book value per share. An asset’s book value is equal to its carrying value on the balance sheet, and companies calculate it by netting the asset again st its accumulated depreciation. Price -to-Cash Flow (P/CF): The price -to-cash flow is a stock valuation indicator or multiple that measures the value of a stock’s price relative to its ope rating cash flow per share. Gross Domestic Product (GDP) is the total monetary value of all final goods and services produced within a country during a specific period, usually a yea r or a quarter. Urbanization Rate: The urbanization rate is the speed at which a country’s population is shifting from rural to urban areas, usually measured as the annual percentage change in the share of people living in urban areas. GDP Per Capita: GDP per capita is the total value of all final goods and services produced in an economy in a given period divided by the pop ulation, giving an average economic output per person. Household Per Capita Annual Disposable Income of Urban & Rural Households: This is the average amount of after -tax income available per person in a household over a year, measured separately for urban and rural households, that can be spent or saved. Large language models (LLMs): Large language models are advanced AI systems trained on massive text datasets to understand and generate human -like language fo r tasks such as answering questions, summarizing, and translation. (R-KS-SEI)
26Important Notes (continued) Revenue: Revenue is the total amount of money a company earns from its normal business activities, such as selling goods and services, before deducting any costs or expenses. Average Revenue Growth Rate: The average revenue growth rate is the mean percentage increase (or decrease) in a company’s revenue over a specified multi -period timeframe, typically calculated using year -over-year changes. Net Income: Net income is the profit a company earns after subtracting all expenses, including operating costs, interest, and taxes, from its total revenue over a given period. Dow Jones US Internet Composite Index: The Dow Jones US Internet Composite Index is a stock market index that tracks the performance of U.S. -listed companies whose pri mary business is internet -related services and technologies. YoY Revenue Growth: Year -over-year (YoY) revenue growth is the percentage change in a company’s revenue in the current period compared with the same period one year earlier. Profit Margins: Profit margins are ratios that show what percentage of revenue a company keeps as profit after costs, such as gross, operatin g, or net profit margin. Share Buyback Yield: Share buyback yield is the value of a company’s share repurchases over a period expressed as a percentage of its market capit alization, indicating how much cash is being returned to shareholders through buybacks. (R-KS-SEI)
Important Notes: Carefully consider the Funds’ investment objectives, risk factors, charges and expenses before investing. This and additional information can be found in the Funds' full and summary prospectus, which may be obtained by visiting www.kraneshares.com/kweb. Read the prospectus carefully before investing. Risk Disclosures: Investing involves risk, including possible loss of principal. There can be no assurance that a Fund will achieve its stated objectives. Indices are unmanaged and do not include the effect of fees. One cannot invest directly in an index. This information should not be relied upon as research, investment advice, or a recommendation regarding any products, strate gies, or any security in particular. This material is strictly for illustrative, educational, or informational purposes and is subject to change. Certain content represents an assessment of the market environment at a spec ific time and is not intended to be a forecast of future events or a guarantee of future results; material is as of the dates noted and is subject to change without notice. A-Shares are issued by companies in mainland China and traded on local exchanges. They are available to domestic and certain fo reign investors, including QFIs and those participating in Stock Connect Programs like Shanghai -Hong Kong and Shenzhen -Hong Kong. Foreign investments in A -Shares face various regulations and restrictions, including limits on asset repatriation. A -Shares may experience frequent trading halts and illiquidity, which can lead to volatility in the Fund’s share price and increased trading halt risks. The Chinese economy is an emerging market, vulnerable to domestic and regional economic and political changes, often showing more volatility than developed markets. Companies face risks from potential government interventions, and the export -driven economy is sensitive to downturns in key trading partners, impacting the Fund. U.S. - China tensions raise concerns over tariffs and trade restrictions, which could harm China’s exports and the Fund. China's reg ulatory standards are less stringent than in the U.S., resulting in limited information about issuers. Tax laws are unclear and subject to change, potentially impacting the Fund and leading to unexpected liabilities for foreign investors. Fluctuations in currency of foreign countries may have an adverse effect to domestic currency values. The Fund may invest in derivatives, which are often more volatile than other investments and may magnify the Fund’s gains or losses. A derivative (i.e., futures/forward contracts, swaps, and options) is a contract that derives its value from the performance of an underlying asset. The primary risk of derivatives is that changes in the asset’s market value and the derivative may not be proportionate, and some derivatives can have the potential for unlimited losses. Derivatives are also subject to liquidity and counterparty risk. The Fund is subject to liqui dity risk, meaning that certain investments may become difficult to purchase or sell at a reasonable time and price. If a transaction for these securities is large, it may not be possible to initiate, which may cause the Fund to suffer losses. Counterparty risk is the risk of loss in the event that the counterparty to an agreement fails to make required payments or otherwise comply with the terms of the derivative. The Fund may invest in Initial Public Offerings (IPOs). Securities issued in IPOs have no trading history, and information ab out the companies may be available for very limited periods. In addition, the prices of securities sold in IPOs may be highly volatile. In addition, as the Fund increases in size, the impact of IPOs on the Fund’s performance will generally decrease. Narrowly focused investments typically exhibit higher volatility. The Fund’s assets are expected to be concentrated in a sector, industry, market, or group of concentrations to the extent that the Under lying Index has such concentrations. The securities or futures in that concentration could react similarly to market developments. Thus, the Fund is subject to loss due to adverse occurrences that affect that concentration . In addition to the normal risks associated with investing, investments in smaller companies typically exhibit higher volatility. KWEB is non -diversified. ETF shares are bought and sold on an exchange at market price (not NAV) and are not individually redeemed from the Fund. Howe ver, shares may be redeemed at NAV directly by certain authorized broker -dealers (Authorized Participants) in very large creation/redemption units. The returns shown do not represent the returns you would r eceive if you traded shares at other times. Shares may trade at a premium or discount to their NAV in the secondary market. Brokerage commissions will reduce returns. Beginning 12/23/2020, market price returns are based on the official closing price of an ETF share or, if the official closing price isn't available, the midpoint between the national best bid and national best offer ("NBBO") as of the time the ETF calculates the current NAV per share. Prior to that date, market price returns were based on the midpoint between the Bid and Ask price. NAVs are calculated using prices as of 4:00 PM Eastern Time. The KraneShares ETFs and KFA Funds ETFs are distributed by SEI Investments Distribution Company (SIDCO), 1 Freedom Valley Dri ve, Oaks, PA 19456, which is not affiliated with Krane Funds Advisors, LLC, the Investment Adviser for the Funds, or any sub -advisers for the Funds.