China ETF Overview: KWEB | KraneShares China Internet ETF
by Kraneshares
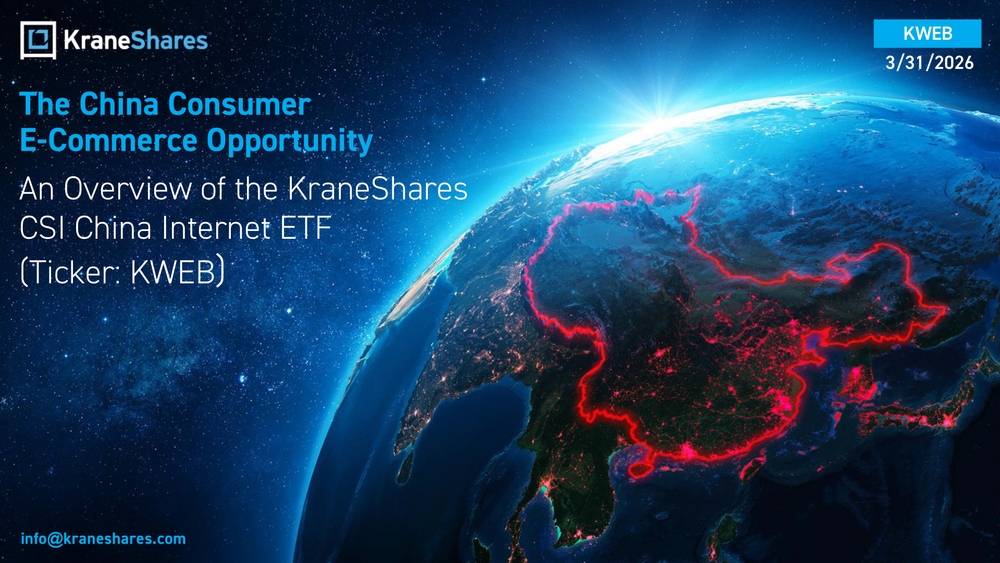
The China Consumer E-Commerce Opportunity
An Overview of the KraneShares CSI China Internet ETF
(Ticker: KWEB)
Date: 3/31/2026
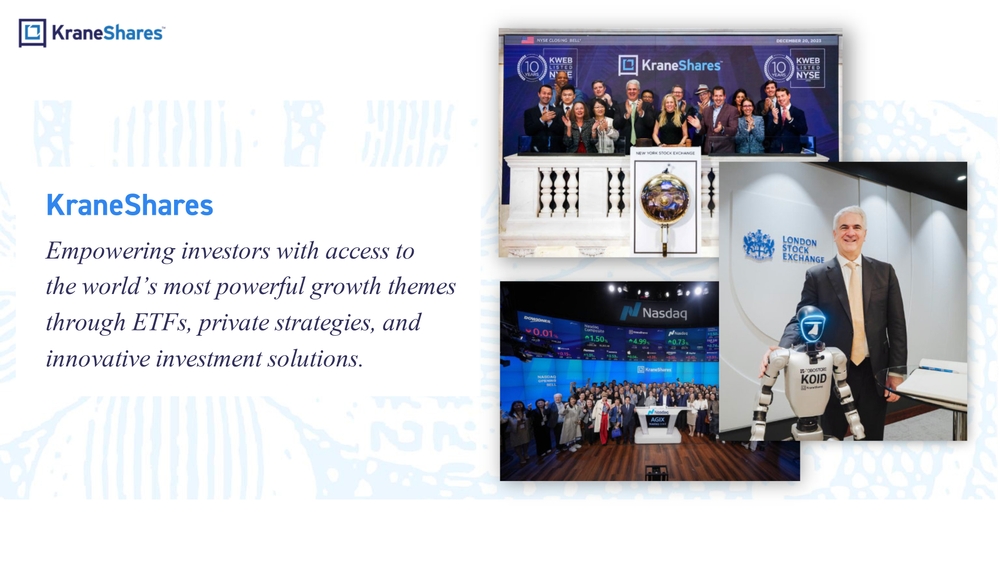
KraneShares
Empowering investors with access to the world's most powerful growth themes through ETFs, private strategies, and innovative investment solutions.
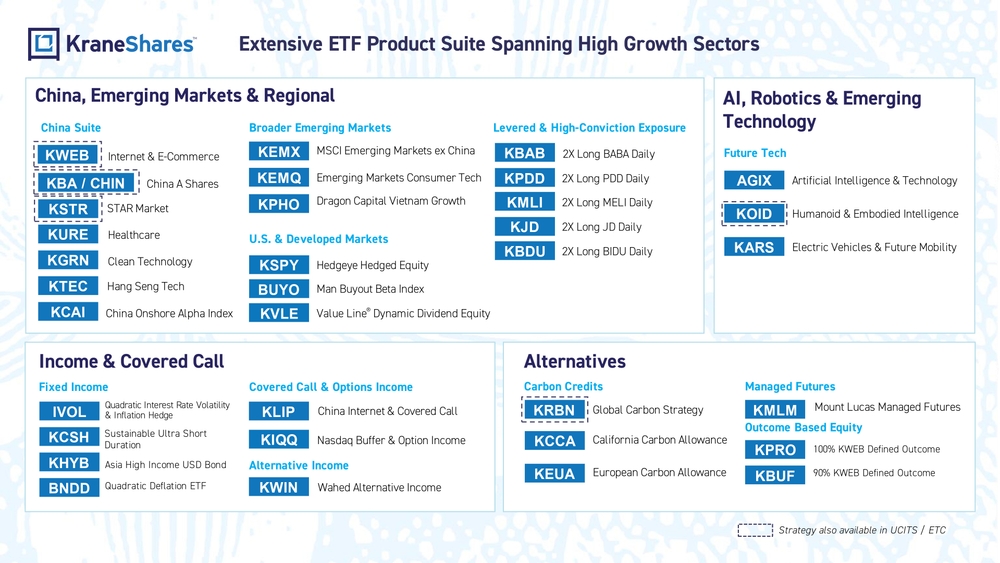
Extensive ETF Product Suite Spanning High Growth Sectors
China, Emerging Markets & Regional
China Suite
- KWEB – Internet & E-Commerce
- KBA / CHIN – China A Shares
- KSTR – STAR Market
- KURE – Healthcare
- KGRN – Clean Technology
- KTEC – Hang Seng Tech
- KCAI – China Onshore Alpha Index
Broader Emerging Markets
- KEMQ – Emerging Markets Consumer Tech
- KPHO – Dragon Capital Vietnam Growth
- KEMX – MSCI Emerging Markets ex China
U.S. & Developed Markets
- KVLE – Value Line® Dynamic Dividend Equity
- KSPY – Hedgeye Hedged Equity
- BUYO – Man Buyout Beta Index
Levered & High-Conviction Exposure
- KBAB – 2X Long BABA Daily
- KPDD – 2X Long PDD Daily
- KMLI – 2X Long MELI Daily
- KJD – 2X Long JD Daily
- KBDU – 2X Long BIDU Daily
AI, Robotics & Emerging Technology
Future Tech
- AGIX – Artificial Intelligence & Technology
- KOID – Humanoid & Embodied Intelligence
- KARS – Electric Vehicles & Future Mobility
Income & Covered Call
Fixed Income
- IVOL – Quadratic Interest Rate Volatility & Inflation Hedge
- KCSH – Sustainable Ultra Short Duration
- KHYB – Asia High Income USD Bond
- BNDD – Quadratic Deflation ETF
Covered Call & Options Income
- KLIP – China Internet & Covered Call
- KIQQ – Nasdaq Buffer & Option Income
Alternative Income
- KWIN – Wahed Alternative Income
Alternatives
Carbon Credits
- KRBN – Global Carbon Strategy
- KCCA – California Carbon Allowance
- KEUA – European Carbon Allowance
Managed Futures
- KMLM – Mount Lucas Managed Futures
Outcome Based Equity
- KPRO – 100% KWEB Defined Outcome
- KBUF – 90% KWEB Defined Outcome
Strategy also available in UCITS / ETC
KWEB – KraneShares CSI China Internet ETF
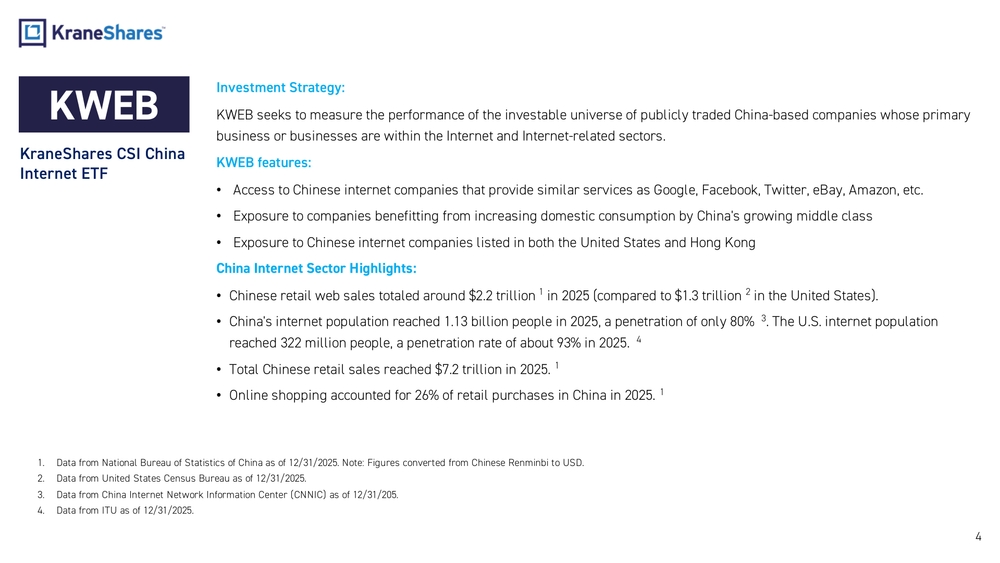
Investment Strategy
KWEB seeks to measure the performance of the investable universe of publicly traded China-based companies whose primary business or businesses are within the Internet and Internet-related sectors.
KWEB Features
- Access to Chinese internet companies that provide similar services as Google, Facebook, Twitter, eBay, Amazon, etc.
- Exposure to companies benefitting from increasing domestic consumption by China's growing middle class
- Exposure to Chinese internet companies listed in both the United States and Hong Kong
China Internet Sector Highlights
- Chinese retail web sales totaled around $2.2 trillion in 2025 (compared to $1.3 trillion in the United States).
- China's internet population reached 1.13 billion people in 2025, a penetration of only 80%. The U.S. internet population reached 322 million people, a penetration rate of about 93% in 2025.
- Total Chinese retail sales reached $7.2 trillion in 2025.
- Online shopping accounted for 26% of retail purchases in China in 2025.
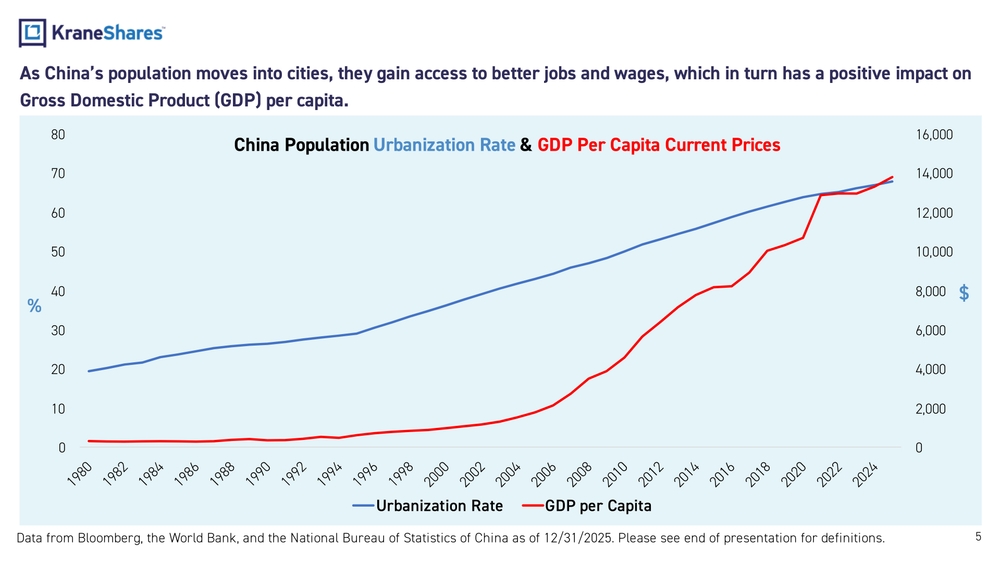
China Population Urbanization Rate & GDP Per Capita Current Prices
As China's population moves into cities, they gain access to better jobs and wages, which in turn has a positive impact on Gross Domestic Product (GDP) per capita.
Chart: China Population Urbanization Rate & GDP Per Capita Current Prices (1980–2024)
- Urbanization Rate (left axis, %): Rose from ~20% in 1980 to ~70% by 2024
- GDP per Capita (right axis, USD): Rose from near $0 in 1980 to ~$13,000+ by 2024
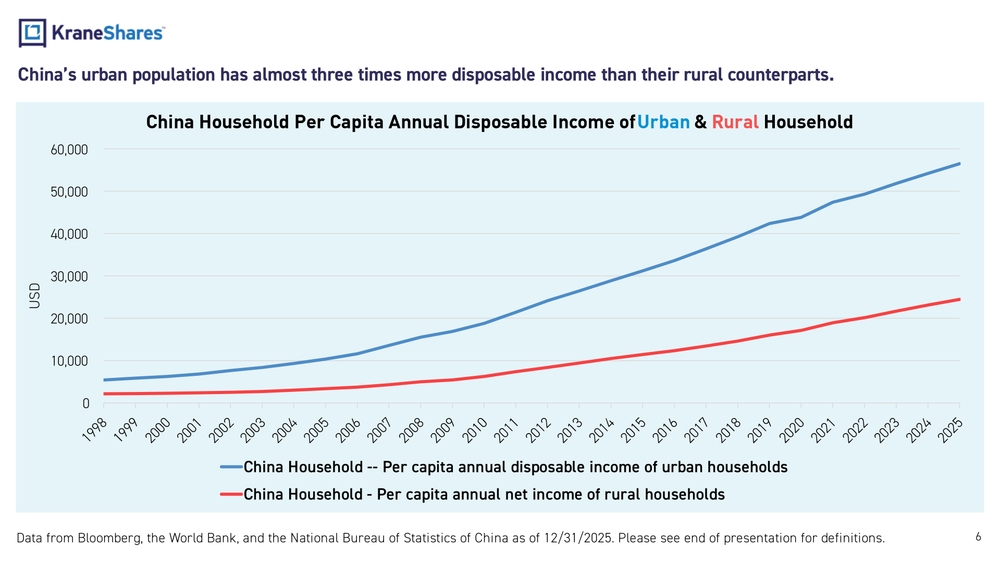
China Household Per Capita Annual Disposable Income of Urban & Rural Household
China's urban population has almost three times more disposable income than their rural counterparts.
Chart: China Household Per Capita Annual Disposable Income of Urban & Rural Household (1998–2025)
- Urban households (blue line): Per capita annual disposable income rose from ~$5,000 in 1998 to ~$57,000 by 2025
- Rural households (red line): Per capita annual net income rose from ~$1,500 in 1998 to ~$25,000 by 2025
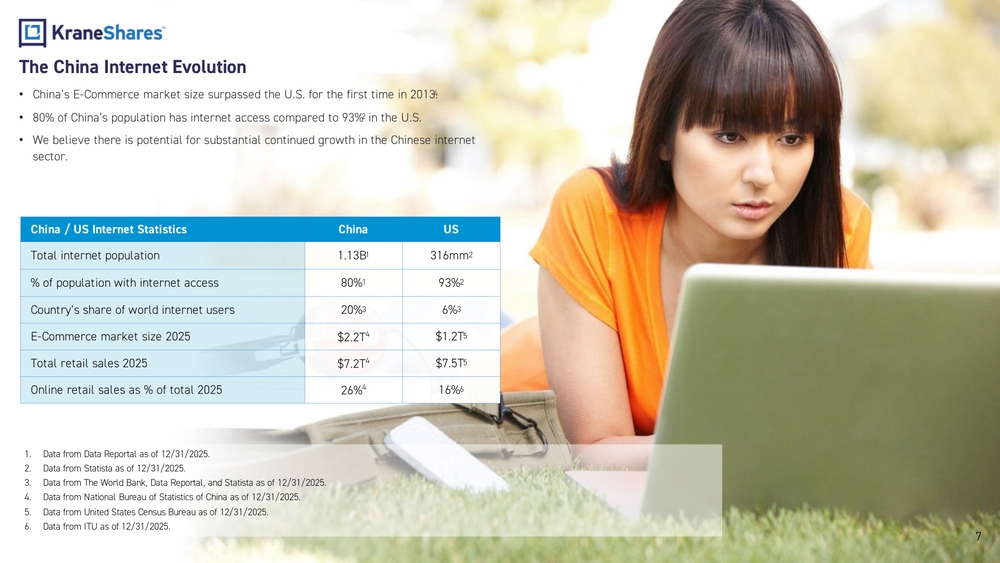
The China Internet Evolution
- China's E-Commerce market size surpassed the U.S. for the first time in 2013.
- 80% of China's population has internet access compared to 93% in the U.S.
- We believe there is potential for substantial continued growth in the Chinese internet sector.
China / US Internet Statistics
| Metric | China | US |
|---|---|---|
| Total internet population | 1.13B | 316mm |
| % of population with internet access | 80% | 93% |
| Country's share of world internet users | 20% | 6% |
| E-Commerce market size 2025 | $2.2T | $1.2T |
| Total retail sales 2025 | $7.2T | $7.5T |
| Online retail sales as % of total 2025 | 26% | 16% |
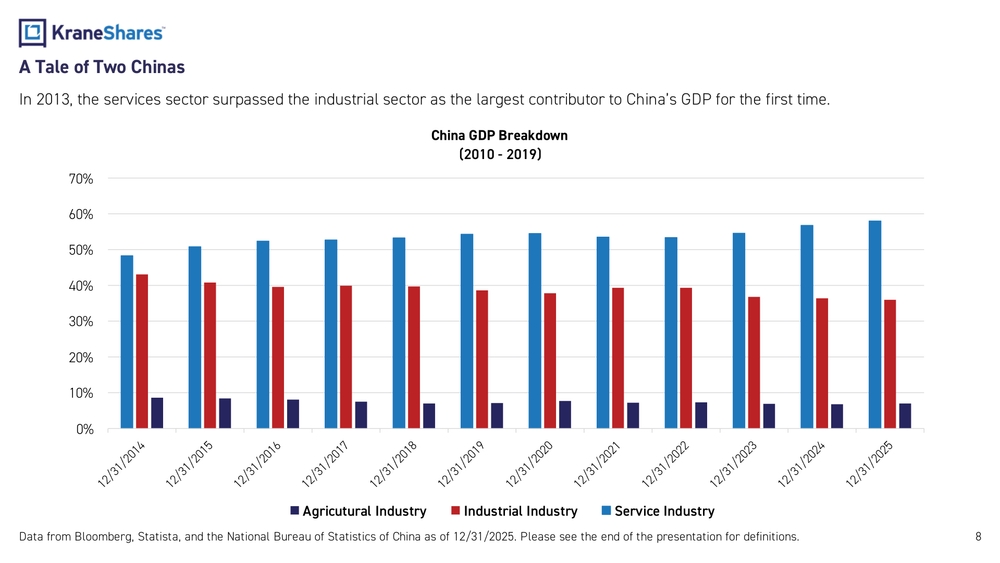
A Tale of Two Chinas
In 2013, the services sector surpassed the industrial sector as the largest contributor to China's GDP for the first time.
China GDP Breakdown (2010 - 2019)
Bar chart showing China GDP breakdown by sector from 12/31/2014 to 12/31/2025:
- Service Industry (blue): Largest and growing sector, rising from ~49% to ~58%
- Industrial Industry (red): Declining sector, falling from ~43% to ~36%
- Agricultural Industry (dark): Smallest and relatively stable sector, around 7-9%
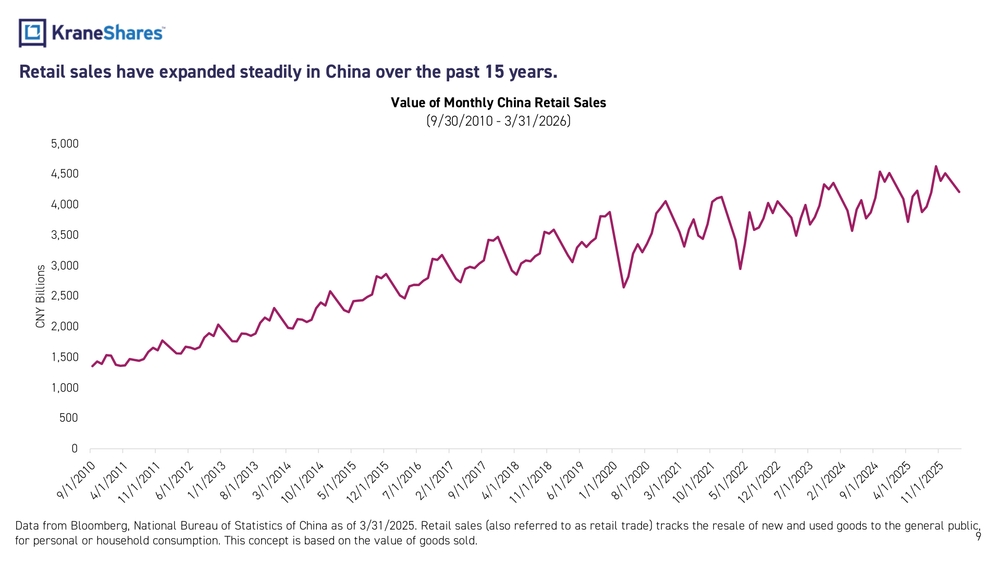
Value of Monthly China Retail Sales
(9/30/2010 - 3/31/2026)
Retail sales have expanded steadily in China over the past 15 years.
Line chart showing monthly China retail sales in CNY Billions from September 2010 to March 2026.
- Retail sales grew from approximately CNY 1,400 billion in September 2010 to approximately CNY 4,200–4,500 billion by early 2026.
- Seasonal peaks are visible each year, with a notable dip around early 2022.
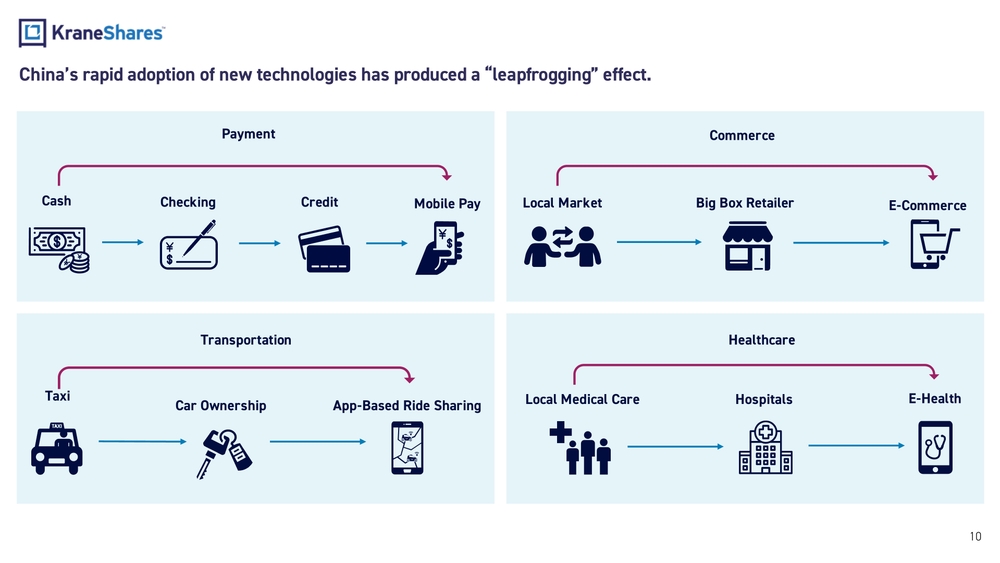
China's Rapid Technology Adoption: The "Leapfrogging" Effect
China's rapid adoption of new technologies has produced a "leapfrogging" effect.
Payment
Cash → Checking → Credit → Mobile Pay
Commerce
Local Market → Big Box Retailer → E-Commerce
Transportation
Taxi → Car Ownership → App-Based Ride Sharing
Healthcare
Local Medical Care → Hospitals → E-Health
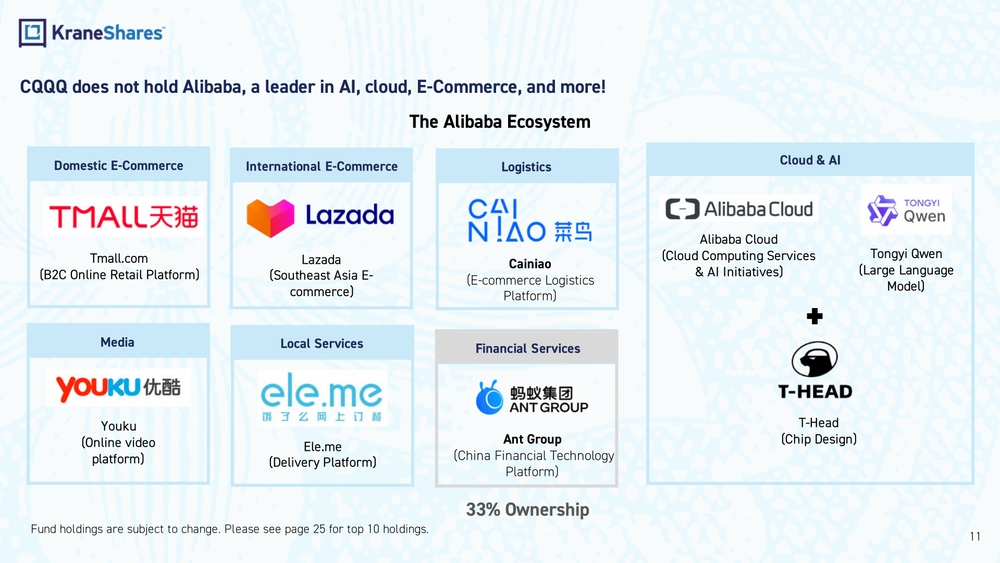
CQQQ does not hold Alibaba, a leader in AI, cloud, E-Commerce, and more!
The Alibaba Ecosystem
Domestic E-Commerce
- Tmall.com (B2C Online Retail Platform)
International E-Commerce
- Lazada (Southeast Asia Ecommerce)
Logistics
- Cainiao (E-commerce Logistics Platform)
Cloud & AI
- Alibaba Cloud (Cloud Computing Services & AI Initiatives)
- Tongyi Qwen (Large Language Model)
- T-Head (Chip Design)
Media
- Youku (Online video platform)
Local Services
- Ele.me (Delivery Platform)
Financial Services
- Ant Group (China Financial Technology Platform) — 33% Ownership
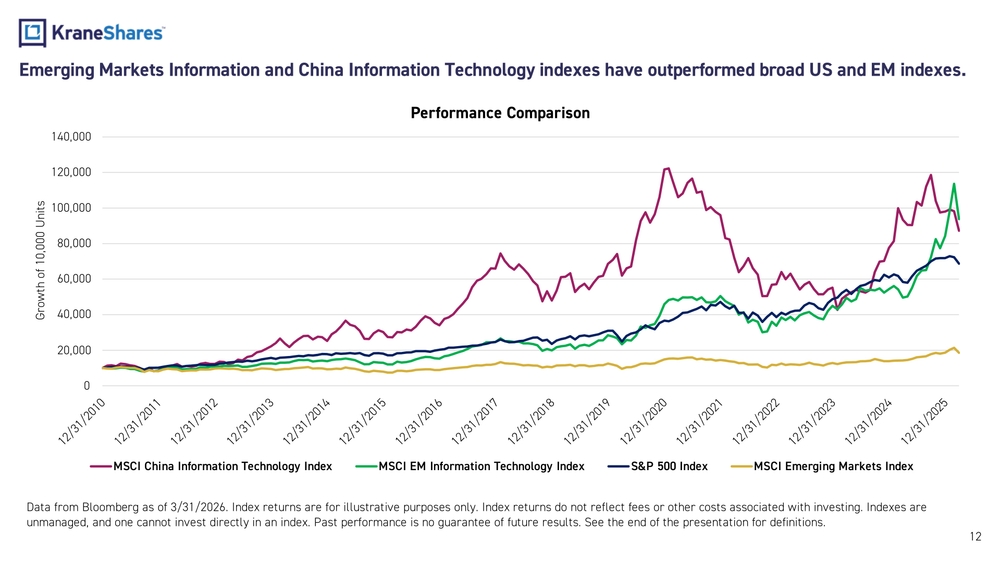
Emerging Markets Information and China Information Technology indexes have outperformed broad US and EM indexes.
Performance Comparison
Growth of 10,000 Units (from 12/31/2010 to 12/31/2025)
- MSCI China Information Technology Index
- MSCI EM Information Technology Index
- S&P 500 Index
- MSCI Emerging Markets Index
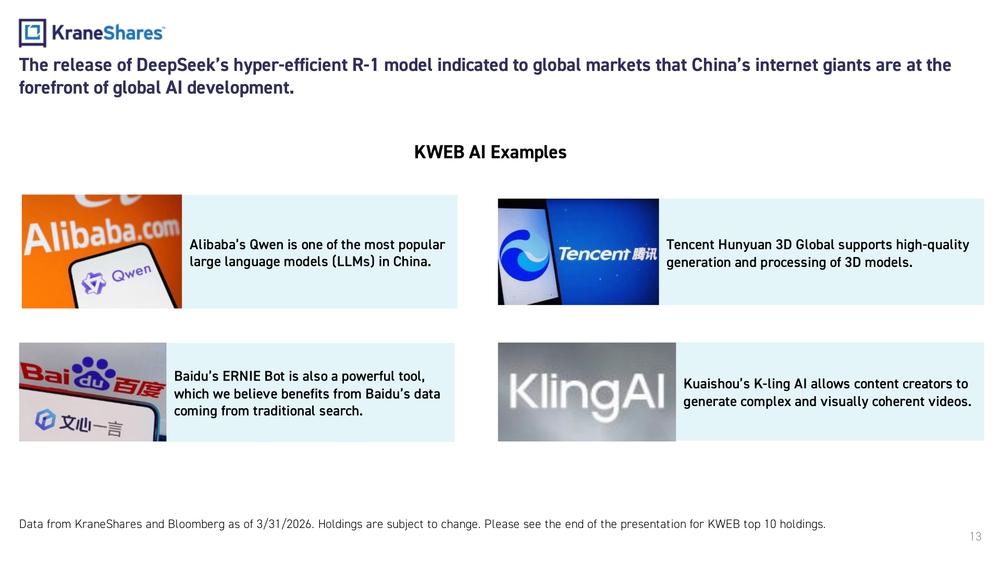
The release of DeepSeek's hyper-efficient R-1 model indicated to global markets that China's internet giants are at the forefront of global AI development.
KWEB AI Examples
- Alibaba's Qwen is one of the most popular large language models (LLMs) in China.
- Tencent Hunyuan 3D Global supports high-quality generation and processing of 3D models.
- Baidu's ERNIE Bot is also a powerful tool, which we believe benefits from Baidu's data coming from traditional search.
- Kuaishou's K-ling AI allows content creators to generate complex and visually coherent videos.
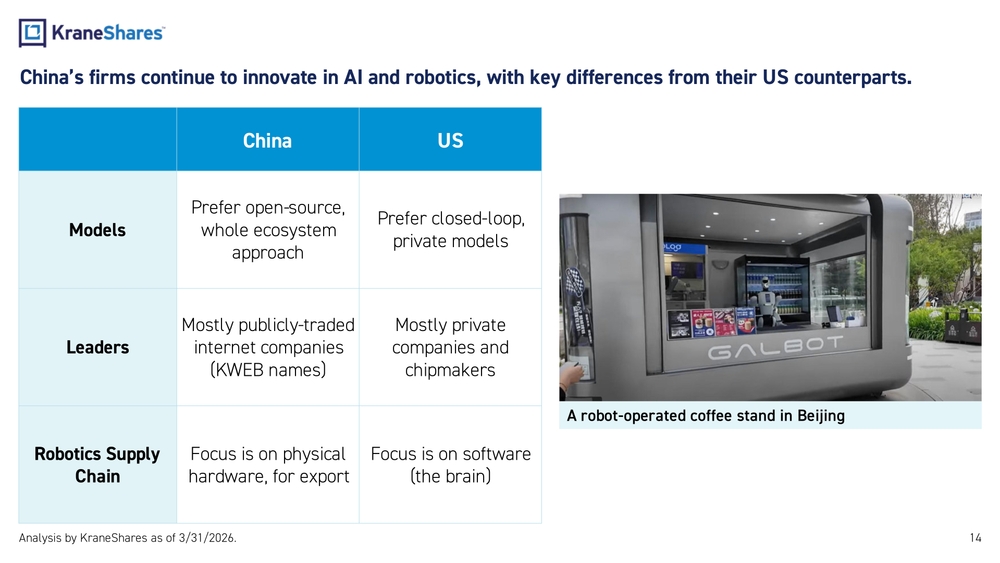
China's firms continue to innovate in AI and robotics, with key differences from their US counterparts.
| China | US | |
|---|---|---|
| Models | Prefer open-source, whole ecosystem approach | Prefer closed-loop, private models |
| Leaders | Mostly publicly-traded internet companies (KWEB names) | Mostly private companies and chipmakers |
| Robotics Supply Chain | Focus is on physical hardware, for export | Focus is on software (the brain) |
A robot-operated coffee stand in Beijing
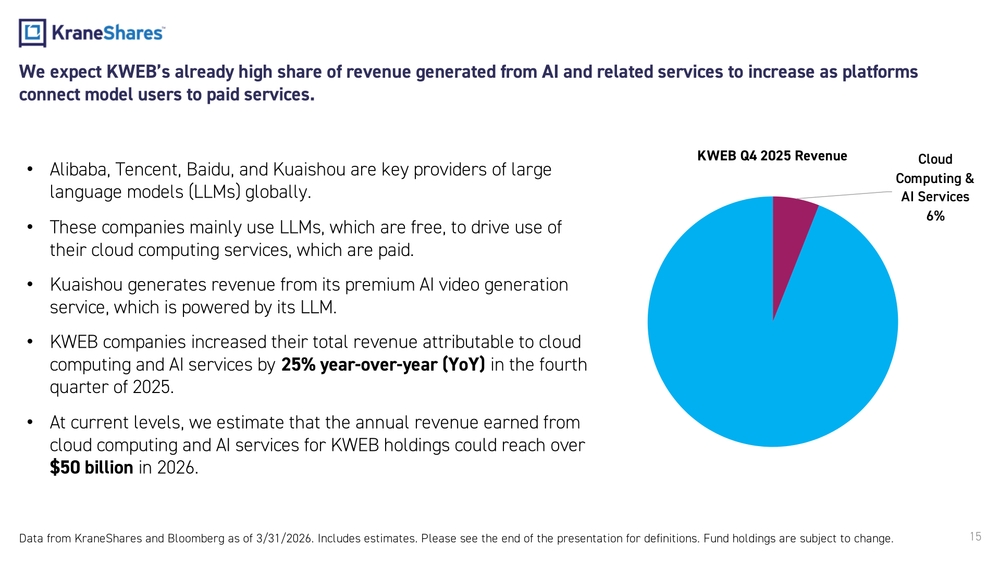
We expect KWEB's already high share of revenue generated from AI and related services to increase as platforms connect model users to paid services.
KWEB Q4 2025 Revenue
-
Cloud Computing & AI Services: 6%
-
Alibaba, Tencent, Baidu, and Kuaishou are key providers of large language models (LLMs) globally.
-
These companies mainly use LLMs, which are free, to drive use of their cloud computing services, which are paid.
-
Kuaishou generates revenue from its premium AI video generation service, which is powered by its LLM.
-
KWEB companies increased their total revenue attributable to cloud computing and AI services by 25% year-over-year (YoY) in the fourth quarter of 2025.
-
At current levels, we estimate that the annual revenue earned from cloud computing and AI services for KWEB holdings could reach over $50 billion in 2026.
The 3 & 5-year average revenue growth rates for China internet companies are like many U.S. internet companies.
Top 10 KWEB holdings vs. their U.S. equivalents as of the latest earnings release Q4 2025
| Top 10 KWEB Holdings | Primary Business | KWEB Weight (%) | China: 3Y Avg Revenue Growth (%) | China: 5Y Avg Revenue Growth (%) | Comparable U.S. Business | US: 3Y Avg Revenue Growth (%) | US: 5Y Avg Revenue Growth (%) |
|---|---|---|---|---|---|---|---|
| Tencent | Social Media | 10.09 | 11 | 9 | Meta | 20 | 19 |
| Alibaba | E-Commerce | 8.93 | 5 | 15 | Amazon | 12 | 13 |
| PDD | E-Commerce | 8.78 | 53 | 51 | Amazon | 12 | 13 |
| Meituan | E-Commerce | 7.36 | 19 | 27 | Amazon | 12 | 13 |
| NetEase | Gaming | 5.91 | 5 | 9 | Activision Blizzard | 6 | 2 |
| JD.com | E-Commerce | 4.91 | 8 | 12 | Amazon | 12 | 13 |
| KE Holdings | Online Real Estate Services | 4.34 | 17 | 8 | Zillow | 10 | 20 |
| Baidu | AI Cloud & Search | 4.28 | 2 | 4 | Alphabet | 13 | 18 |
| JD Health | Online Health Services | 4.01 | 16 | 32 | Teladoc | 2 | 22 |
| Full Truck Alliance | Online Logistics Services | 3.59 | 23 | 39 | XPO | 2 | 6 |
| Average | 16 | 21 | 10 | 14 |

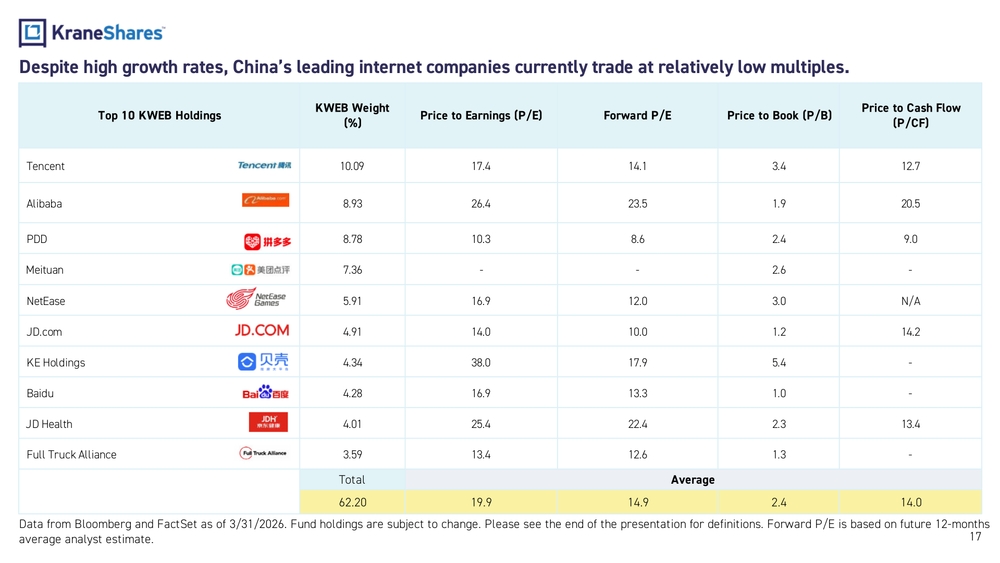
Despite high growth rates, China's leading internet companies currently trade at relatively low multiples.
Top 10 KWEB Holdings Valuation Metrics
| Top 10 KWEB Holdings | KWEB Weight (%) | Price to Earnings (P/E) | Forward P/E | Price to Book (P/B) | Price to Cash Flow (P/CF) |
|---|---|---|---|---|---|
| Tencent | 10.09 | 17.4 | 14.1 | 3.4 | 12.7 |
| Alibaba | 8.93 | 26.4 | 23.5 | 1.9 | 20.5 |
| PDD | 8.78 | 10.3 | 8.6 | 2.4 | 9.0 |
| Meituan | 7.36 | - | - | 2.6 | - |
| NetEase | 5.91 | 16.9 | 12.0 | 3.0 | N/A |
| JD.com | 4.91 | 14.0 | 10.0 | 1.2 | 14.2 |
| KE Holdings | 4.34 | 38.0 | 17.9 | 5.4 | - |
| Baidu | 4.28 | 16.9 | 13.3 | 1.0 | - |
| JD Health | 4.01 | 25.4 | 22.4 | 2.3 | 13.4 |
| Full Truck Alliance | 3.59 | 13.4 | 12.6 | 1.3 | - |
| Total Average | 62.20 | 19.9 | 14.9 | 2.4 | 14.0 |
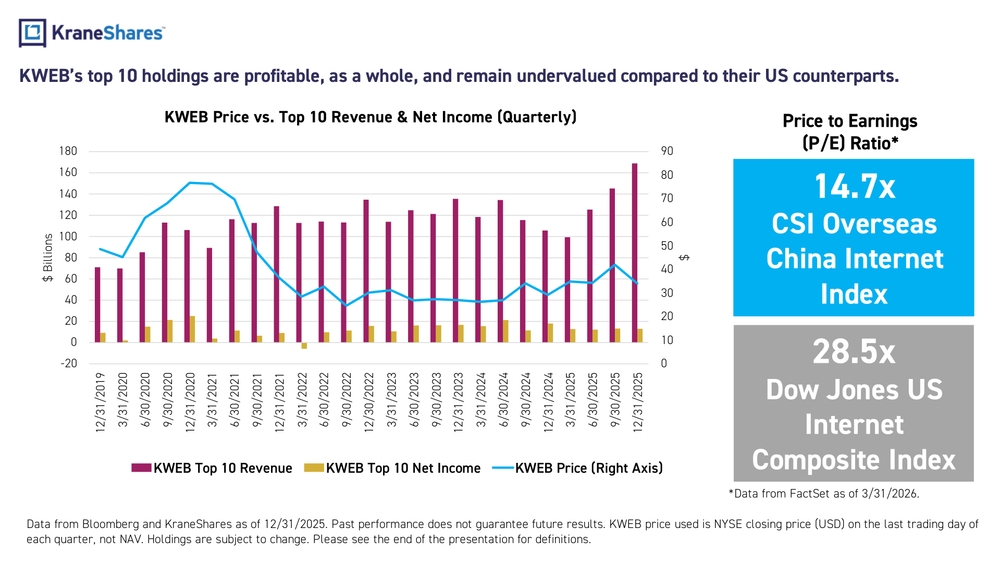
KWEB's top 10 holdings are profitable, as a whole, and remain undervalued compared to their US counterparts.
KWEB Price vs. Top 10 Revenue & Net Income (Quarterly)
Chart showing KWEB Top 10 Revenue, KWEB Top 10 Net Income, and KWEB Price (Right Axis) from 12/31/2019 to 12/31/2025.
Price to Earnings (P/E) Ratio
- 14.7x — CSI Overseas China Internet Index
- 28.5x — Dow Jones US Internet Composite Index
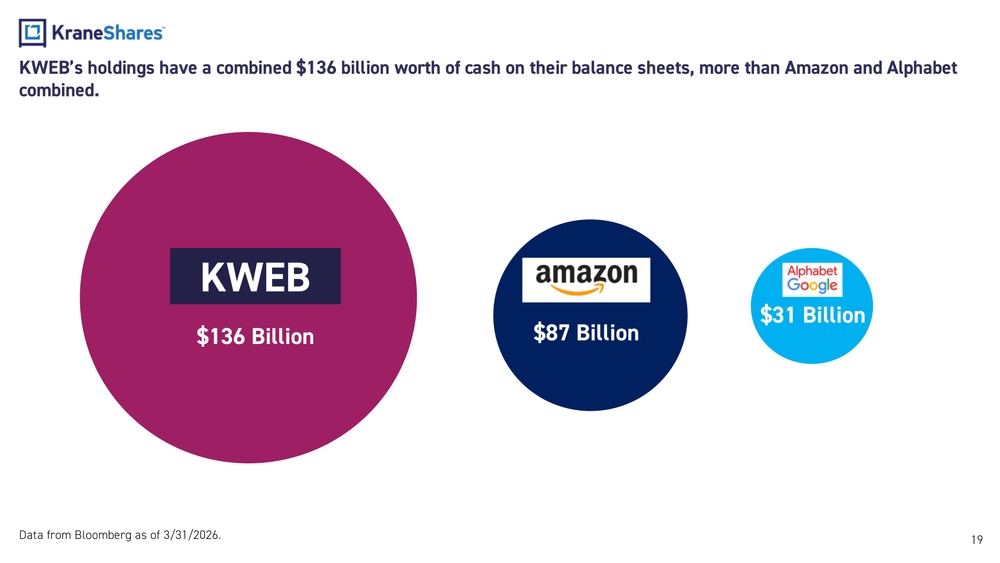
KWEB's holdings have a combined $136 billion worth of cash on their balance sheets, more than Amazon and Alphabet combined.
- KWEB: $136 Billion
- Amazon: $87 Billion
- Alphabet (Google): $31 Billion
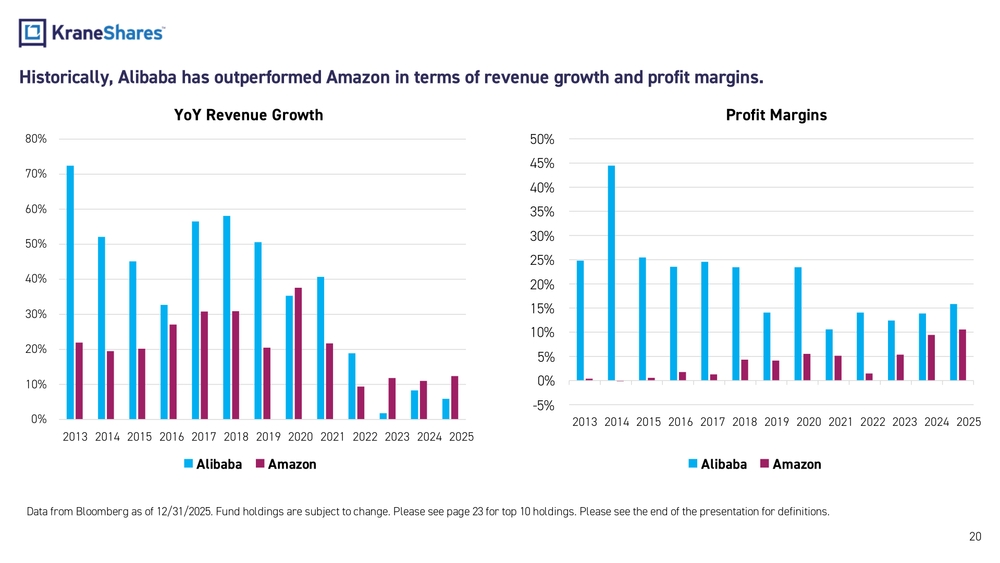
Historically, Alibaba has outperformed Amazon in terms of revenue growth and profit margins.
YoY Revenue Growth (2013–2025)
- Alibaba vs. Amazon year-over-year revenue growth comparison
- Alibaba consistently showed higher YoY revenue growth, particularly in earlier years (2013–2021)
Profit Margins (2013–2025)
- Alibaba vs. Amazon profit margin comparison
- Alibaba has historically maintained higher profit margins than Amazon across most years from 2013 to 2025
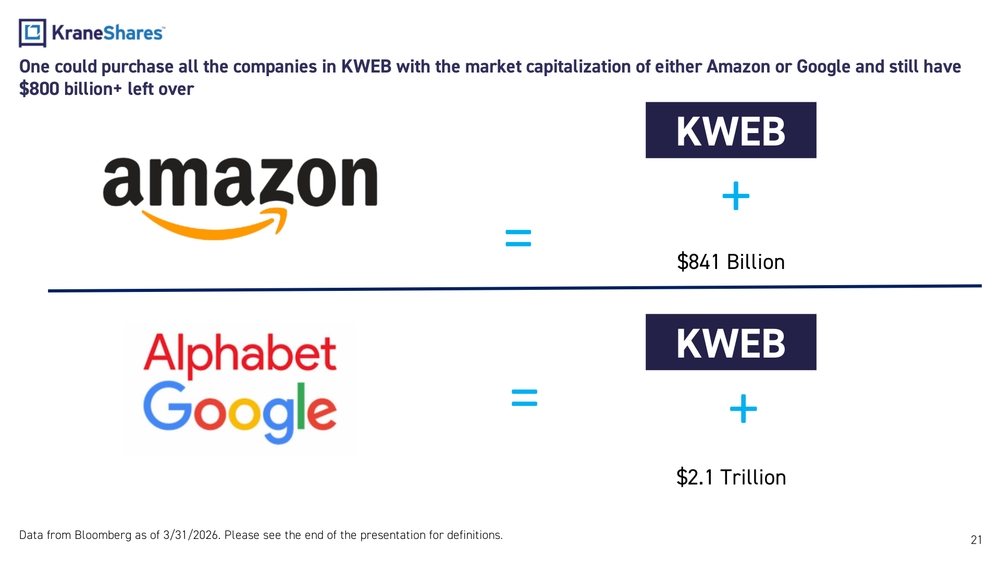
One could purchase all the companies in KWEB with the market capitalization of either Amazon or Google and still have $800 billion+ left over
Amazon = KWEB + $841 Billion
Alphabet Google = KWEB + $2.1 Trillion
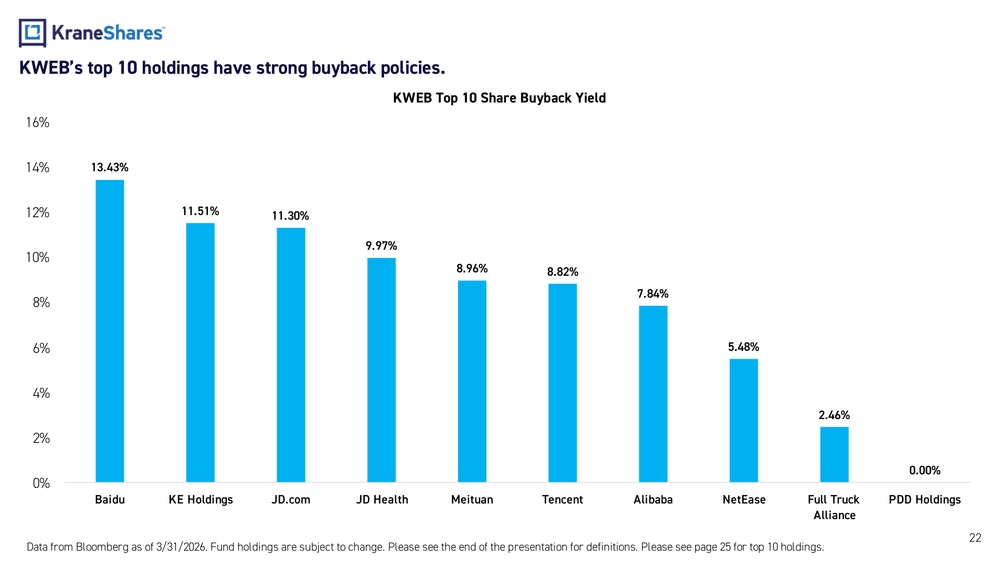
KWEB's top 10 holdings have strong buyback policies.
KWEB Top 10 Share Buyback Yield
| Company | Buyback Yield |
|---|---|
| Baidu | 13.43% |
| KE Holdings | 11.51% |
| JD.com | 11.30% |
| JD Health | 9.97% |
| Meituan | 8.96% |
| Tencent | 8.82% |
| Alibaba | 7.84% |
| NetEase | 5.48% |
| Full Truck Alliance | 2.46% |
| PDD Holdings | 0.00% |
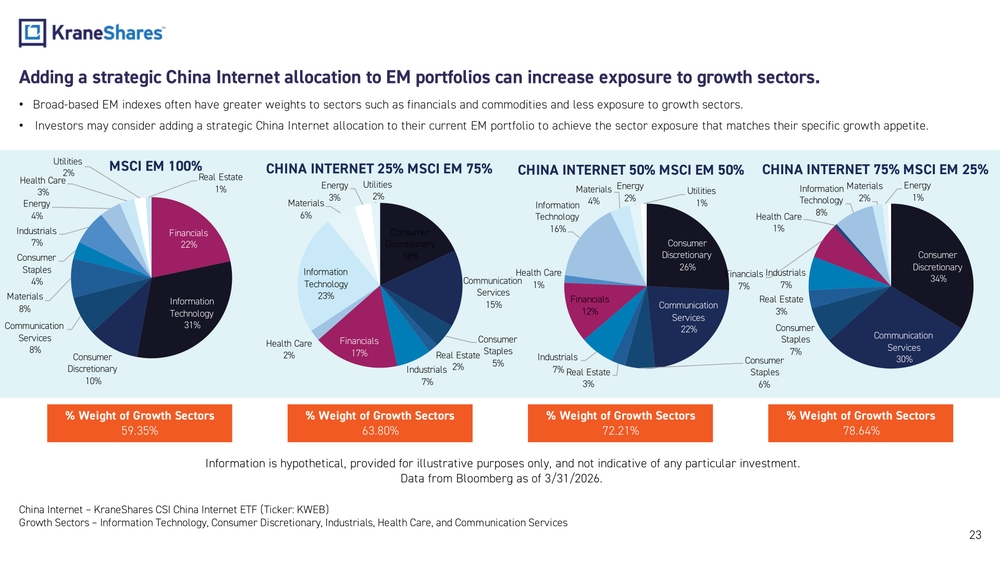
Adding a strategic China Internet allocation to EM portfolios can increase exposure to growth sectors.
- Broad-based EM indexes often have greater weights to sectors such as financials and commodities and less exposure to growth sectors.
- Investors may consider adding a strategic China Internet allocation to their current EM portfolio to achieve the sector exposure that matches their specific growth appetite.
Portfolio Allocation Scenarios
| Allocation | % Weight of Growth Sectors |
|---|---|
| MSCI EM 100% | 59.35% |
| China Internet 25% / MSCI EM 75% | 63.80% |
| China Internet 50% / MSCI EM 50% | 72.21% |
| China Internet 75% / MSCI EM 25% | 78.64% |
China Internet = KraneShares CSI China Internet ETF (Ticker: KWEB) Growth Sectors = Information Technology, Consumer Discretionary, Industrials, Health Care, and Communication Services
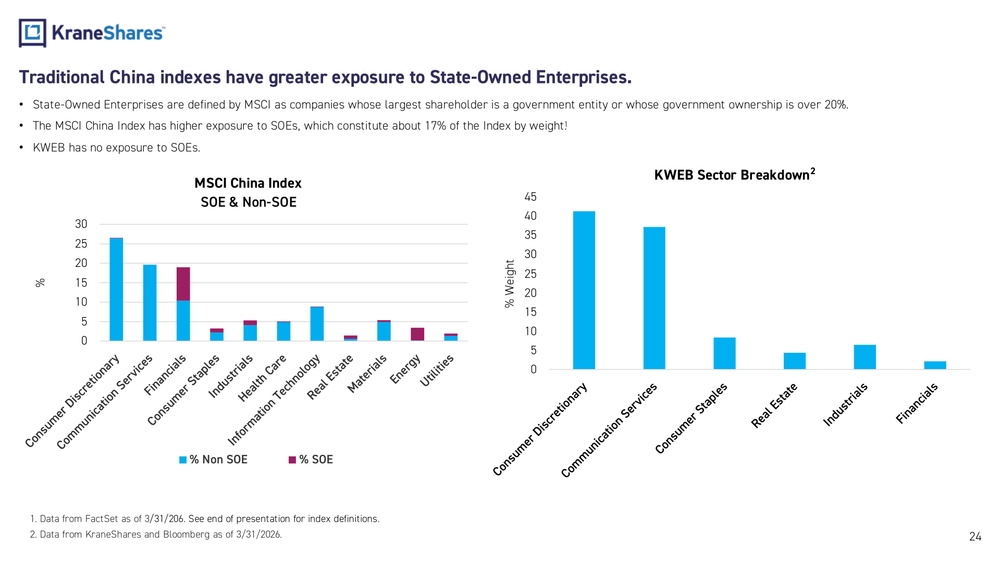
Traditional China indexes have greater exposure to State-Owned Enterprises.
- State-Owned Enterprises are defined by MSCI as companies whose largest shareholder is a government entity or whose government ownership is over 20%.
- The MSCI China Index has higher exposure to SOEs, which constitute about 17% of the Index by weight.
- KWEB has no exposure to SOEs.
MSCI China Index SOE & Non-SOE Breakdown
(By sector: Consumer Discretionary, Communication Services, Financials, Consumer Staples, Industrials, Health Care, Information Technology, Real Estate, Materials, Energy, Utilities)
KWEB Sector Breakdown
(Sectors: Consumer Discretionary, Communication Services, Consumer Staples, Real Estate, Industrials, Financials)
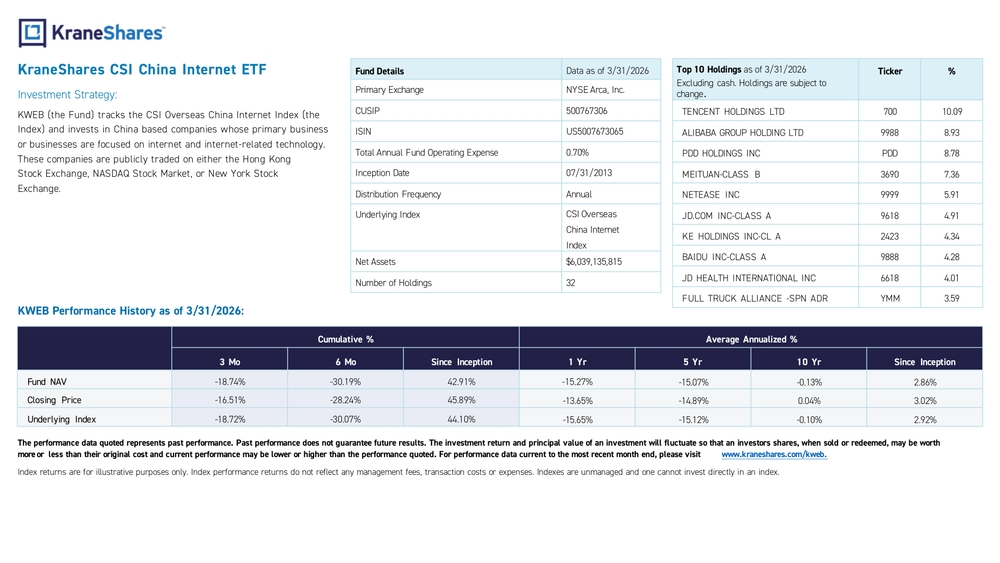
KraneShares CSI China Internet ETF
Investment Strategy:
KWEB (the Fund) tracks the CSI Overseas China Internet Index (the Index) and invests in China based companies whose primary business or businesses are focused on internet and internet-related technology. These companies are publicly traded on either the Hong Kong Stock Exchange, NASDAQ Stock Market, or New York Stock Exchange.
Fund Details (Data as of 3/31/2026)
| Field | Value |
|---|---|
| Primary Exchange | NYSE Arca, Inc. |
| CUSIP | 500767306 |
| ISIN | US5007673065 |
| Total Annual Fund Operating Expense | 0.70% |
| Inception Date | 07/31/2013 |
| Distribution Frequency | Annual |
| Underlying Index | CSI Overseas China Internet Index |
| Net Assets | $6,039,135,815 |
| Number of Holdings | 32 |
Top 10 Holdings as of 3/31/2026
| Company | Ticker | % |
|---|---|---|
| Tencent Holdings Ltd | 700 | 10.09 |
| Alibaba Group Holding Ltd | 9988 | 8.93 |
| PDD Holdings Inc | PDD | 8.78 |
| Meituan-Class B | 3690 | 7.36 |
| NetEase Inc | 9999 | 5.91 |
| JD.com Inc-Class A | 9618 | 4.91 |
| KE Holdings Inc-CL A | 2423 | 4.34 |
| Baidu Inc-Class A | 9888 | 4.28 |
| JD Health International Inc | 6618 | 4.01 |
| Full Truck Alliance -SPN ADR | YMM | 3.59 |
KWEB Performance History as of 3/31/2026
| 3 Mo | 6 Mo | Since Inception (Cumulative) | 1 Yr | 5 Yr | 10 Yr | Since Inception (Annualized) | |
|---|---|---|---|---|---|---|---|
| Fund NAV | -18.74% | -30.19% | 42.91% | -15.27% | -15.07% | -0.13% | 2.86% |
| Closing Price | -16.51% | -28.24% | 45.89% | -13.65% | -14.89% | 0.04% | 3.02% |
| Underlying Index | -18.72% | -30.07% | 44.10% | -15.65% | -15.12% | -0.10% | 2.92% |
Important Notes
The S&P 500 Index: is an American stock market index based on the market capitalizations of 500 large companies having common stock listed on the NYSE or NASDAQ.
The MSCI Emerging Markets Net USD Index: captures large and mid cap representation across 23 Emerging Markets (EM) countries. With 834 constituents, the index covers approximately 85% of the free float-adjusted market capitalization in each country.
The CSI Overseas China Internet Index: The CSI Overseas China Internet Index selects overseas listed Chinese Internet companies as the index constituents; the index is weighted by free float market cap. The index can measure the overall performance of overseas listed Chinese Internet companies. The Index is within the scope of the IOSCO Assurance Report as at 30 September 2018. The index was launched on September 20, 2011.
Price-to-Earnings (P/E): The price-to-earnings ratio (P/E ratio) is the ratio for valuing a company that measures its current share price relative to its per-share earnings (EPS).
Forward Price-to-Earnings (P/E): Forward price-to-earnings (forward P/E) is a version of the ratio of price-to-earnings (P/E) that uses forecasted earnings for the P/E calculation.
Price-to-Book (P/B): Companies use the price-to-book ratio (P/B ratio) to compare a firm's market capitalization to its book value.
Price-to-Cash Flow (P/CF): The price-to-cash flow is a stock valuation indicator or multiple that measures the value of a stock's price relative to its operating cash flow per share.
Gross Domestic Product (GDP): is the total monetary value of all final goods and services produced within a country during a specific period, usually a year or a quarter.
Urbanization Rate: The urbanization rate is the speed at which a country's population is shifting from rural to urban areas, usually measured as the annual percentage change in the share of people living in urban areas.
GDP Per Capita: GDP per capita is the total value of all final goods and services produced in an economy in a given period divided by the population, giving an average economic output per person.
Household Per Capita Annual Disposable Income of Urban & Rural Households: This is the average amount of after-tax income available per person in a household over a year, measured separately for urban and rural households, that can be spent or saved.
Large language models (LLMs): Large language models are advanced AI systems trained on massive text datasets to understand and generate human-like language for tasks such as answering questions, summarizing, and translation.
Important Notes (continued)
Revenue: Revenue is the total amount of money a company earns from its normal business activities, such as selling goods and services, before deducting any costs or expenses.
Average Revenue Growth Rate: The average revenue growth rate is the mean percentage increase (or decrease) in a company's revenue over a specified multi-period timeframe, typically calculated using year-over-year changes.
Net Income: Net income is the profit a company earns after subtracting all expenses, including operating costs, interest, and taxes, from its total revenue over a given period.
Dow Jones US Internet Composite Index: The Dow Jones US Internet Composite Index is a stock market index that tracks the performance of U.S.-listed companies whose primary business is internet-related services and technologies.
YoY Revenue Growth: Year-over-year (YoY) revenue growth is the percentage change in a company's revenue in the current period compared with the same period one year earlier.
Profit Margins: Profit margins are ratios that show what percentage of revenue a company keeps as profit after costs, such as gross, operating, or net profit margin.
Share Buyback Yield: Share buyback yield is the value of a company's share repurchases over a period expressed as a percentage of its market capitalization, indicating how much cash is being returned to shareholders through buybacks.
Important Notes
Carefully consider the Funds' investment objectives, risk factors, charges and expenses before investing. This and additional information can be found in the Funds' full and summary prospectus, which may be obtained by visiting www.kraneshares.com/kweb. Read the prospectus carefully before investing.
Risk Disclosures
Investing involves risk, including possible loss of principal. There can be no assurance that a Fund will achieve its stated objectives. Indices are unmanaged and do not include the effect of fees. One cannot invest directly in an index.
This information should not be relied upon as research, investment advice, or a recommendation regarding any products, strategies, or any security in particular. This material is strictly for illustrative, educational, or informational purposes and is subject to change.
A-Shares are issued by companies in mainland China and traded on local exchanges. They are available to domestic and certain foreign investors, including QFIs and those participating in Stock Connect Programs like Shanghai-Hong Kong and Shenzhen-Hong Kong. Foreign investments in A-Shares face various regulations and restrictions, including limits on asset repatriation.
The Chinese economy is an emerging market, vulnerable to domestic and regional economic and political changes, often showing more volatility than developed markets. U.S.-China tensions raise concerns over tariffs and trade restrictions, which could harm China's exports and the Fund.
The Fund may invest in derivatives, which are often more volatile than other investments and may magnify the Fund's gains or losses.
The Fund may invest in Initial Public Offerings (IPOs). Securities issued in IPOs have no trading history, and information about the companies may be available for very limited periods. KWEB is non-diversified.
ETF shares are bought and sold on an exchange at market price (not NAV) and are not individually redeemed from the Fund. Shares may trade at a premium or discount to their NAV in the secondary market.
The KraneShares ETFs and KFA Funds ETFs are distributed by SEI Investments Distribution Company (SIDCO), 1 Freedom Valley Drive, Oaks, PA 19456, which is not affiliated with Krane Funds Advisors, LLC, the Investment Adviser for the Funds, or any sub-advisers for the Funds.