KEMQ ETF: Emerging Markets Tech ETF | EM ETF | KraneShares
by Kraneshares
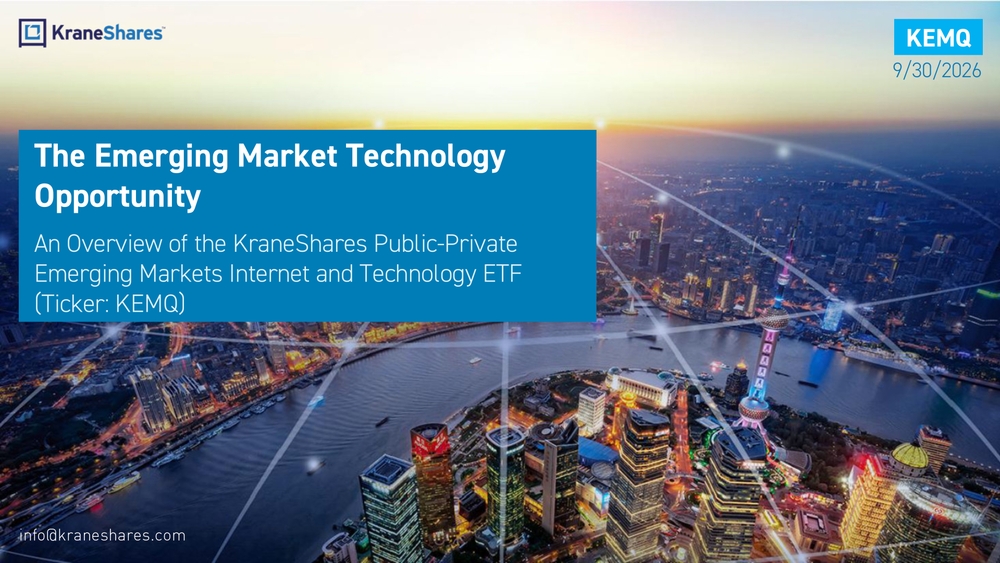
info@kraneshares.comThe Emerging Market Technology Opportunity An Overview of the KraneShares Public -Private Emerging Markets Internet and Technology ETF (Ticker: KEMQ)KEMQ 9/30/2026
Investment Strategy: KEMQ is actively managed and seeks growth of capital through publicly traded and privately offered emerging -market internet and technology investments. Under normal circumstances, at least 80% of net assets (plus investment borrowings) is invested in su ch securities or economically similar instruments. The public -market portion primarily invests in constituents of the Solactive Emerging Marke ts Internet and Technology Index or similar instruments and seeks to track that index before fees and expenses. The Fund intends to inves t approximately 10% of net assets in privately offered securities, measured at the time of investment. Emerging Markets Internet & Technology Highlights: •Internet adoption is expanding within emerging markets while domestic consumption and retail sales are steadily increasing an d frequently taking place online. •In 2025, despite the slowest expansion since the pandemic, the global middle class will surpass 4 billion for the first time, becoming the majority.1 World Data Lab projects this dominance will continue, with another billion+ people joining the middle class within the next decade, reaching 5.7 billion consumer class individuals out of a world population of 8.7 billion.1 •We believe the growth of internet adoption within emerging markets is a long -term secular theme that may continue to play out ov er the course of decades. KEMQ features: •Access to emerging market internet companies that provide similar services as Google, Facebook, PayPal, Amazon, etc. •Exposure to companies that stand to benefit from increasing domestic consumption by emerging markets' growing middle class, irrespective of their country of incorporation. •Exposure to emerging market companies facilitating mobile E -Commerce sales.KEMQ KraneShares Public - Private Emerging Markets Internet and Technology ETF 1.Data from “How the world has achieved middle -class dominance, against the odds,” World Economic Forum, as of 7/18/2025. Adoption and consumption trends are uncertain and can reverse due to economic, regulatory, and geopolitical developments.2
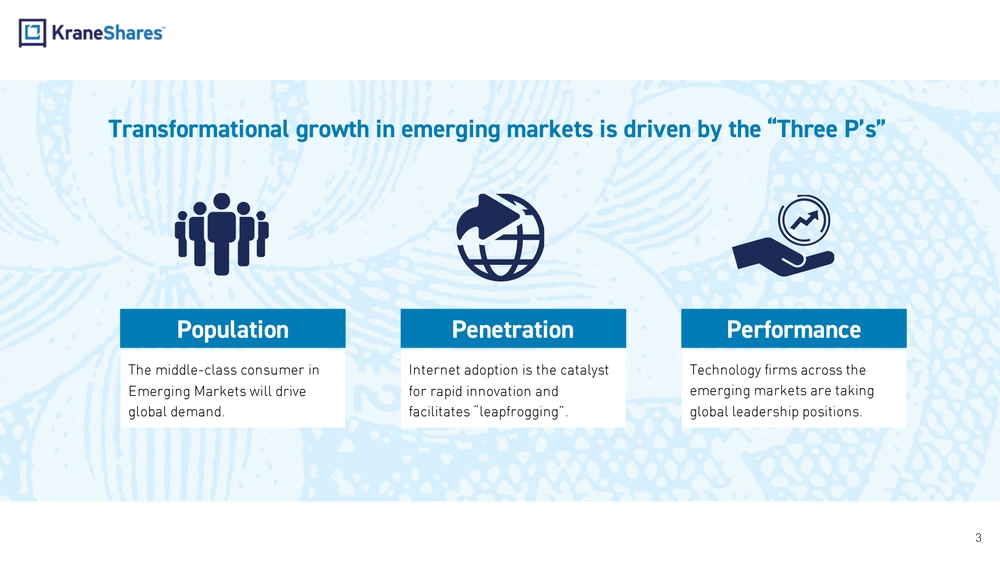
Population The middle -class consumer in Emerging Markets will drive global demand.Penetration Internet adoption is the catalyst for rapid innovation and facilitates “leapfrogging”.Performance Technology firms across the emerging markets are taking global leadership positions. Transformational growth in emerging markets is driven by the “Three P’s” 3
4•Demographics •Urban Middle Class •Consumption•Adoption of Technology & Telecommunications •HealthcareThis is why we buy EM: But this is what we get when we buy broad EM: •Commodities •“Old economy” companies•Slow growth sectors Apple store window with sign in Nanjing East Road with people who often line up to grab on one of the company's latest gadgets. Shanghai China
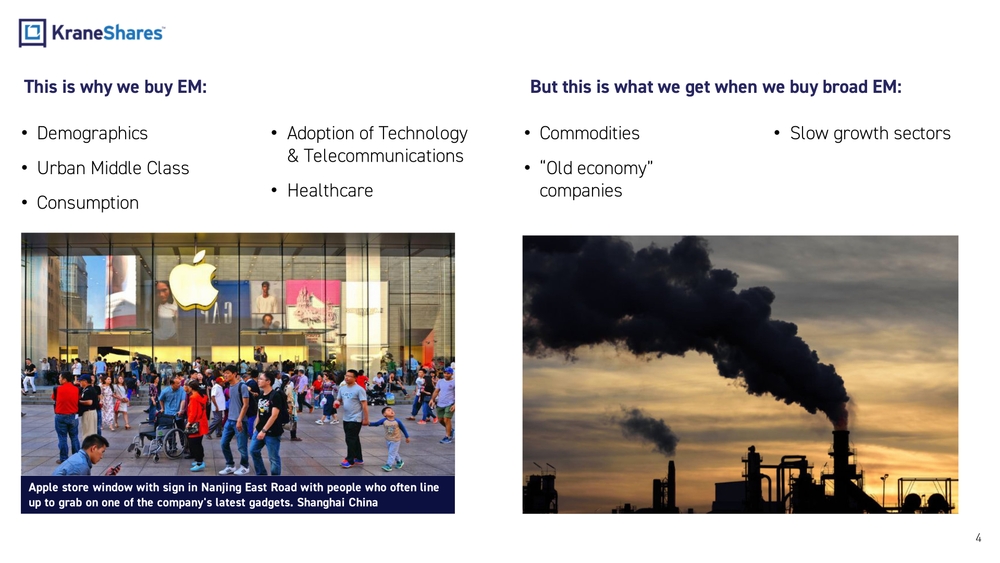
5Broad Emerging Markets have been “out of favor” in the past decade … Data from Bloomberg as of 9/30/2026. See end of presentation for index definitions. Index returns are for illustrative purposes only. Indexes are unmanaged and one cannot invest directly in an index. Index returns do not reflect fees or other costs associated with investing. Past performance does not guarantee future returns . These index returns do not represent actual Fund performance. For actual KEMQ performance, see page 17 or visit https://www.kraneshares.com/etf/kemq/ .05,00010,00015,00020,00025,00030,00035,00040,00045,000 9/30/2016 9/30/2017 9/30/2018 9/30/2019 9/30/2020 9/30/2021 9/30/2022 9/30/2023 9/30/2024 9/30/2025 9/30/2026Growth of 10,000 unitsPerformance of MSCI EM and S&P 500 (9/30/2016 to 9/30/2026) MSCI EM Index S&P 500
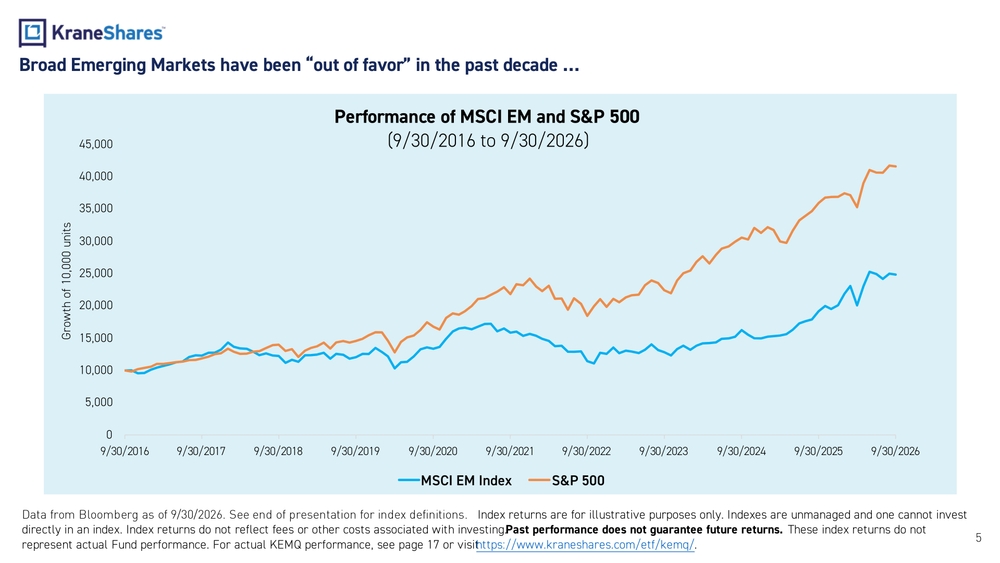
050001000015000200002500030000350004000045000 12/1/2010 3/1/2011 6/1/2011 9/1/2011 12/1/2011 3/1/2012 6/1/2012 9/1/2012 12/1/2012 3/1/2013 6/1/2013 9/1/2013 12/1/2013 3/1/2014 6/1/2014 9/1/2014 12/1/2014 3/1/2015 6/1/2015 9/1/2015 12/1/2015 3/1/2016 6/1/2016 9/1/2016 12/1/2016 3/1/2017 6/1/2017 9/1/2017 12/1/2017 3/1/2018 6/1/2018 9/1/2018 12/1/2018 3/1/2019 6/1/2019 9/1/2019 12/1/2019 3/1/2020 6/1/2020 9/1/2020 12/1/2020 3/1/2021 6/1/2021 9/1/2021 12/1/2021 3/1/2022 6/1/2022 9/1/2022 12/1/2022 3/1/2023 6/1/2023 9/1/2023 12/1/2023 3/1/2024 6/1/2024 9/1/2024 12/1/2024 3/1/2025 6/1/2025 9/1/2025 12/1/2025 3/1/2026 6/1/2026 9/1/2026Growth of 10,000 UnitsEM Consumer Technology vs. MSCI EM Index and S&P 500 EM Consumer Technology S&P 500 Index MSCI Emerging Markets IndexEM consumer/technology has outperformed emerging markets over the past decade. •In order to show the historical performance of the EM consumer/technology sectors within the MSCI EM Index, we combined the Index’s infor mation technology, consumer discretionary, and communication services sectors. We used the sectors’ pre - and post -GICS reclassification weightings pictured in slide 8. •We found that EM consumer/technology outperformed both broad emerging markets since December 2010. 6GICS Reclassification Data from Bloomberg as of 9/30/2026. See end of presentation for index definitions. Index returns are for illustrative purposes only. Indexes are unmanaged and one cannot invest directly in an index. Index returns do not reflect fees or other costs associated with investing. Past performance does not guarantee future returns. These index returns do not represent actual Fund performance. For actual KEMQ performance, see page 17 or visit https://www.kraneshares.com/etf/kemq/ .
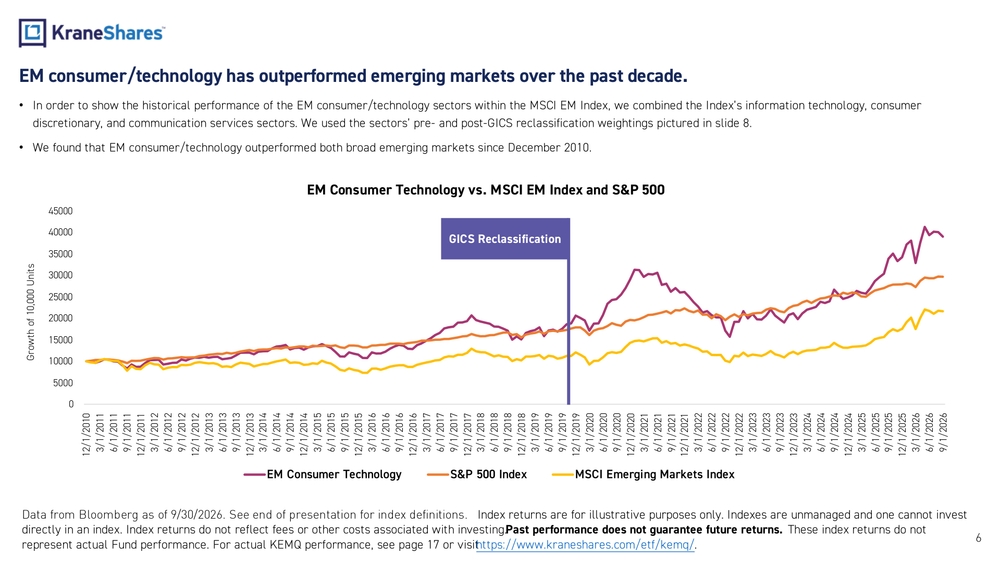
26 eligible countries: Argentina, Brazil, Chile, Colombia, Mexico, Peru, Puerto Rico, Cyprus, Czech Republic, Egypt, Greece, Hungary, Poland, Qatar, Russia, South Africa, Turkey, United Arab Emirates, China, India, Indonesia, South Korea, Malaysia, The Philippines, Taiwan, Thailand Select companies from Internet Retail and Internet Software/Services sub -sector and micro -sectors involved in the purchase, payment processing, and software for internet and e -commerce transactions To mitigate exposure to any one company, constituents are capped at 3.5%. Under normal circumstances, at least 80% of net assets (plus investment borrowings) is invested in such securities or economi cally similar instruments. The public -market portion primarily invests in constituents of the Solactive Emerging Markets Internet and Technology Index or similar instruments and seeks to track that index before fees and expenses. The Fund intends to invest approximately 10% of net assets in privately offered securities, measured at the time of investment.Minimum 3 -month average daily trading volume of $1 million USD Minimum Market Cap of 1 billion USD Country Eligibility* Stock Size & Trading Minimums Industry & Sub -sector Selection Ensure Proper Diversification KEMQFiltering Process for Index Constituent SelectionIn order to deliver a precise representation of the emerging markets consumer technology opportunity, we worked with Solactive to develop the Solactive Emerging Markets Internet and Technology Index. Diversification does not ensure a profit or guarantee against a loss. 7 *The index may also include companies incorporated in countries outside of the eligible list that derive significant revenue from one or more of the countries in the eligible list.
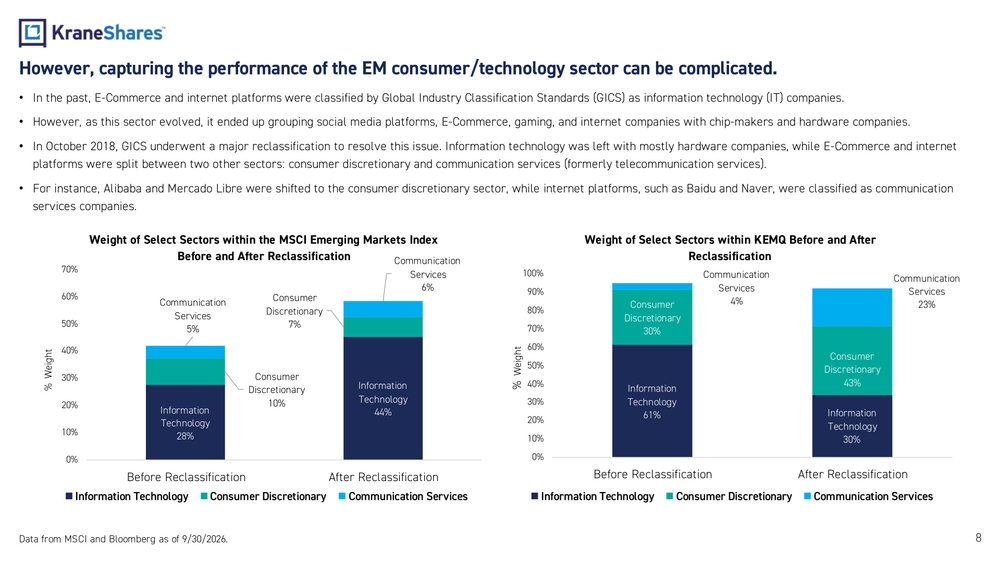
However, capturing the performance of the EM consumer/technology sector can be complicated. •In the past, E -Commerce and internet platforms were classified by Global Industry Classification Standards (GICS) as information technology (IT) companies. •However, as this sector evolved, it ended up grouping social media platforms, E -Commerce, gaming, and internet companies with ch ip-makers and hardware companies. •In October 2018, GICS underwent a major reclassification to resolve this issue. Information technology was left with mostly h ardware companies, while E -Commerce and internet platforms were split between two other sectors: consumer discretionary and communication services (formerly telecommunication services). •For instance, Alibaba and Mercado Libre were shifted to the consumer discretionary sector, while internet platforms, such as Baidu and Naver, were classified as communication services companies. 8 Data from MSCI and Bloomberg as of 9/30/2026. Information Technology 28%Information Technology 44%Consumer Discretionary 10%Consumer Discretionary 7%Communication Services 5%Communication Services 6% 0%10%20%30%40%50%60%70% Before Reclassification After ReclassificationWeight of Select Sectors within the MSCI Emerging Markets Index Before and After Reclassification Information Technology Consumer Discretionary Communication Services% Weight Information Technology 61% Information Technology 30%Consumer Discretionary 30%Communication Services 23%Communication Services 4% Consumer Discretionary 43% 0%10%20%30%40%50%60%70%80%90%100% Before Reclassification After ReclassificationWeight of Select Sectors within KEMQ Before and After Reclassification Information Technology Consumer Discretionary Communication Services% Weight
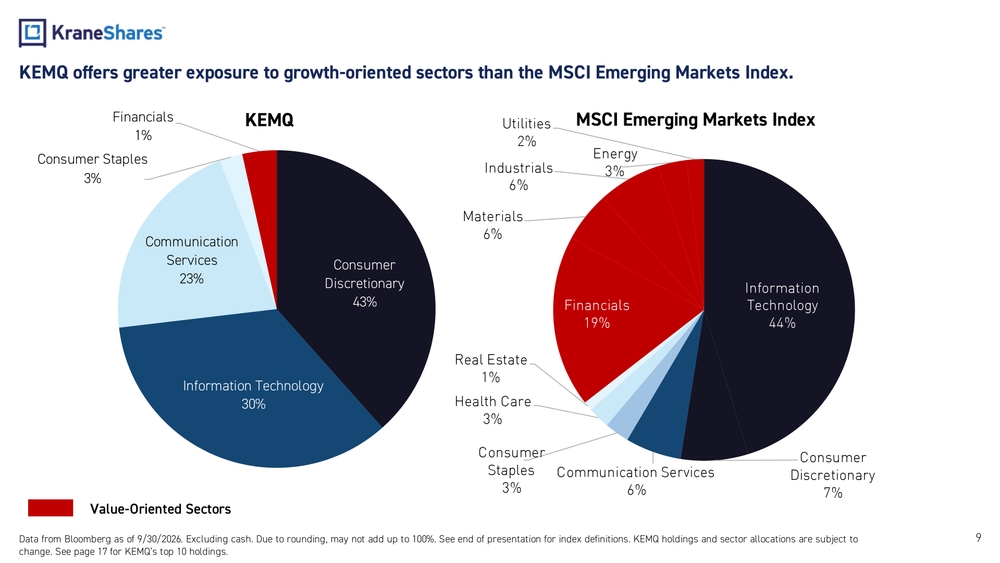
Information Technology 30%Consumer Discretionary 43%Communication Services 23%Consumer Staples 3%Financials 1%KEMQKEMQ offers greater exposure to growth -oriented sectors than the MSCI Emerging Markets Index. 9 Data from Bloomberg as of 9/30/2026. Excluding cash. Due to rounding, may not add up to 100%. See end of presentation for ind ex definitions. KEMQ holdings and sector allocations are subject to change. See page 17 for KEMQ’s top 10 holdings.Value -Oriented SectorsInformation Technology 44% Consumer Discretionary 7%Communication Services 6%Consumer Staples 3%Health Care 3%Real Estate 1%Financials 19%Materials 6%Industrials 6%Energy 3%Utilities 2%MSCI Emerging Markets Index
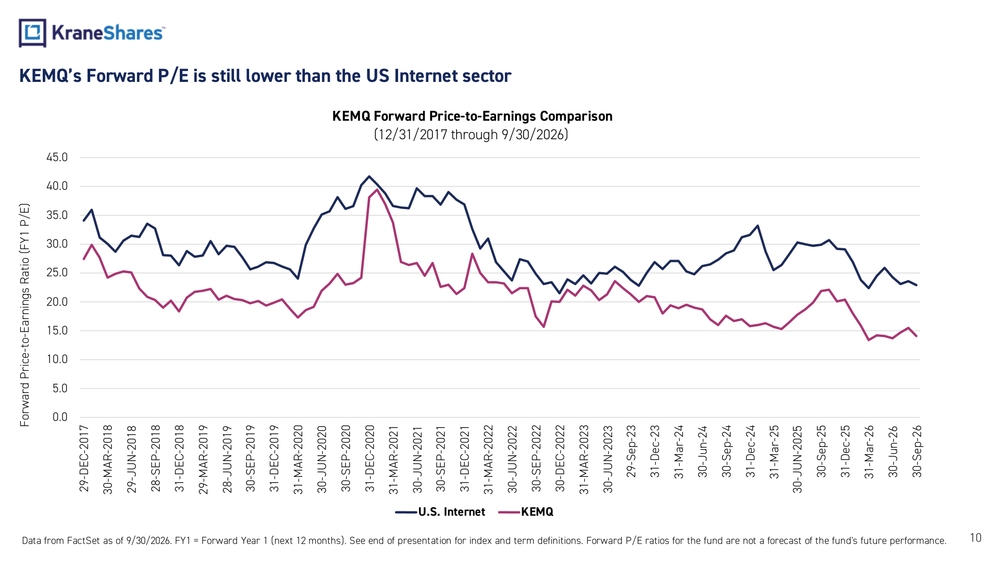
10 Data from FactSet as of 9/30/2026. FY1 = Forward Year 1 (next 12 months). See end of presentation for index and term definitions. Forward P/E ratios for the fund are not a forecast of the fund's future performance. KEMQ’s Forward P/E is still lower than the US Internet sector 0.05.010.015.020.025.030.035.040.045.0 29-DEC-2017 30-MAR-2018 29-JUN-2018 28-SEP-2018 31-DEC-2018 29-MAR-2019 28-JUN-2019 30-SEP-2019 31-DEC-2019 31-MAR-2020 30-JUN-2020 30-SEP-2020 31-DEC-2020 31-MAR-2021 30-JUN-2021 30-SEP-2021 31-DEC-2021 31-MAR-2022 30-JUN-2022 30-SEP-2022 30-DEC-2022 31-MAR-2023 30-JUN-2023 29-Sep-23 31-Dec-23 31-Mar-24 30-Jun-24 30-Sep-24 31-Dec-24 31-Mar-25 30-JUN-2025 30-Sep-25 31-Dec-25 31-Mar-26 30-Jun-26 30-Sep-26Forward Price -to-Earnings Ratio (FY1 P/E)KEMQ Forward Price -to-Earnings Comparison (12/31/2017 through 9/30/2026) U.S. Internet KEMQ
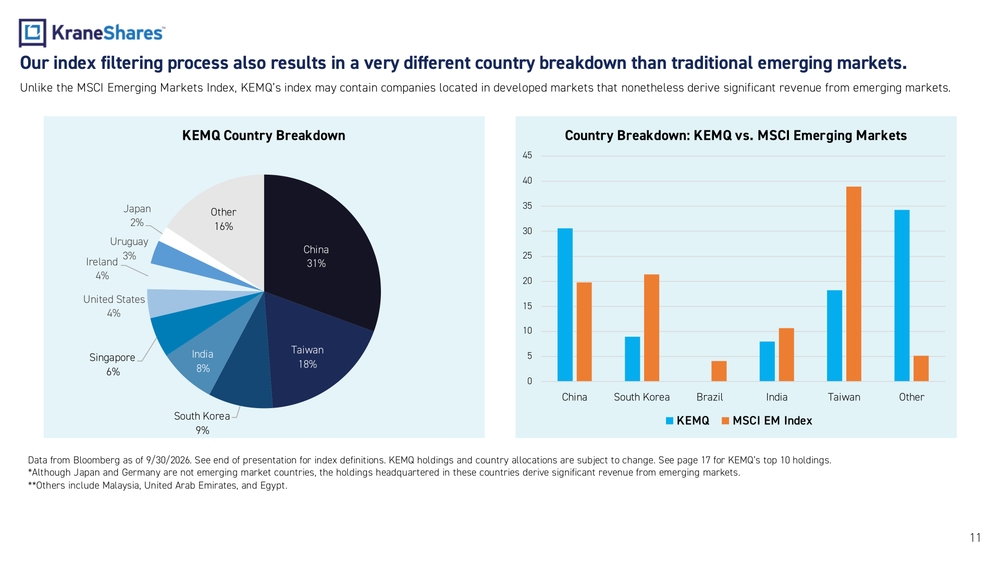
Our index filtering process also results in a very different country breakdown than traditional emerging markets. Unlike the MSCI Emerging Markets Index, KEMQ’s index may contain companies located in developed markets that nonetheless deri ve significant revenue from emerging markets. Data from Bloomberg as of 9/30/2026. See end of presentation for index definitions. KEMQ holdings and country allocations are subject to change. See page 17 for KEMQ’s top 10 holdings. *Although Japan and Germany are not emerging market countries, the holdings headquartered in these countries derive significa nt revenue from emerging markets. **Others include Malaysia, United Arab Emirates, and Egypt. 11China 31% Taiwan 18% South Korea 9%India 8%Singapore 6%United States 4%Ireland 4%Uruguay 3%Japan 2%Other 16%KEMQ Country Breakdown 051015202530354045 China South Korea Brazil India Taiwan OtherCountry Breakdown: KEMQ vs. MSCI Emerging Markets KEMQ MSCI EM Index
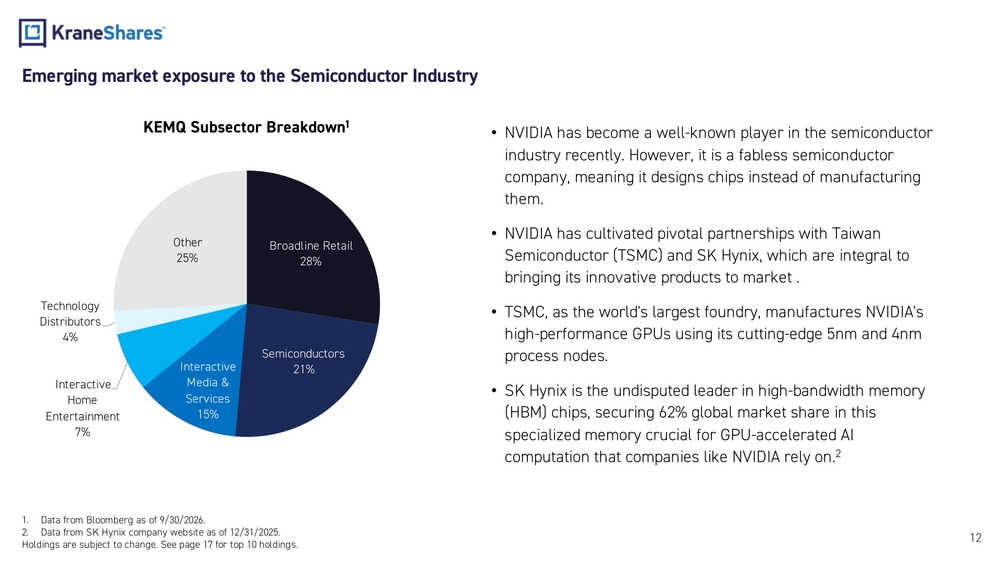
Emerging market exposure to the Semiconductor Industry 12•NVIDIA has become a well -known player in the semiconductor industry recently. However, it is a fabless semiconductor company, meaning it designs chips instead of manufacturing them. •NVIDIA has cultivated pivotal partnerships with Taiwan Semiconductor (TSMC) and SK Hynix, which are integral to bringing its innovative products to market . •TSMC, as the world's largest foundry, manufactures NVIDIA's high-performance GPUs using its cutting -edge 5nm and 4nm process nodes. •SK Hynix is the undisputed leader in high -bandwidth memory (HBM) chips, securing 62% global market share in this specialized memory crucial for GPU -accelerated AI computation that companies like NVIDIA rely on.2 1.Data from Bloomberg as of 9/30/2026. 2.Data from SK Hynix company website as of 12/31/2025. Holdings are subject to change. See page 17 for top 10 holdings.Broadline Retail 28% Semiconductors 21% Interactive Media & Services 15%Interactive Home Entertainment 7%Technology Distributors 4%Other 25%KEMQ Subsector Breakdown1
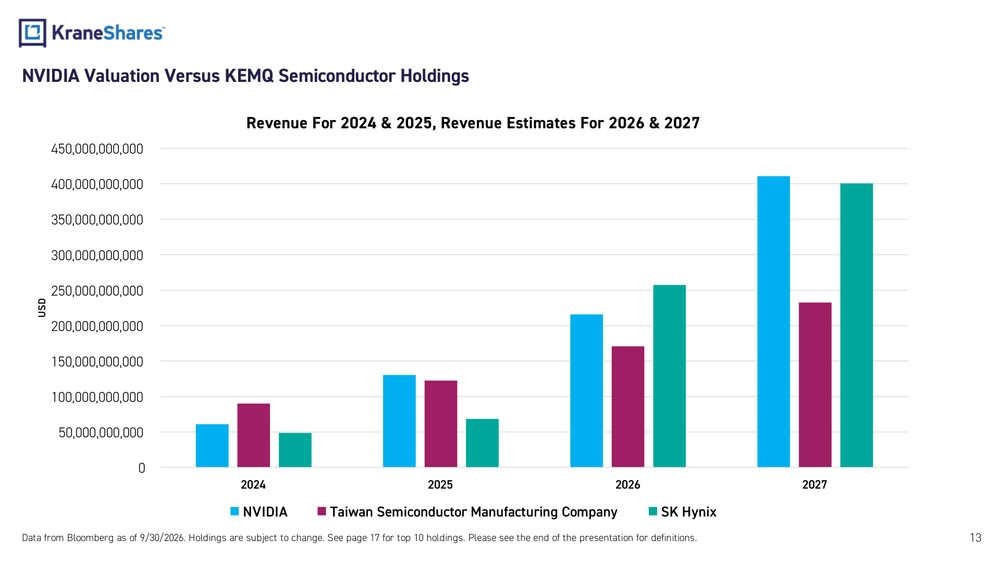
NVIDIA Valuation Versus KEMQ Semiconductor Holdings 13050,000,000,000100,000,000,000150,000,000,000200,000,000,000250,000,000,000300,000,000,000350,000,000,000400,000,000,000450,000,000,000 2024 2025 2026 2027USDRevenue For 2024 & 2025, Revenue Estimates For 2026 & 2027 NVIDIA Taiwan Semiconductor Manufacturing Company SK Hynix Data from Bloomberg as of 9/30/2026. Holdings are subject to change. See page 17 for top 10 holdings. Please see the end of t he presentation for definitions.
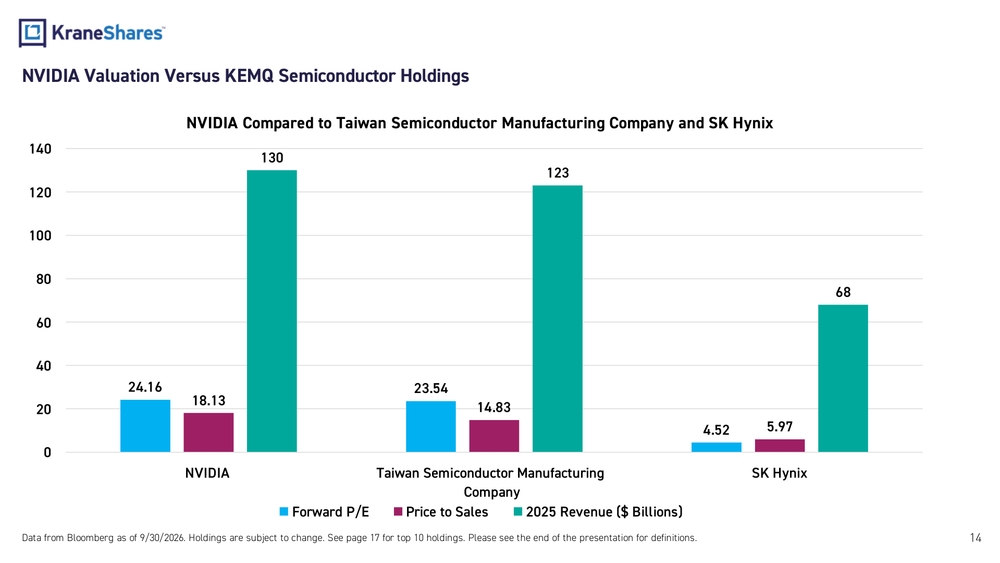
NVIDIA Valuation Versus KEMQ Semiconductor Holdings 1424.16 23.54 4.5218.1314.83 5.97130 123 68 020406080100120140 NVIDIA Taiwan Semiconductor Manufacturing CompanySK HynixNVIDIA Compared to Taiwan Semiconductor Manufacturing Company and SK Hynix Forward P/E Price to Sales 2025 Revenue ($ Billions) Data from Bloomberg as of 9/30/2026. Holdings are subject to change. See page 17 for top 10 holdings. Please see the end of t he presentation for definitions.
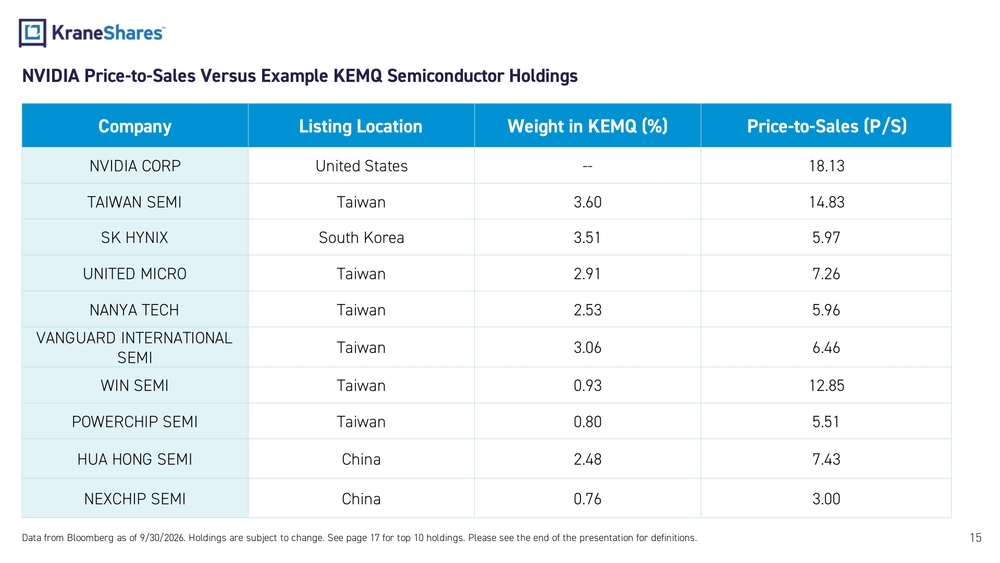
NVIDIA Price -to-Sales Versus Example KEMQ Semiconductor Holdings 15Company Listing Location Weight in KEMQ (%) Price -to-Sales (P/S) NVIDIA CORP United States -- 18.13 TAIWAN SEMI Taiwan 3.60 14.83 SK HYNIX South Korea 3.51 5.97 UNITED MICRO Taiwan 2.91 7.26 NANYA TECH Taiwan 2.53 5.96 VANGUARD INTERNATIONAL SEMITaiwan 3.06 6.46 WIN SEMI Taiwan 0.93 12.85 POWERCHIP SEMI Taiwan 0.80 5.51 HUA HONG SEMI China 2.48 7.43 NEXCHIP SEMI China 0.76 3.00 Data from Bloomberg as of 9/30/2026. Holdings are subject to change. See page 17 for top 10 holdings. Please see the end of t he presentation for definitions.
We believe using KEMQ to augment or replace an existing exposure to broad EM may provide performance benefits. 16Investor Type Hypothetical Portfolio Hypothetical Investor 1: No EM Exposure Current Allocation: 0% Hypothetical Investor 2: Some EM Exposure Current Allocation: 3-5% Hypothetical Investor 3: Significant EM Exposure Current Allocation: 20%EM Growth 3-5% Broad - Based EM 15-17%Other 80-82%Hypothetical Portfolio 3Other 100%Hypothetical Portfolio 1 EM Growth 3-5% Other 95-97%Hypothetical Portfolio 2•We have found that investors tend to fall into one of three camps: no EM exposure, some exposure, or significant exposure. •We have mapped out how KEMQ (EM Growth) may fit into each of these three investors’ portfolios. Hypothetical allocations are for illustrative purposes only, do not represent actual portfolios or actual performance, and ar e not investment recommendations. There is no assurance that adding or substituting KEMQ will improve performance. Investing involves risk, including possible loss of prin cipal.
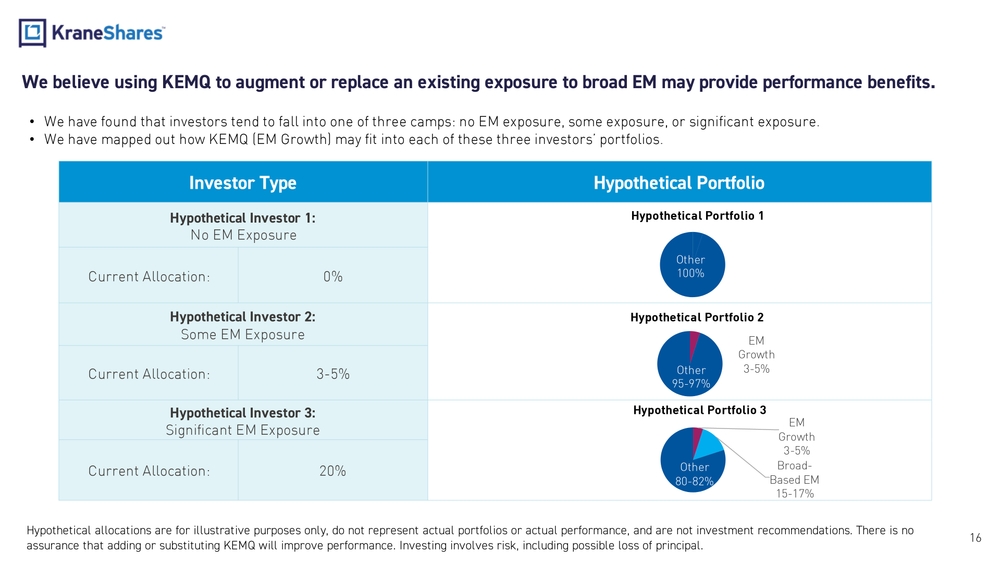
KraneShares Public -Private Emerging Markets Internet andTechnology ETF Investment Strategy: KEMQ is actively managed and seeks growth of capital through publicly traded and privately offered emerging -market internet and technology investments. Under normal circumstances, at least 80% of net assets (plus investment borrowings) is invested in such securities or economically similar instruments. The public -market portion primarily invests in constituents of the Solactive Emerging Markets Internet and Technology Index or similar instruments and seeks to track that index before fees and expenses. The Fund intends to invest approximately 10% of net assets in privately offered securities, measured at the time of investment.Fund Details Data as of 09/30/2026 Primary Exchange NYSE Arca, Inc. CUSIP 500767876 ISIN US5007678767 Total Annual Fund Operating Expense (Gross) 0.79% Total Annual Fund Operating Expense (Net)* 0.49% Inception Date 10/11/2017 Distribution Frequency Annual Underlying Index Solactive Emerging Markets Internet and Technology Index Number ofHoldings 66Top 10 Holdings as of 09/30/2026 Holdings are subject to change.Ticker % NETEASE INC 9999 3.71 TAIWAN SEMICONDUCTOR MANUFAC 2330 3.60 TENCENT HOLDINGS LTD 700 3.57 PDD HOLDINGS INC PDD 3.55 ALIBABA GROUP HOLDING LTD 9988 3.53 SK HYNIX INC 000660 3.51 PROSUS NV PRX 3.48 MERCADOLIBRE INC MELI 3.26 MEITUAN -CLASS B 3690 3.22 SEA LTD-ADR SE 3.12 KEMQ Performance History asof09/30/2026: Cumulative % Average Annualized % 3Mo 6Mo Since Inception 1Yr 3Yr 5Yr Since Inception Fund NAV -2.26% 14.36% 11.41% -0.08% 23.46% -0.23% 1.21% Closing Price -4.02% 9.58% 10.20% -0.94% 23.54% -0.35% 1.09% Underlying Index -1.95% 14.81% 20.39% 0.78% 23.55% 0.32% 2.09% The performance data quoted represents past performance. Past performance does not guarantee future results. The investment return and principal value of an investment will fluctuate so that an investor’s shares, when sold or redeemed, may be worth more or less than their original cost and current performance may be lower or higher than the performance quoted. For performance data current to the most recent month end, please visit www.kraneshares.com/etf/kemq/ . Index returns are for illustrative purposes only. Index performance returns do not reflect any management fees, transaction costs or expenses. Indexes are unmanaged and one cannot invest directly in an index . NAV returns are based on net asset value. Market -price returns from December 23, 2020 use the official closing price, or, if unavailable, the NBBO midpoint when NAV is calculated. Earlier market - price returns use the bid/ask midpoint. NAV is calculated as of 4:00 p.m. Eastern Time. Returns do not represent results from trading at other times. See page 23 for ETF trading information. *Fee waivers are contractual and in effect until August 1, 202817
KraneShares Empowering investors with access to the world’ s most powerful growth themes through ETFs, private strategies, and innovative investment solutions. 18
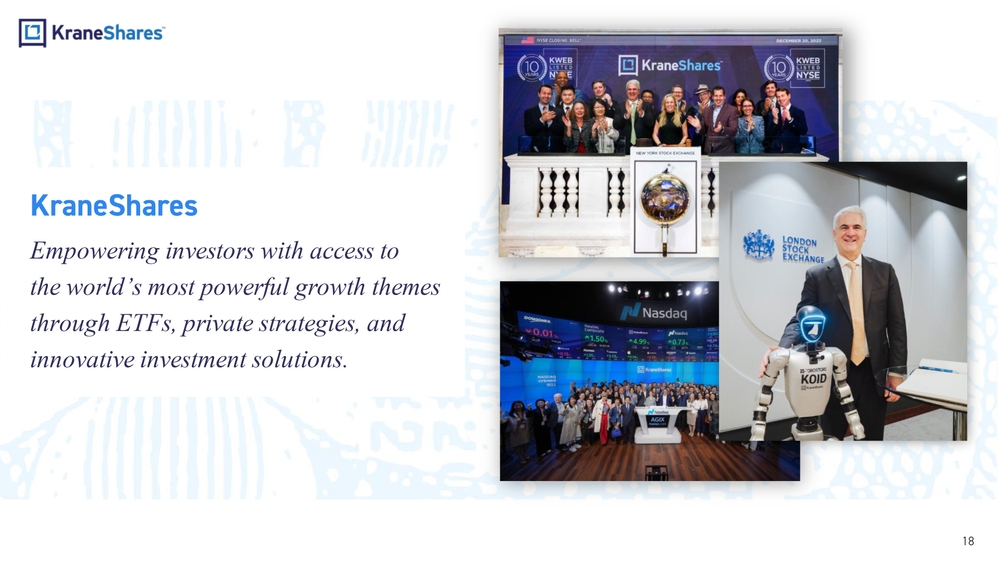
TORK China, Emerging Markets & Regional Alternatives Income & Covered Call AI, Robotics & Emerging Technology KURE Healthcare KGRN Clean Technology KTEC Hang Seng Tech KCAI China Onshore Alpha IndexAGIX Public -Private AI & TechnologyChina Suite Future TechBroader Emerging Markets KEMQ Emerging Markets Internet & Tech KPHO Dragon Capital Vietnam GrowthKEMX MSCI Emerging Markets ex China U.S. & Developed Markets KVLE Value Line® Dynamic Dividend EquityHedgeye Hedged Equity KSPY Man Buyout Beta Index BUYO Fixed Income BNDD Quadratic Deflation ETFIVOLQuadratic Interest Rate Volatility & Inflation Hedge KHYB Asia High Income USD BondSustainable Ultra Short Duration KCSHCarbon CreditsKPDD 2X Long PDD Daily KJD 2X Long JD DailyKBAB 2X Long BABA Daily KMLI 2X Long MELI Daily Covered Call & Options Income Managed Futures KMLM Mount Lucas Managed Futures KWIN Wahed Alternative IncomeKLIP China Internet & Covered Call Outcome Based Equity KIQQ Nasdaq Buffer & Option IncomeLevered & High - Conviction Exposure KBUF 90% KWEB Defined Outcome100% KWEB Defined Outcome KPRO Alternative Income Extensive ETF Product Suite Spanning High Growth Sectors KWEB Internet & E -Commerce KOID Humanoid Robotics & Physical AI Strategy also available in UCITS / ETCKBDU 2X Long BIDU DailyChina A Shares KBA / CHIN KSTR STAR Market Global Carbon Strategy KRBN KCCA California Carbon AllowanceElectric Vehicles & Future Mobility KARS LUMA Photonics & Optical Technology KAIT AI Infrastructure Technology TORK Actuators & Physical Hardware 19
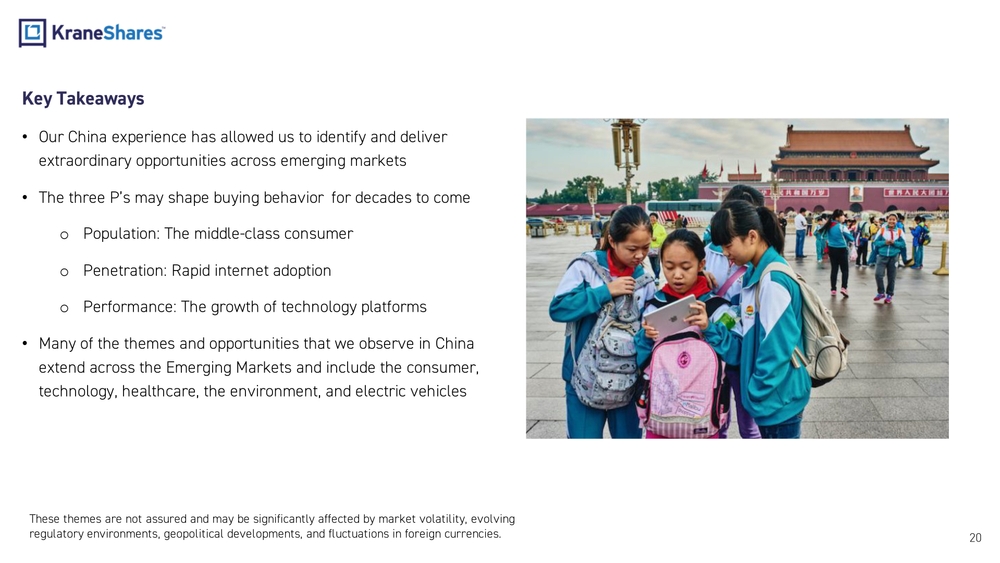
Key Takeaways •Our China experience has allowed us to identify and deliver extraordinary opportunities across emerging markets •The three P’s may shape buying behavior for decades to come oPopulation: The middle -class consumer oPenetration: Rapid internet adoption oPerformance: The growth of technology platforms •Many of the themes and opportunities that we observe in China extend across the Emerging Markets and include the consumer, technology, healthcare, the environment, and electric vehicles 20These themes are not assured and may be significantly affected by market volatility, evolving regulatory environments, geopolitical developments, and fluctuations in foreign currencies.
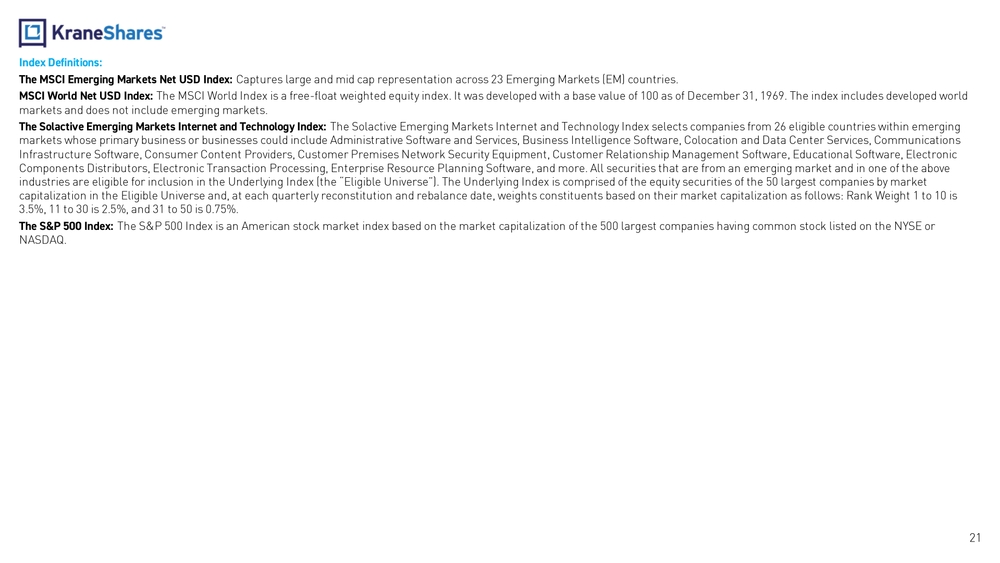
Index Definitions: The MSCI Emerging Markets Net USD Index: Captures large and mid cap representation across 23 Emerging Markets (EM) countries. MSCI World Net USD Index: The MSCI World Index is a free -float weighted equity index. It was developed with a base value of 100 as of December 31, 1969. The index includes developed world markets and does not include emerging markets. The Solactive Emerging Markets Internet and Technology Index: The Solactive Emerging Markets Internet and Technology Index selects companies from 26 eligible countries within emerging markets whose primary business or businesses could include Administrative Software and Services, Business Intelligence Softwa re, Colocation and Data Center Services, Communications Infrastructure Software, Consumer Content Providers, Customer Premises Network Security Equipment, Customer Relationship Mana gem ent Software, Educational Software, Electronic Components Distributors, Electronic Transaction Processing, Enterprise Resource Planning Software, and more. All securities t hat are from an emerging market and in one of the above industries are eligible for inclusion in the Underlying Index (the “Eligible Universe”). The Underlying Index is comprised of the equity securities of the 50 largest companies by market capitalization in the Eligible Universe and, at each quarterly reconstitution and rebalance date, weights constituents based on their market capitalization as follows: Rank Weight 1 to 10 is 3.5%, 11 to 30 is 2.5%, and 31 to 50 is 0.75%. The S&P 500 Index: The S&P 500 Index is an American stock market index based on the market capitalization of the 500 largest companies having co mmon stock listed on the NYSE or NASDAQ. 21
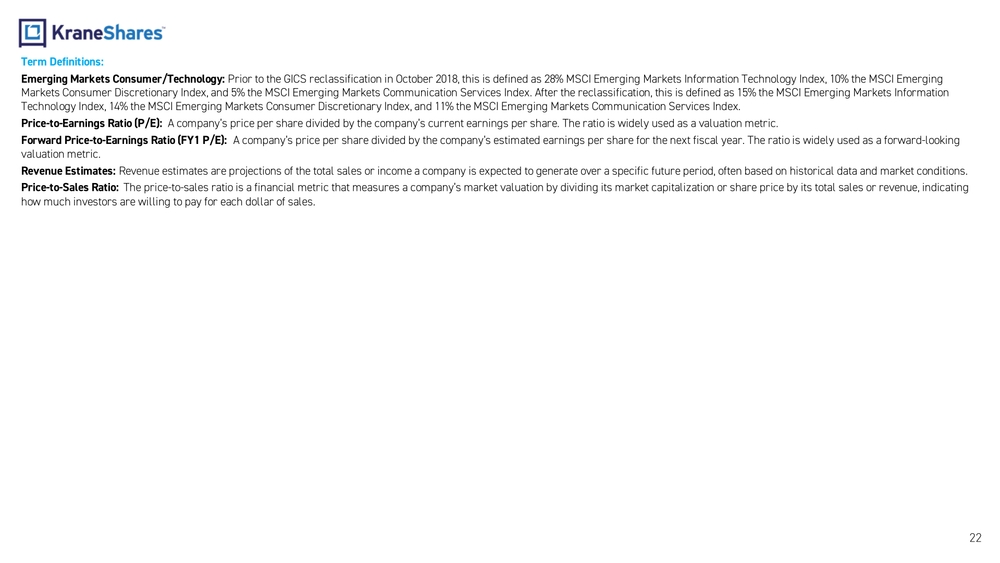
22Term Definitions: Emerging Markets Consumer/Technology: Prior to the GICS reclassification in October 2018, this is defined as 28% MSCI Emerging Markets Information Technology Index , 10% the MSCI Emerging Markets Consumer Discretionary Index, and 5% the MSCI Emerging Markets Communication Services Index. After the reclassificati on, this is defined as 15% the MSCI Emerging Markets Information Technology Index, 14% the MSCI Emerging Markets Consumer Discretionary Index, and 11% the MSCI Emerging Markets Communication Services Index. Price -to-Earnings Ratio (P/E): A company’s price per share divided by the company’s current earnings per share. The ratio is widely used as a valuation metr ic. Forward Price -to-Earnings Ratio (FY1 P/E): A company’s price per share divided by the company’s estimated earnings per share for the next fiscal year. The ratio is wide ly used as a forward -looking valuation metric. Revenue Estimates: Revenue estimates are projections of the total sales or income a company is expected to generate over a specific future perio d, often based on historical data and market conditions. Price -to-Sales Ratio: The price -to-sales ratio is a financial metric that measures a company’s market valuation by dividing its market capitalization or share price by its total sales or revenue, indicating how much investors are willing to pay for each dollar of sales.
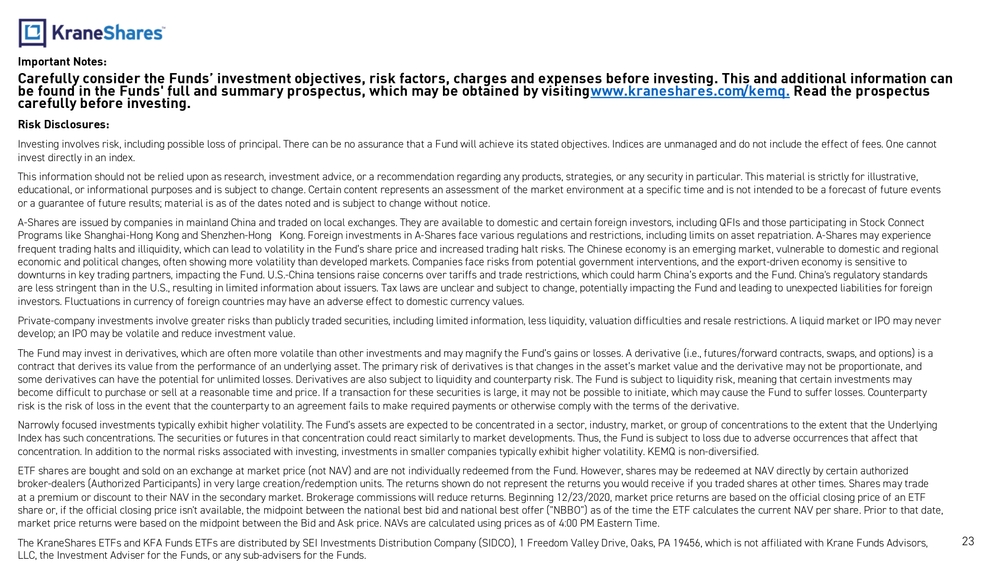
Important Notes: Carefully consider the Funds’ investment objectives, risk factors, charges and expenses before investing. This and additional information can be found in the Funds' full and summary prospectus, which may be obtained by visiting www.kraneshares.com /kemq .Read the prospectus carefully before investing. Risk Disclosures: Investing involves risk, including possible loss of principal. There can be no assurance that a Fund will achieve its stated objectives. Indices are unmanaged and do not include the effect of fees. One cannot invest directly in an index. This information should not be relied upon as research, investment advice, or a recommendation regarding any products, strate gies, or any security in particular . This material is strictly for illustrative, educational, or informational purposes and is subject to change. Certain content represents an assessment of the market envir onment at a specific time and is not intended to be a forecast of future events or a guarantee of future results; material is as of the dates noted and is subject to change without notice. A-Shares are issued by companies in mainland China and traded on local exchanges. They are available to domestic and certain fo reign investors, including QFIs and those participating in Stock Connect Programs like Shanghai -Hong Kong and Shenzhen -Hong Kong. Foreign investments in A -Shares face various regulations and restricti ons, including limits on asset repatriation. A -Shares may experience frequent trading halts and illiquidity, which can lead to volatility in the Fund’s share price and increased trading halt ris ks. The Chinese economy is an emerging market, vulnerable to domestic and regional economic and political changes, often showing more volatility than developed markets. Companies face risks from potential gov ernment interventions, and the export -driven economy is sensitive to downturns in key trading partners, impacting the Fund. U.S. -China tensions raise concerns over tariffs and trade restrictions, w hich could harm China’s exports and the Fund. China's regulatory standards are less stringent than in the U.S., resulting in limited information about issuers. Tax laws are unclear and subject to chan ge, potentially impacting the Fund and leading to unexpected liabilities for foreign investors. Fluctuations in currency of foreign countries may have an adverse effect to domestic currency values . Private -company investments involve greater risks than publicly traded securities, including limited information, less liquidity , valuation difficulties and resale restrictions. A liquid market or IPO may never develop; an IPO may be volatile and reduce investment value. The Fund may invest in derivatives, which are often more volatile than other investments and may magnify the Fund’s gains or losses. A derivative (i.e., futures/forward contracts, swaps, and options) is a contract that derives its value from the performance of an underlying asset. The primary risk of derivatives is that changes in the asset’s market value and the derivative may not be proportionate, and some derivatives can have the potential for unlimited losses. Derivatives are also subject to liquidity and counterparty risk . The Fund is subject to liquidity risk, meaning that certain investments may become difficult to purchase or sell at a reasonable time and price. If a transaction for these securities is large, it may n ot be possible to initiate, which may cause the Fund to suffer losses. Counterparty risk is the risk of loss in the event that the counterparty to an agreement fails to make required payments or otherwise comply with the terms of the derivative. Narrowly focused investments typically exhibit higher volatility. The Fund’s assets are expected to be concentrated in a sect or, industry, market, or group of concentrations to the extent that the Underlying Index has such concentrations. The securities or futures in that concentration could react similarly to market developments. Thus, the Fund is subject to loss due to adverse occurrences that affect that concentration. In addition to the normal risks associated with investing, investments in smaller companies typically exhibit higher volatility . KEMQ is non -diversified. ETF shares are bought and sold on an exchange at market price (not NAV) and are not individually redeemed from the Fund. Howe ver, shares may be redeemed at NAV directly by certain authorized broker -dealers (Authorized Participants) in very large creation/redemption units. The returns shown do not represent the returns you would receive if you traded shares at other times. Shares may trade at a premium or discount to their NAV in the secondary market. Brokerage commissions will reduce returns. Beginning 12/23/202 0, market price returns are based on the official closing price of an ETF share or, if the official closing price isn't available, the midpoint between the national best bid and national best offer ( "NBBO") as of the time the ETF calculates the current NAV per share. Prior to that date, market price returns were based on the midpoint between the Bid and Ask price. NAVs are calculated using prices as of 4:00 PM Eastern Time. The KraneShares ETFs and KFA Funds ETFs are distributed by SEI Investments Distribution Company (SIDCO), 1 Freedom Valley Dri ve, Oaks, PA 19456, which is not affiliated with Krane Funds Advisors, LLC, the Investment Adviser for the Funds, or any sub -advisers for the Funds.23