Vietnam ETF: Exposure to Vietnam Market Leaders | KPHO
by Kraneshares
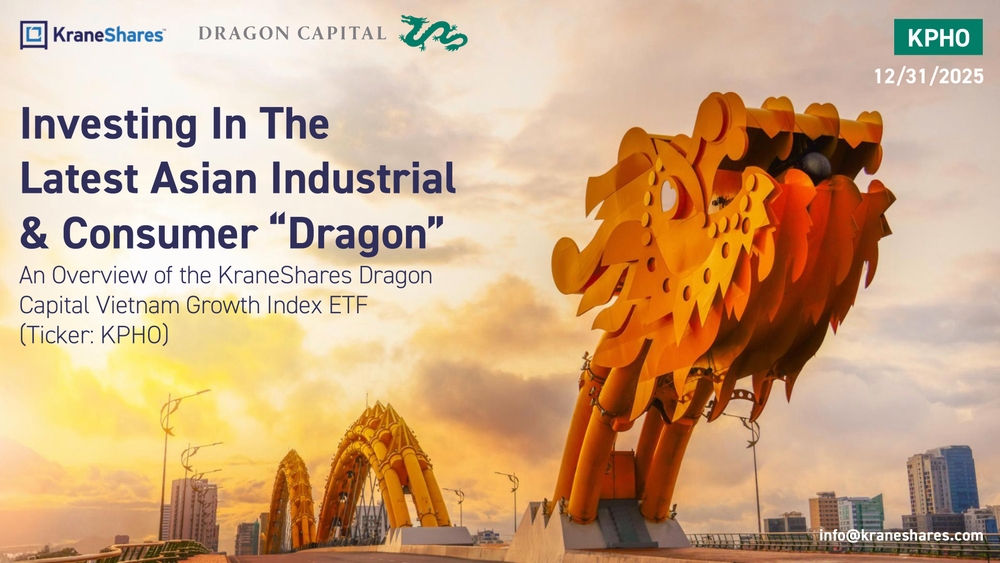
Investing In The Latest Asian Industrial & Consumer "Dragon"
An Overview of the KraneShares Dragon Capital Vietnam Growth Index ETF (Ticker: KPHO)
Introduction to KraneShares
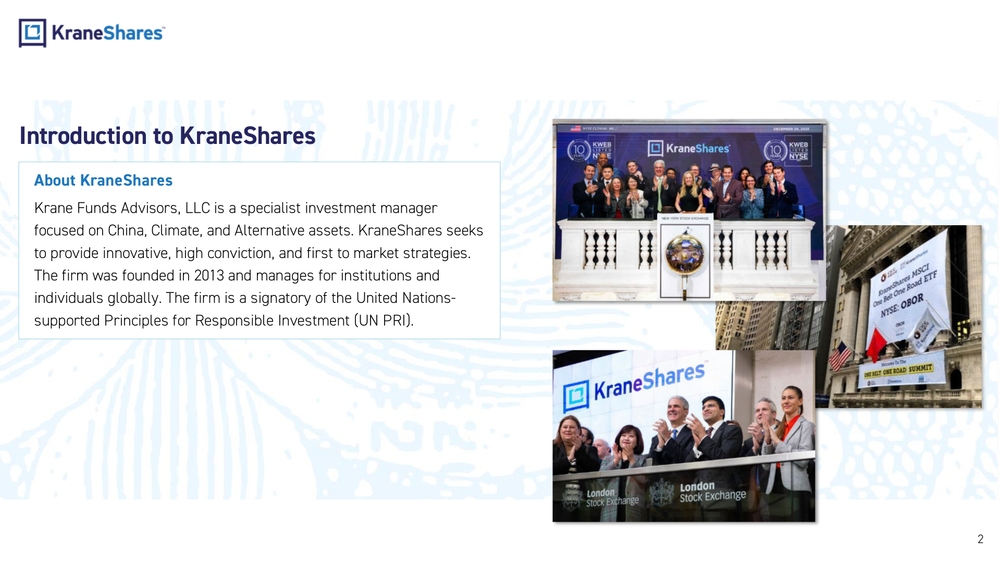
About KraneShares
Krane Funds Advisors, LLC is a specialist investment manager focused on China, Climate, and Alternative assets. KraneShares seeks to provide innovative, high conviction, and first to market strategies. The firm was founded in 2013 and manages for institutions and individuals globally. The firm is a signatory of the United Nations-supported Principles for Responsible Investment (UN PRI).
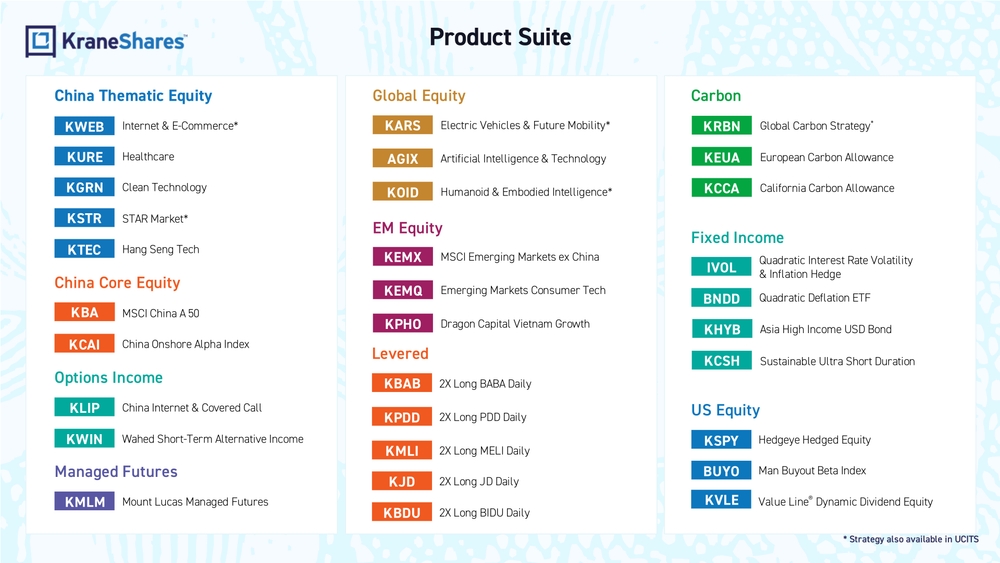
Product Suite
China Thematic Equity
- KWEB: Internet & E-Commerce*
- KURE: Healthcare
- KGRN: Clean Technology
- KSTR: STAR Market*
- KTEC: Hang Seng Tech
China Core Equity
- KBA: MSCI China A 50
- KCAI: China Onshore Alpha Index
Options Income
- KLIP: China Internet & Covered Call
- KWIN: Wahed Short-Term Alternative Income
Managed Futures
- KMLM: Mount Lucas Managed Futures
Global Equity
- KARS: Electric Vehicles & Future Mobility*
- AGIX: Artificial Intelligence & Technology
- KOID: Humanoid & Embodied Intelligence*
EM Equity
- KEMX: MSCI Emerging Markets ex China
- KEMQ: Emerging Markets Consumer Tech
- KPHO: Dragon Capital Vietnam Growth
Levered
- KBAB: 2X Long BABA Daily
- KPDD: 2X Long PDD Daily
- KMLI: 2X Long MELI Daily
- KJD: 2X Long JD Daily
- KBDU: 2X Long BIDU Daily
Carbon
- KRBN: Global Carbon Strategy*
- KEUA: European Carbon Allowance
- KCCA: California Carbon Allowance
Fixed Income
- IVOL: Quadratic Interest Rate Volatility & Inflation Hedge
- BNDD: Quadratic Deflation ETF
- KHYB: Asia High Income USD Bond
- KCSH: Sustainable Ultra Short Duration
US Equity
- KSPY: Hedgeye Hedged Equity
- BUYO: Man Buyout Beta Index
- KVLE: Value Line® Dynamic Dividend Equity
*Strategy also available in UCITS
Investment Strategy:
The KraneShares Dragon Capital Vietnam Growth Index ETF (Ticker: KPHO) seeks to track the performance of the Dragon Capital Merqube Vietnam Growth Index. The index is comprised of companies that display attractive growth and value metrics, good corporate governance, and align with Vietnam's underlying growth drivers.
Vietnam Current Highlights:
- Since reform and opening up in 1986, a process known locally as "Doi Moi" or "Renewal", Vietnam has opened its capital markets to foreign investors, expanded exports substantially, and grown its consumer economy.
- Vietnam is forecasted to be the fastest-growing economy in the Asia-Pacific region in 2026.*
- As a non-aligned nation situated near a key crossroads of ocean shipping lanes with an expansive coastline and multiple ports, Vietnam has benefited from the migration of manufacturing centers for global businesses wary of geopolitical risks to their supply chains.
- Vietnam has been upgraded from Frontier Market to Secondary Emerging Market by global index provider FTSE Russell, with the reclassification set to go into effect in September 2026.³ It is also on the radar for a similar upgrade from MSCI, potentially leading to significant foreign inflows.
KPHO Features:
- Exposure to Vietnamese market leaders based on fundamental and proprietary growth criteria.
- Sub-advised by Dragon Capital Management Ltd., the largest fund manager in Vietnam,¹ with over 30 years of experience¹ in the market, and utilizing their locally-listed ETF to access Foreign Ownership Limit (FOL)-constrained stocks.
- Certain stocks in Vietnam have reached their FOLs due to strong international investor demand. KPHO is the only US-listed ETF to provide access to FOL stocks through ownership of the Dragon Capital Diamond ETF.²
*World Bank estimate as of 12/31/2025. ¹ Source: Dragon Capital. ² Data from Bloomberg as of 10/30/2025. ³ FTSE Russell. "FTSE Russell announces results of September 2025 semi-annual country classification review for equities and fixed income," LSEG. October 7, 2025.
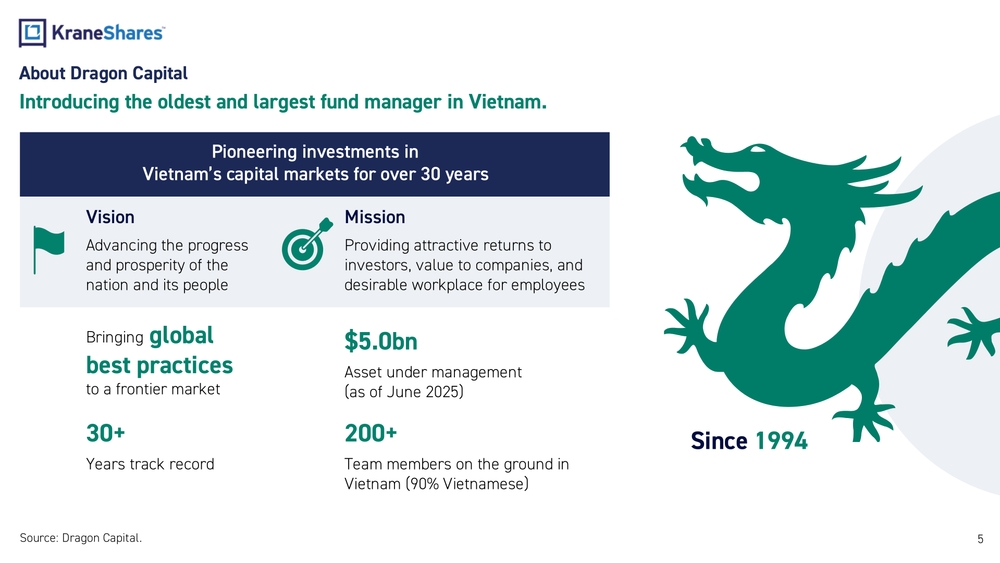
About Dragon Capital
Introducing the oldest and largest fund manager in Vietnam.
Pioneering investments in Vietnam's capital markets for over 30 years
Vision
Advancing the progress and prosperity of the nation and its people
Mission
Providing attractive returns to investors, value to companies, and desirable workplace for employees
Bringing global best practices to a frontier market
$5.0bn
Asset under management (as of June 2025)
30+
Years track record
200+
Team members on the ground in Vietnam (90% Vietnamese)
Since 1994
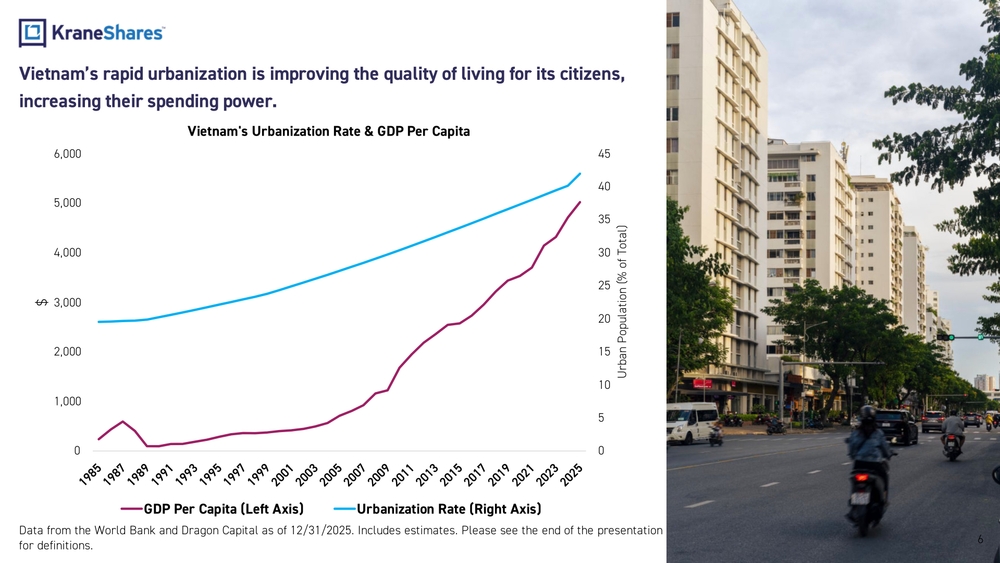
Vietnam's rapid urbanization is improving the quality of living for its citizens, increasing their spending power.
Vietnam's Urbanization Rate & GDP Per Capita
[Chart showing correlation between Vietnam's increasing urbanization rate (right axis, measured in % of total population) and GDP per capita (left axis, measured in $) from 1985 to 2025. The chart shows both metrics steadily increasing over time, with particularly steep growth in recent years.]
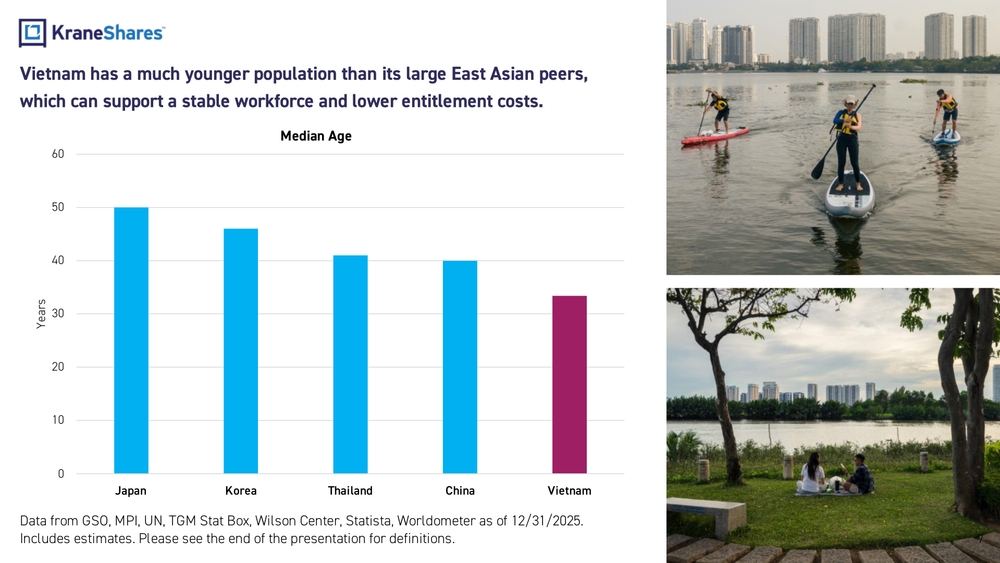
Vietnam has a much younger population than its large East Asian peers, which can support a stable workforce and lower entitlement costs.
Median Age
[Bar chart comparing median ages across East Asian countries: Japan: ~50 years Korea: ~46 years Thailand: ~41 years China: ~40 years Vietnam: ~33 years]
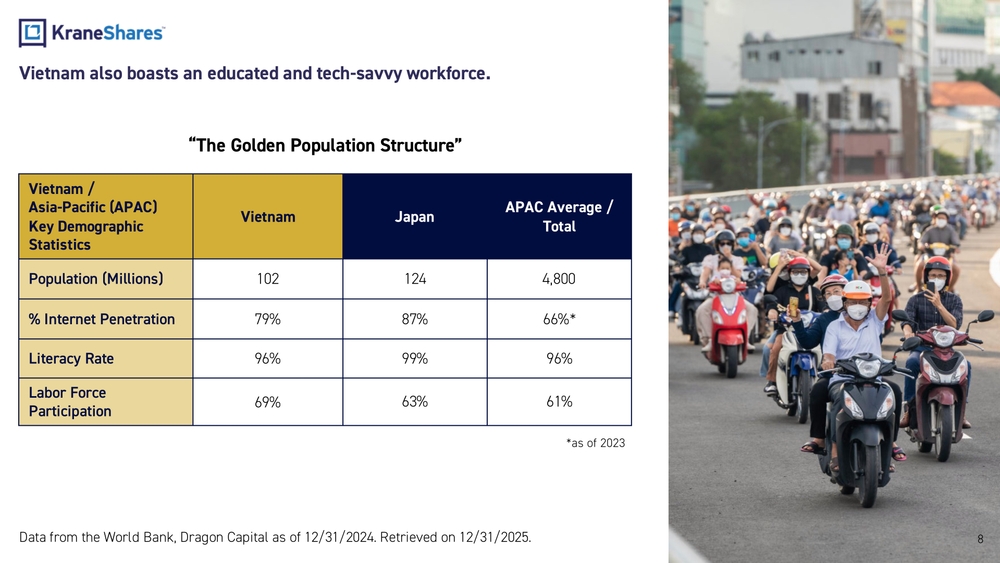
Vietnam also boasts an educated and tech-savvy workforce.
"The Golden Population Structure"
| Vietnam / Asia-Pacific (APAC) Key Demographic Statistics | Vietnam | Japan | APAC Average / Total |
|---|---|---|---|
| Population (Millions) | 102 | 124 | 4,800 |
| % Internet Penetration | 79% | 87% | 66%* |
| Literacy Rate | 96% | 99% | 96% |
| Labor Force Participation | 69% | 63% | 61% |
*as of 2023
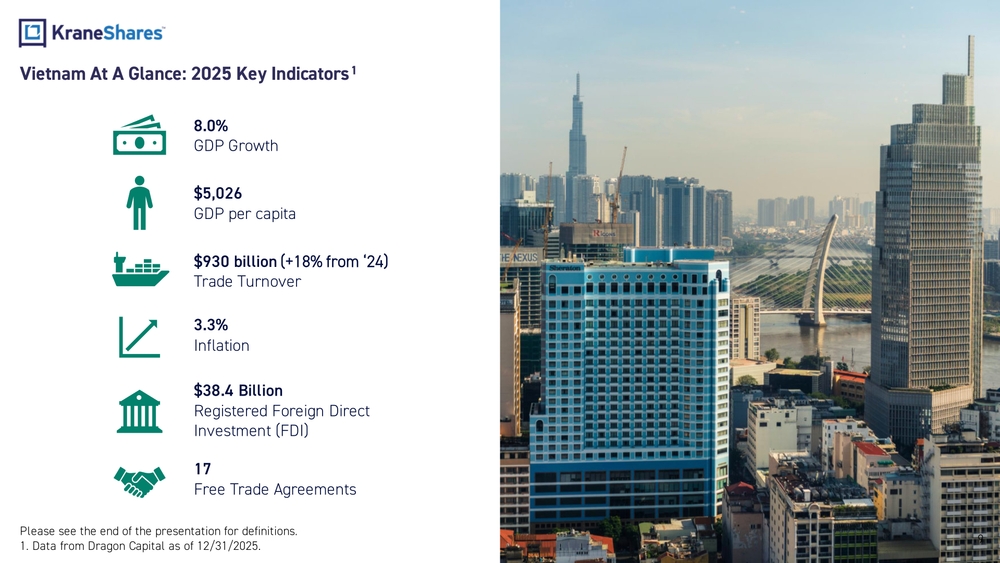
Vietnam At A Glance: 2025 Key Indicators¹
- 8.0% GDP Growth
- $5,026 GDP per capita
- $930 billion (+18% from '24) Trade Turnover
- 3.3% Inflation
- $38.4 Billion Registered Foreign Direct Investment (FDI)
- 17 Free Trade Agreements
¹ Data from Dragon Capital as of 12/31/2025.
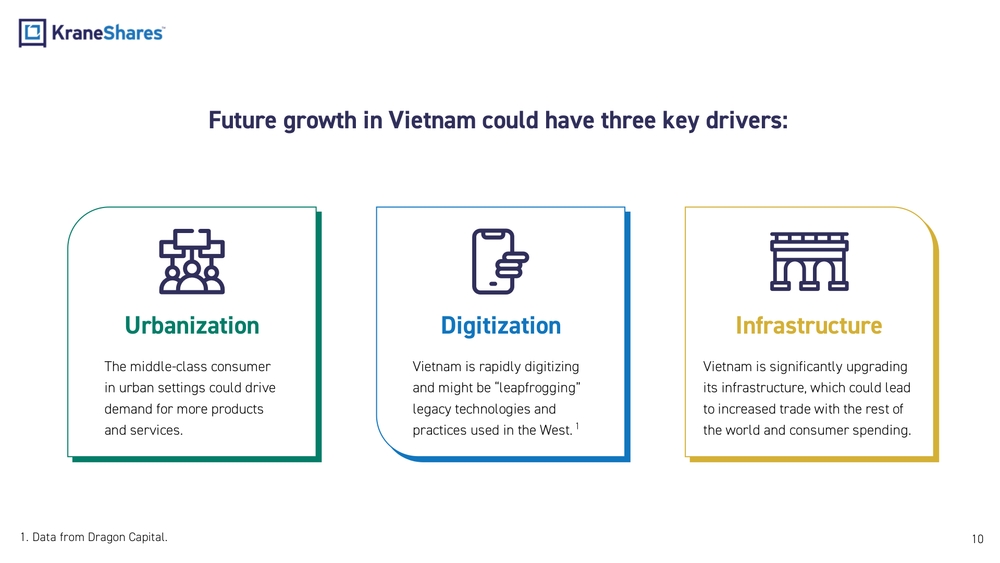
Future growth in Vietnam could have three key drivers:
Urbanization
The middle-class consumer in urban settings could drive demand for more products and services.
Digitization
Vietnam is rapidly digitizing and might be "leapfrogging" legacy technologies and practices used in the West.¹
Infrastructure
Vietnam is significantly upgrading its infrastructure, which could lead to increased trade with the rest of the world and consumer spending.
¹ Data from Dragon Capital.
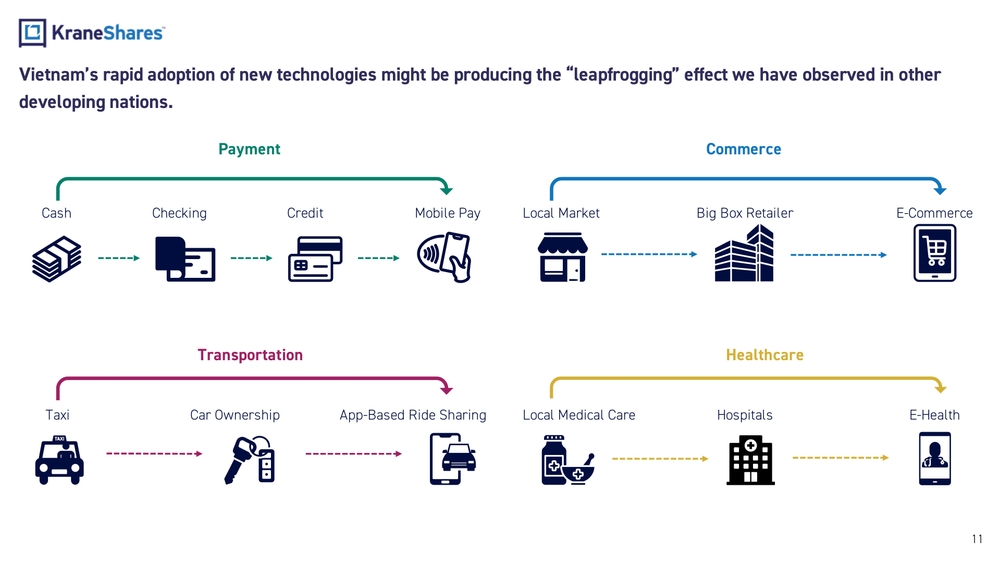
Vietnam's rapid adoption of new technologies might be producing the "leapfrogging" effect we have observed in other developing nations.
The image shows a chart illustrating technological leapfrogging across four sectors:
Payment
Cash → Checking → Credit → Mobile Pay
Commerce
Local Market → Big Box Retailer → E-Commerce
Transportation
Taxi → Car Ownership → App-Based Ride Sharing
Healthcare
Local Medical Care → Hospitals → E-Health
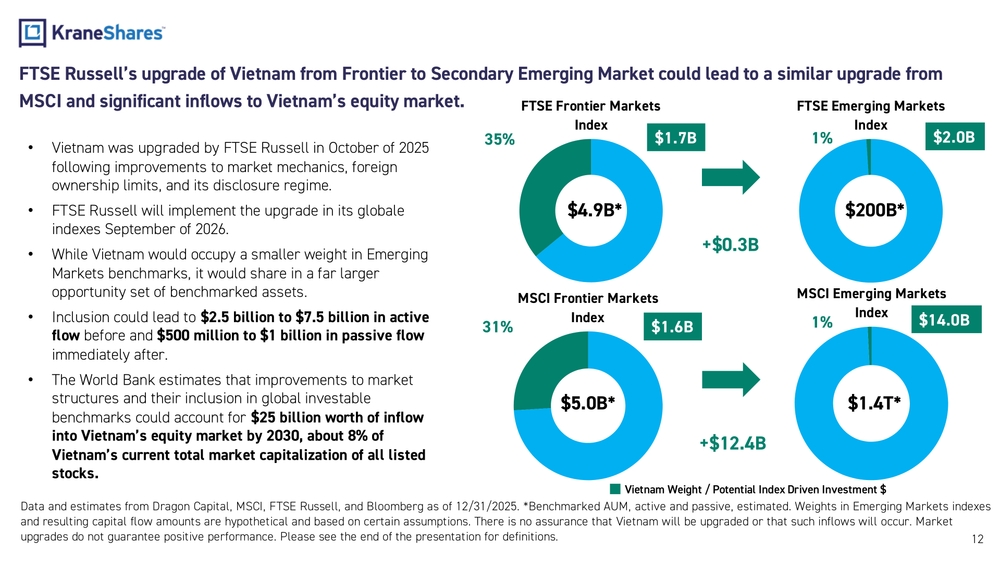
FTSE Russell's upgrade of Vietnam from Frontier to Secondary Emerging Market could lead to a similar upgrade from MSCI and significant inflows to Vietnam's equity market.
-
Vietnam was upgraded by FTSE Russell in October of 2025 following improvements to market mechanics, foreign ownership limits, and its disclosure regime.
-
FTSE Russell will implement the upgrade in its global indexes September of 2026.
-
While Vietnam would occupy a smaller weight in Emerging Markets benchmarks, it would share in a far larger opportunity set of benchmarked assets.
-
Inclusion could lead to $2.5 billion to $7.5 billion in active flow before and $500 million to $1 billion in passive flow immediately after.
-
The World Bank estimates that improvements to market structures and their inclusion in global investable benchmarks could account for $25 billion worth of inflow into Vietnam's equity market by 2030, about 8% of Vietnam's current total market capitalization of all listed stocks.
The image shows a comparison of Vietnam's weight and potential index-driven investment across different indexes:
FTSE Frontier Markets Index: 35% weight, $1.7B investment, $4.9B* benchmarked AUM
FTSE Emerging Markets Index: 1% weight, $2.0B investment, $200B* benchmarked AUM
MSCI Frontier Markets Index: 31% weight, $1.6B investment, $5.0B* benchmarked AUM
MSCI Emerging Markets Index: 1% weight, $14.0B investment, $1.4T* benchmarked AUM
Potential additional investment: +$0.3B (FTSE), +$12.4B (MSCI)
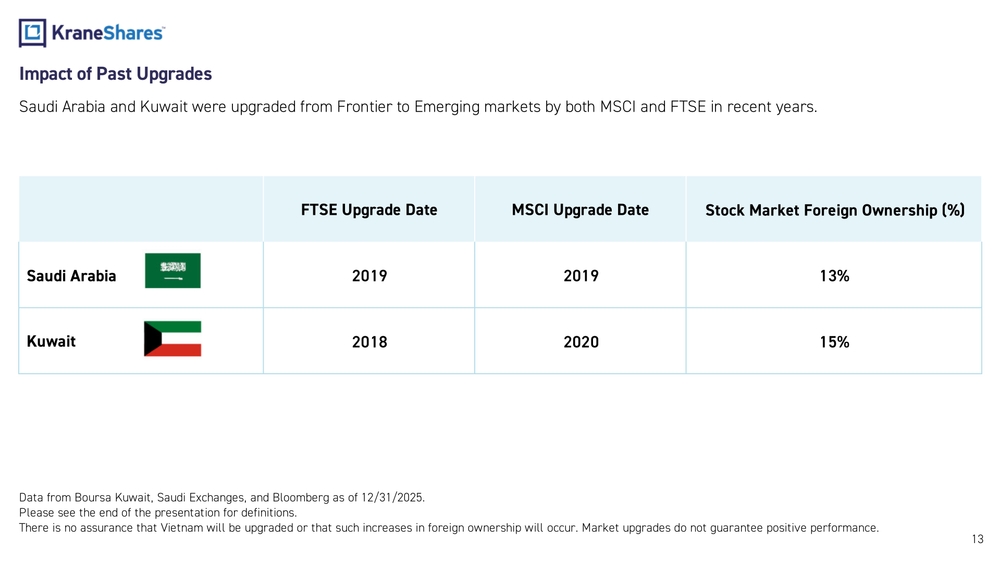
Impact of Past Upgrades
Saudi Arabia and Kuwait were upgraded from Frontier to Emerging markets by both MSCI and FTSE in recent years.
| FTSE Upgrade Date | MSCI Upgrade Date | Stock Market Foreign Ownership (%) | |
|---|---|---|---|
| Saudi Arabia | 2019 | 2019 | 13% |
| Kuwait | 2018 | 2020 | 15% |
Data from Boursa Kuwait, Saudi Exchanges, and Bloomberg as of 12/31/2025.
There is no assurance that Vietnam will be upgraded or that such increases in foreign ownership will occur. Market upgrades do not guarantee positive performance.
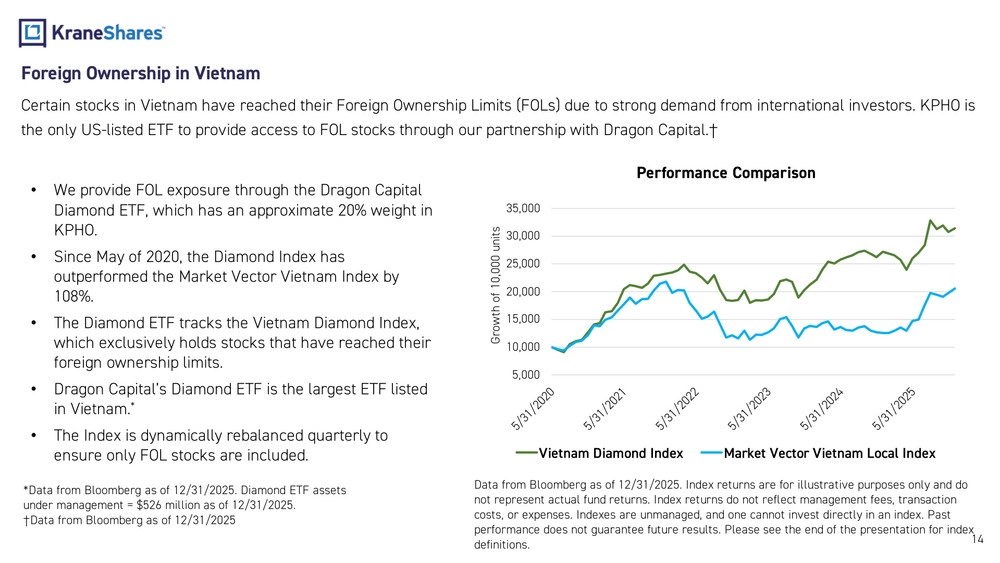
Foreign Ownership in Vietnam
Certain stocks in Vietnam have reached their Foreign Ownership Limits (FOLs) due to strong demand from international investors. KPHO is the only US-listed ETF to provide access to FOL stocks through our partnership with Dragon Capital.
-
We provide FOL exposure through the Dragon Capital Diamond ETF, which has an approximate 20% weight in KPHO.
-
Since May of 2020, the Diamond Index has outperformed the Market Vector Vietnam Index by 108%.
-
The Diamond ETF tracks the Vietnam Diamond Index, which exclusively holds stocks that have reached their foreign ownership limits.
-
Dragon Capital's Diamond ETF is the largest ETF listed in Vietnam.
-
The Index is dynamically rebalanced quarterly to ensure only FOL stocks are included.
The image shows a performance comparison chart between the Vietnam Diamond Index and Market Vector Vietnam Local Index, demonstrating significant outperformance of the Diamond Index since 2020.
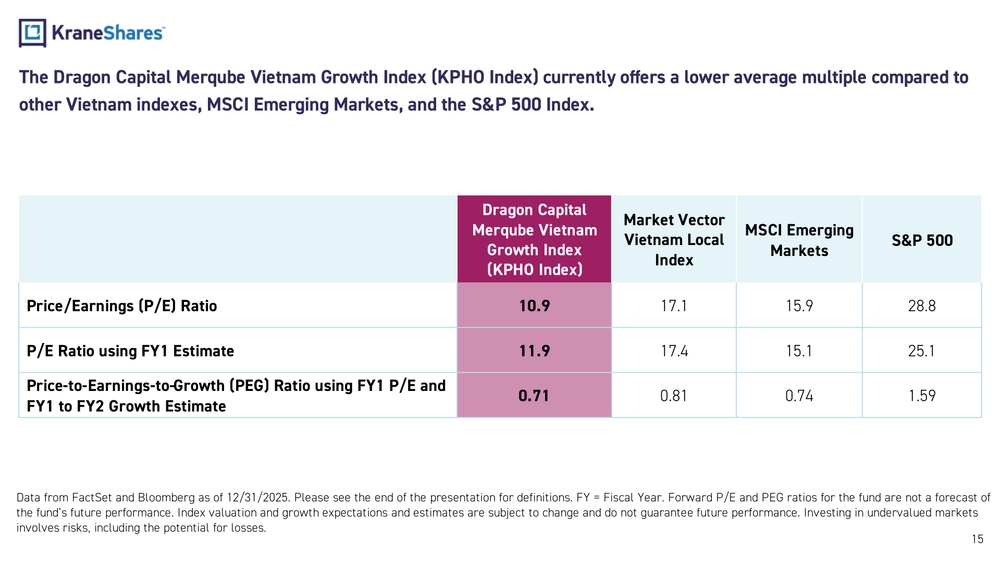
The Dragon Capital Merqube Vietnam Growth Index (KPHO Index) currently offers a lower average multiple compared to other Vietnam indexes, MSCI Emerging Markets, and the S&P 500 Index.
| Dragon Capital Merqube Vietnam Growth Index (KPHO Index) | Market Vector Vietnam Local Index | MSCI Emerging Markets | S&P 500 | |
|---|---|---|---|---|
| Price/Earnings (P/E) Ratio | 10.9 | 17.1 | 15.9 | 28.8 |
| P/E Ratio using FY1 Estimate | 11.9 | 17.4 | 15.1 | 25.1 |
| Price-to-Earnings-to-Growth (PEG) Ratio using FY1 P/E and FY1 to FY2 Growth Estimate | 0.71 | 0.81 | 0.74 | 1.59 |
Data from FactSet and Bloomberg as of 12/31/2025. FY = Fiscal Year. Forward P/E and PEG ratios for the fund are not a forecast of the fund's future performance. Index valuation and growth expectations and estimates are subject to change and do not guarantee future performance. Investing in undervalued markets involves risks, including the potential for losses.
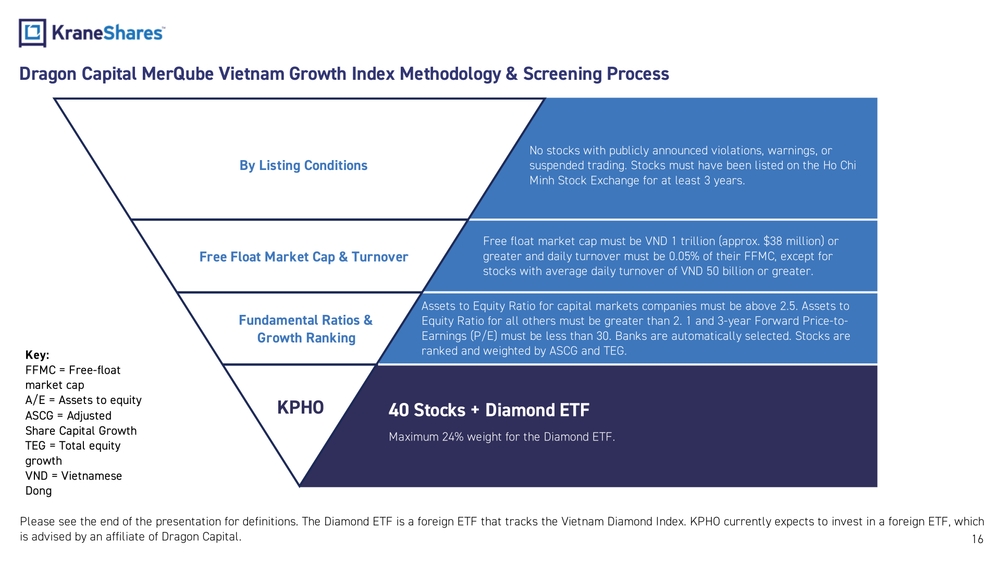
Dragon Capital MerQube Vietnam Growth Index Methodology & Screening Process
By Listing Conditions
No stocks with publicly announced violations, warnings, or suspended trading. Stocks must have been listed on the Ho Chi Minh Stock Exchange for at least 3 years.
Free Float Market Cap & Turnover
Free float market cap must be VND 1 trillion (approx. $38 million) or greater and daily turnover must be 0.05% of their FFMC, except for stocks with average daily turnover of VND 50 billion or greater.
Fundamental Ratios & Growth Ranking
Assets to Equity Ratio for capital markets companies must be above 2.5. Assets to Equity Ratio for all others must be greater than 2. 1 and 3-year Forward Price-to-Earnings (P/E) must be less than 30. Banks are automatically selected. Stocks are ranked and weighted by ASCG and TEG.
KPHO
40 Stocks + Diamond ETF Maximum 24% weight for the Diamond ETF.
Key: FFMC = Free-float market cap A/E = Assets to equity ASCG = Adjusted Share Capital Growth TEG = Total equity growth VND = Vietnamese Dong
The Diamond ETF is a foreign ETF that tracks the Vietnam Diamond Index. KPHO currently expects to invest in a foreign ETF, which is advised by an affiliate of Dragon Capital.
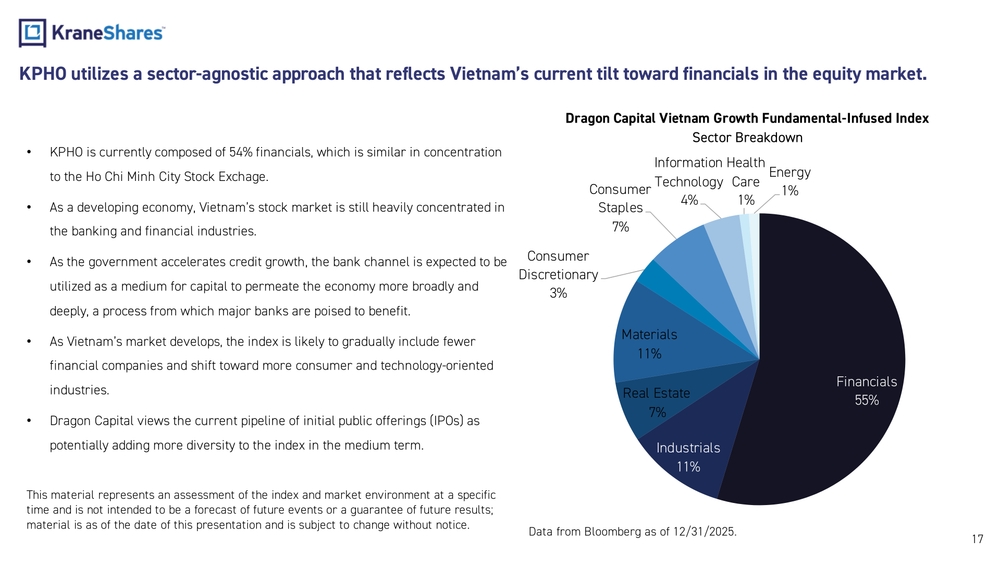
KPHO utilizes a sector-agnostic approach that reflects Vietnam's current tilt toward financials in the equity market.
-
KPHO is currently composed of 54% financials, which is similar in concentration to the Ho Chi Minh City Stock Exchange.
-
As a developing economy, Vietnam's stock market is still heavily concentrated in the banking and financial industries.
-
As the government accelerates credit growth, the bank channel is expected to be utilized as a medium for capital to permeate the economy more broadly and deeply, a process from which major banks are poised to benefit.
-
As Vietnam's market develops, the index is likely to gradually include fewer financial companies and shift toward more consumer and technology-oriented industries.
-
Dragon Capital views the current pipeline of initial public offerings (IPOs) as potentially adding more diversity to the index in the medium term.
The image shows a pie chart of the Dragon Capital Vietnam Growth Fundamental-Infused Index Sector Breakdown:
- Financials: 55%
- Industrials: 11%
- Materials: 11%
- Real Estate: 7%
- Consumer Staples: 7%
- Information Technology: 4%
- Consumer Discretionary: 3%
- Health Care: 1%
- Energy: 1%
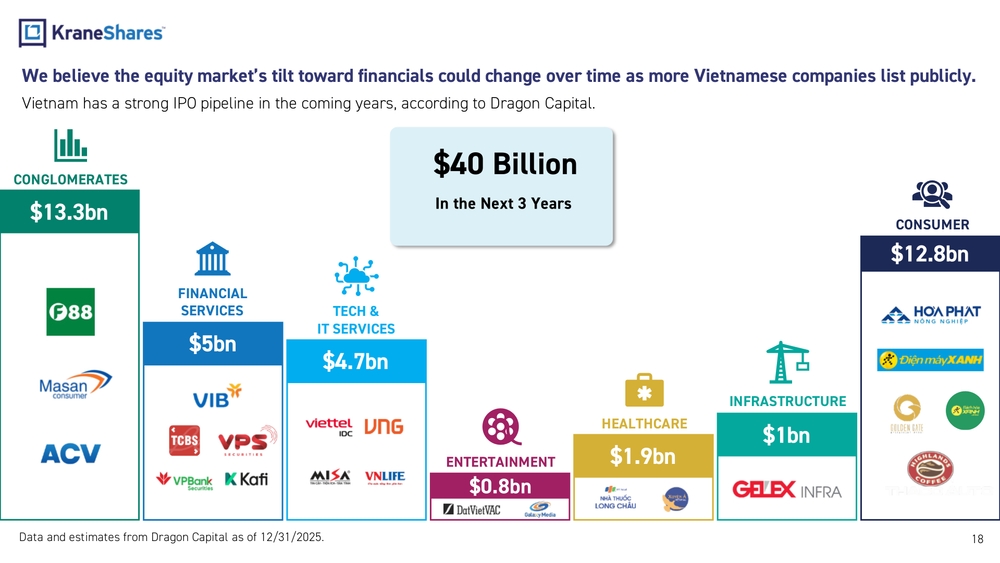
We believe the equity market's tilt toward financials could change over time as more Vietnamese companies list publicly.
Vietnam has a strong IPO pipeline in the coming years, according to Dragon Capital.
$40 Billion In the Next 3 Years
- CONSUMER: $12.8bn
- CONGLOMERATES: $13.3bn
- FINANCIAL SERVICES: $5bn
- TECH & IT SERVICES: $4.7bn
- ENTERTAINMENT: $0.8bn
- HEALTHCARE: $1.9bn
- INFRASTRUCTURE: $1bn
The image shows various company logos organized by sector, representing potential IPO candidates in Vietnam's market.
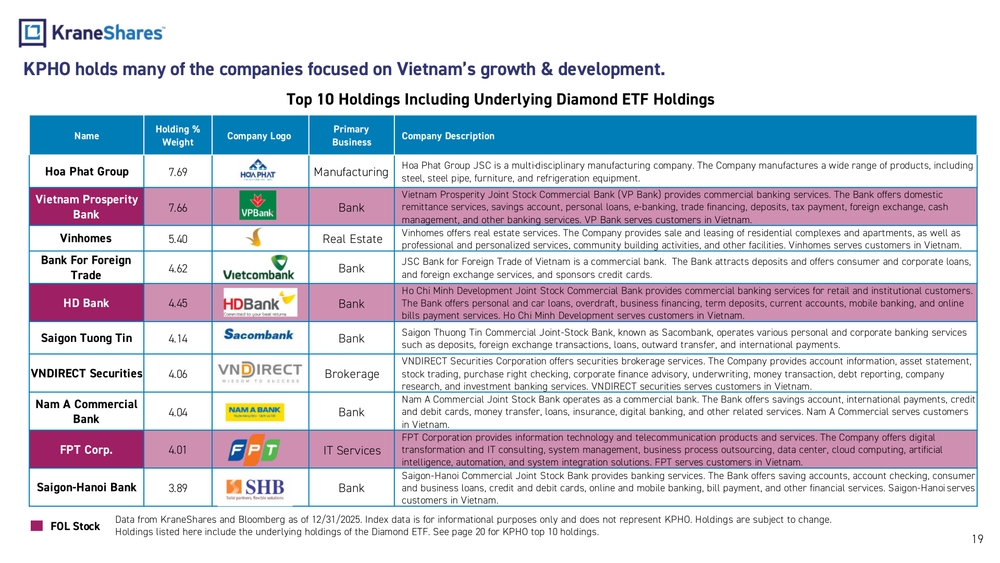
KPHO holds many of the companies focused on Vietnam's growth & development.
Top 10 Holdings Including Underlying Diamond ETF Holdings
| Name | Holding % Weight | Primary Business | Company Description |
|---|---|---|---|
| Hoa Phat Group | 7.69 | Manufacturing | Hoa Phat Group JSC is a multi-disciplinary manufacturing company. The Company manufactures a wide range of products, including steel, steel pipe, furniture, and refrigeration equipment. |
| Vietnam Prosperity Bank | 7.66 | Bank | Vietnam Prosperity Joint Stock Commercial Bank (VP Bank) provides commercial banking services. The Bank offers domestic remittance services, savings account, personal loans, e-banking, trade financing, deposits, tax payment, foreign exchange, cash management, and other banking services. VP Bank serves customers in Vietnam. |
| Vinhomes | 5.40 | Real Estate | Vinhomes offers real estate services. The Company provides sale and leasing of residential complexes and apartments, as well as professional and personalized services, community building activities, and other facilities. Vinhomes serves customers in Vietnam. |
| Bank For Foreign Trade | 4.62 | Bank | JSC Bank for Foreign Trade of Vietnam is a commercial bank. The Bank attracts deposits and offers consumer and corporate loans, and foreign exchange services, and sponsors credit cards. |
| HD Bank | 4.45 | Bank | Ho Chi Minh Development Joint Stock Commercial Bank provides commercial banking services for retail and institutional customers. The Bank offers personal and car loans, overdraft, business financing, term deposits, current accounts, mobile banking, and online bills payment services. Ho Chi Minh Development serves customers in Vietnam. |
| Saigon Tuong Tin | 4.14 | Bank | Saigon Thuong Tin Commercial Joint-Stock Bank, known as Sacombank, operates various personal and corporate banking services such as deposits, foreign exchange transactions, loans, outward transfer, and international payments. |
| VNDIRECT Securities | 4.06 | Brokerage | VNDIRECT Securities Corporation offers securities brokerage services. The Company provides account information, asset statement, stock trading, purchase right checking, corporate finance advisory, underwriting, money transaction, debt reporting, company research, and investment banking services. VNDIRECT securities serves customers in Vietnam. |
| Nam A Commercial Bank | 4.04 | Bank | Nam A Commercial Joint Stock Bank operates as a commercial bank. The Bank offers savings account, international payments, credit and debit cards, money transfer, loans, insurance, digital banking, and other related services. Nam A Commercial serves customers in Vietnam. |
| FPT Corp. | 4.01 | IT Services | FPT Corporation provides information technology and telecommunication products and services. The Company offers digital transformation and IT consulting, system management, business process outsourcing, data center, cloud computing, artificial intelligence, automation, and system integration solutions. FPT serves customers in Vietnam. |
| Saigon-Hanoi Bank | 3.89 | Bank | Saigon-Hanoi Commercial Joint Stock Bank provides banking services. The Bank offers saving accounts, account checking, consumer and business loans, credit and debit cards, online and mobile banking, bill payment, and other financial services. Saigon-Hanoi serves customers in Vietnam. |
FOL Stock refers to stocks that have reached their Foreign Ownership Limits
KraneShares Dragon Capital Vietnam Growth Index ETF
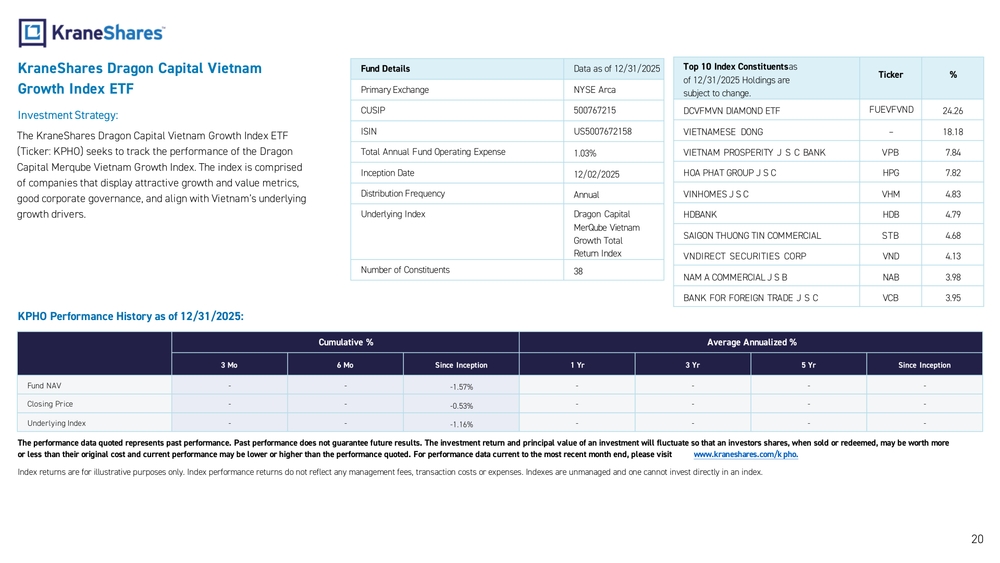
Investment Strategy:
The KraneShares Dragon Capital Vietnam Growth Index ETF (Ticker: KPHO) seeks to track the performance of the Dragon Capital Merqube Vietnam Growth Index. The index is comprised of companies that display attractive growth and value metrics, good corporate governance, and align with Vietnam's underlying growth drivers.
Fund Details Data as of 12/31/2025
| Primary Exchange | NYSE Arca |
| CUSIP | 500767215 |
| ISIN | US5007672158 |
| Total Annual Fund Operating Expense | 1.03% |
| Inception Date | 12/02/2025 |
| Distribution Frequency | Annual |
| Underlying Index | Dragon Capital MerQube Vietnam Growth Total Return Index |
| Number of Constituents | 38 |
Top 10 Index Constituents as of 12/31/2025 (Holdings are subject to change)
| Ticker | % | |
|---|---|---|
| DCVFMVN DIAMOND ETF | FUEVFVND | 24.26 |
| VIETNAMESE DONG | - | 18.18 |
| VIETNAM PROSPERITY J S C BANK | VPB | 7.84 |
| HOA PHAT GROUP JSC | HPG | 7.82 |
| VINHOMES JSC | VHM | 4.83 |
| HDBANK | HDB | 4.79 |
| SAIGON THUONG TIN COMMERCIAL | STB | 4.68 |
| VNDIRECT SECURITIES CORP | VND | 4.13 |
| NAM A COMMERCIAL JSB | NAB | 3.98 |
| BANK FOR FOREIGN TRADE JSC | VCB | 3.95 |
KPHO Performance History as of 12/31/2025:
| Cumulative % | Average Annualized % | ||||||
|---|---|---|---|---|---|---|---|
| 3 Mo | 6 Mo | Since Inception | 1 Yr | 3 Yr | 5 Yr | Since Inception | |
| Fund NAV | - | - | -1.57% | - | - | - | - |
| Closing Price | - | - | -0.53% | - | - | - | - |
| Underlying Index | - | - | -1.16% | - | - | - | - |
The performance data quoted represents past performance. Past performance does not guarantee future results. The investment return and principal value of an investment will fluctuate so that an investor's shares, when sold or redeemed, may be worth more or less than their original cost and current performance may be lower or higher than the performance quoted. For performance data current to the most recent month end, please visit www.kraneshares.com/kpho.
Index returns are for illustrative purposes only. Index performance returns do not reflect any management fees, transaction costs or expenses. Indexes are unmanaged and one cannot invest directly in an index.
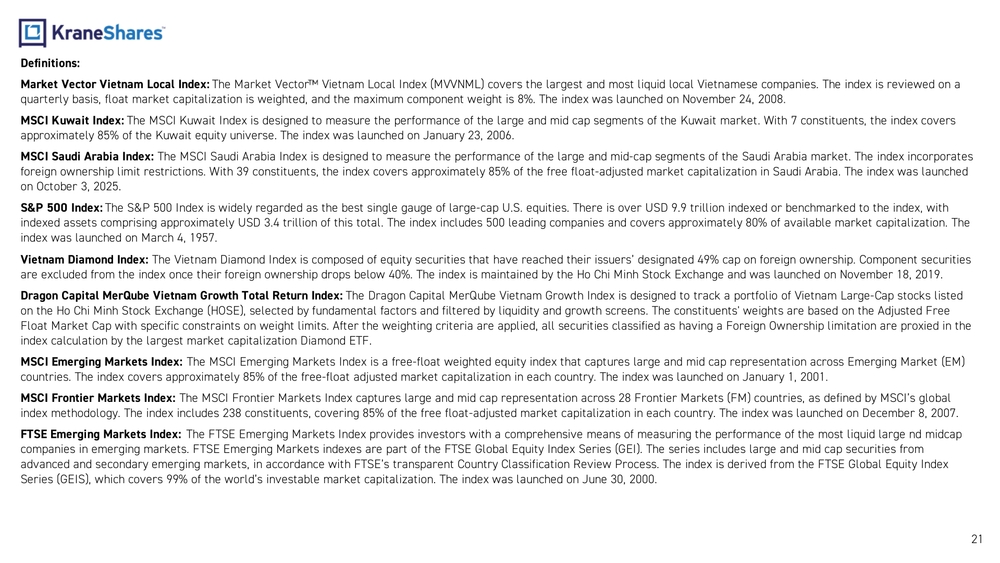
Definitions:
Market Vector Vietnam Local Index: The Market Vector™ Vietnam Local Index (MVVNML) covers the largest and most liquid local Vietnamese companies. The index is reviewed on a quarterly basis, float market capitalization is weighted, and the maximum component weight is 8%. The index was launched on November 24, 2008.
MSCI Kuwait Index: The MSCI Kuwait Index is designed to measure the performance of the large and mid cap segments of the Kuwait market. With 7 constituents, the index covers approximately 85% of the Kuwait equity universe. The index was launched on January 23, 2006.
MSCI Saudi Arabia Index: The MSCI Saudi Arabia Index is designed to measure the performance of the large and mid-cap segments of the Saudi Arabia market. The index incorporates foreign ownership limit restrictions. With 39 constituents, the index covers approximately 85% of the free float-adjusted market capitalization in Saudi Arabia. The index was launched on October 3, 2025.
S&P 500 Index: The S&P 500 Index is widely regarded as the best single gauge of large-cap U.S. equities. There is over USD 9.9 trillion indexed or benchmarked to the index, with indexed assets comprising approximately USD 3.4 trillion of this total. The index includes 500 leading companies and covers approximately 80% of available market capitalization. The index was launched on March 4, 1957.
Vietnam Diamond Index: The Vietnam Diamond Index is composed of equity securities that have reached their issuers' designated 49% cap on foreign ownership. Component securities are excluded from the index once their foreign ownership drops below 40%. The index is maintained by the Ho Chi Minh Stock Exchange and was launched on November 18, 2019.
Dragon Capital MerQube Vietnam Growth Total Return Index: The Dragon Capital MerQube Vietnam Growth Index is designed to track a portfolio of Vietnam Large-Cap stocks listed on the Ho Chi Minh Stock Exchange (HOSE), selected by fundamental factors and filtered by liquidity and growth screens. The constituents' weights are based on the Adjusted Free Float Market Cap with specific constraints on weight limits. After the weighting criteria are applied, all securities classified as having a Foreign Ownership limitation are proxied in the index calculation by the largest market capitalization Diamond ETF.
MSCI Emerging Markets Index: The MSCI Emerging Markets Index is a free-float weighted equity index that captures large and mid cap representation across Emerging Market (EM) countries. The index covers approximately 85% of the free-float adjusted market capitalization in each country. The index was launched on January 1, 2001.
MSCI Frontier Markets Index: The MSCI Frontier Markets Index captures large and mid cap representation across 28 Frontier Markets (FM) countries, as defined by MSCI's global index methodology. The index includes 238 constituents, covering 85% of the free float-adjusted market capitalization in each country. The index was launched on December 8, 2007.
FTSE Emerging Markets Index: The FTSE Emerging Markets Index provides investors with a comprehensive means of measuring the performance of the most liquid large nd midcap companies in emerging markets. FTSE Emerging Markets indexes are part of the FTSE Global Equity Index Series (GEI). The series includes large and mid cap securities from advanced and secondary emerging markets, in accordance with FTSE's transparent Country Classification Review Process. The index is derived from the FTSE Global Equity Index Series (GEIS), which covers 99% of the world's investable market capitalization. The index was launched on June 30, 2000.
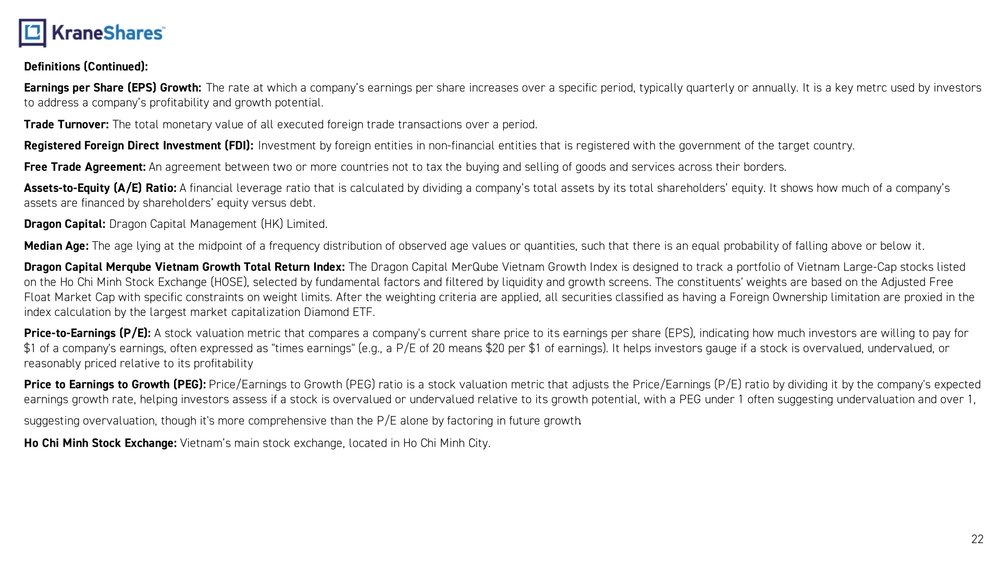
Definitions (Continued):
Earnings per Share (EPS) Growth: The rate at which a company's earnings per share increases over a specific period, typically quarterly or annually. It is a key metrc used by investors to address a company's profitability and growth potential.
Trade Turnover: The total monetary value of all executed foreign trade transactions over a period.
Registered Foreign Direct Investment (FDI): Investment by foreign entities in non-financial entities that is registered with the government of the target country.
Free Trade Agreement: An agreement between two or more countries not to tax the buying and selling of goods and services across their borders.
Assets-to-Equity (A/E) Ratio: A financial leverage ratio that is calculated by dividing a company's total assets by its total shareholders' equity. It shows how much of a company's assets are financed by shareholders' equity versus debt.
Dragon Capital: Dragon Capital Management (HK) Limited.
Median Age: The age lying at the midpoint of a frequency distribution of observed age values or quantities, such that there is an equal probability of falling above or below it.
Dragon Capital Merqube Vietnam Growth Total Return Index: The Dragon Capital MerQube Vietnam Growth Index is designed to track a portfolio of Vietnam Large-Cap stocks listed on the Ho Chi Minh Stock Exchange (HOSE), selected by fundamental factors and filtered by liquidity and growth screens. The constituents' weights are based on the Adjusted Free Float Market Cap with specific constraints on weight limits. After the weighting criteria are applied, all securities classified as having a Foreign Ownership limitation are proxied in the index calculation by the largest market capitalization Diamond ETF.
Price-to-Earnings (P/E): A stock valuation metric that compares a company's current share price to its earnings per share (EPS), indicating how much investors are willing to pay for $1 of a company's earnings, often expressed as "times earnings" (e.g., a P/E of 20 means $20 per $1 of earnings). It helps investors gauge if a stock is overvalued, undervalued, or reasonably priced relative to its profitability
Price to Earnings to Growth (PEG): Price/Earnings to Growth (PEG) ratio is a stock valuation metric that adjusts the Price/Earnings (P/E) ratio by dividing it by the company's expected earnings growth rate, helping investors assess if a stock is overvalued or undervalued relative to its growth potential, with a PEG under 1 often suggesting undervaluation and over 1, suggesting overvaluation, though it's more comprehensive than the P/E alone by factoring in future growth.
Ho Chi Minh Stock Exchange: Vietnam's main stock exchange, located in Ho Chi Minh City.
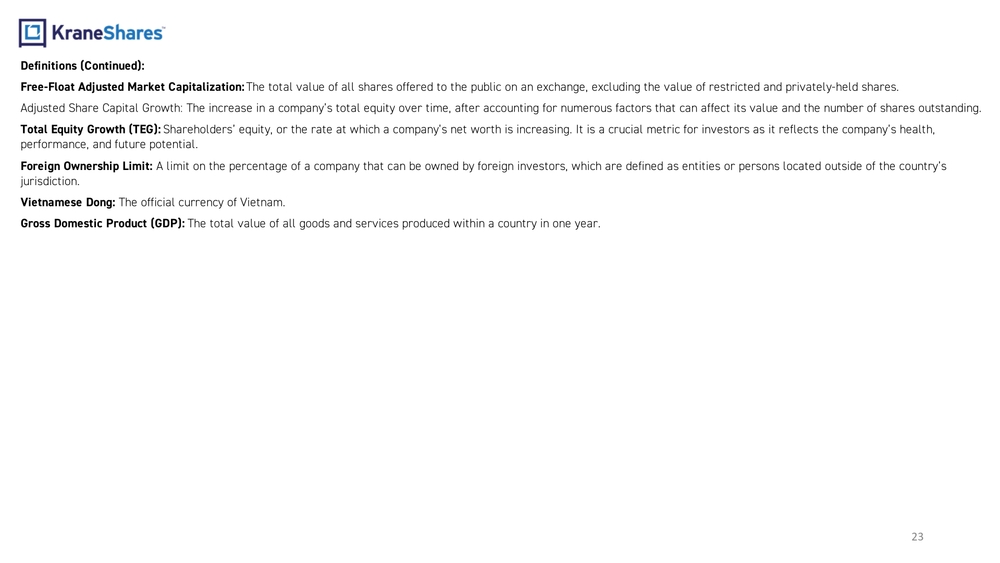
Definitions (Continued):
Free-Float Adjusted Market Capitalization: The total value of all shares offered to the public on an exchange, excluding the value of restricted and privately-held shares.
Adjusted Share Capital Growth: The increase in a company's total equity over time, after accounting for numerous factors that can affect its value and the number of shares outstanding.
Total Equity Growth (TEG): Shareholders' equity, or the rate at which a company's net worth is increasing. It is a crucial metric for investors as it reflects the company's health, performance, and future potential.
Foreign Ownership Limit: A limit on the percentage of a company that can be owned by foreign investors, which are defined as entities or persons located outside of the country's jurisdiction.
Vietnamese Dong: The official currency of Vietnam.
Gross Domestic Product (GDP): The total value of all goods and services produced within a country in one year.
Important Notes:
Carefully consider the Funds' investment objectives, risk factors, charges and expenses before investing. This and additional information can be found in the Funds' full and summary prospectus, which may be obtained by visiting www.kraneshares.com/kpho. Read the prospectus carefully before investing.
Risk Disclosures:
Investing involves risk, including possible loss of principal. There can be no assurance that a Fund will achieve its stated objectives. Indices are unmanaged and do not include the effect of fees. One cannot invest directly in an index.
This information should not be relied upon as research, investment advice, or a recommendation regarding any products, strategies, or any security in particular. This material is strictly for illustrative, educational, or informational purposes and is subject to change. Certain content represents an assessment of the market environment at a specific time and is not intended to be a forecast of future events or a guarantee of future results; material is as of the dates noted and is subject to change without notice.
Investing in Vietnamese companies involves significant risks that are greater than those found in developed markets and are typical of both emerging and frontier markets. These risks include political and economic instability, government intervention, and the potential for expropriation or nationalization of assets. The Vietnamese government may impose restrictions on foreign investment, capital repatriation, or ownership limits, which could affect your ability to access or withdraw your investment. Vietnam's economy is highly dependent on trading relationships with countries such as the United States, China, and Japan, and a decline in demand from these trading partners could negatively impact Vietnamese companies and the Fund. As an emerging and frontier market, Vietnam's financial markets are less developed, more volatile, and less liquid than those of developed countries, and are subject to higher inflation, currency fluctuations, and regulatory changes. There may also be restrictions or delays on moving money in and out of the country, and additional taxes or costs for foreign investors. The securities markets in Vietnam may experience trading suspensions, low trading volumes, or sudden price swings, and the government may exercise substantial influence over many aspects of the private sector. These and other risks may result in greater losses, delays, or volatility compared to investments in more developed markets.
As an ETF, the Fund may trade at prices above or below its net asset value, especially during periods of market volatility or if there are few financial institutions creating and redeeming shares. The Fund's use of cash for creations and redemptions can lead to higher taxes and transaction costs, which may reduce returns. Because the Fund invests in foreign markets—including indirect exposure through a locally traded Vietnamese ETF—its shares may trade at prices that differ from the value of the underlying securities, and there is no guarantee that an active trading market will always exist for the Fund's shares.
The Fund may invest in derivatives, which are often more volatile than other investments and may magnify the Fund's gains or losses. A derivative (i.e., futures/forward contracts, swaps, and options) is a contract that derives its value from the performance of an underlying asset. The primary risk of derivatives is that changes in the asset's market value and the derivative may not be proportionate, and some derivatives can have the potential for unlimited losses. Derivatives are also subject to liquidity risk and counterparty risk. The Fund is subject to liquidity risk, meaning that certain investments may become difficult to purchase or sell at a reasonable time and price. If a transaction for these securities is large, it may not be possible to initiate, which may cause the Fund to suffer losses. Counterparty risk is the risk of loss in the event that the counterparty to an agreement fails to make required payments or otherwise comply with the terms of the derivative.
Narrowly focused investments typically exhibit higher volatility. The Fund's assets are expected to be concentrated in a sector, industry, market, or group of concentrations to the extent that the Underlying Index has such concentrations. The securities or futures in that concentration could react similarly to market developments. Thus, the Fund is subject to loss due to adverse occurrences that affect that concentration. In addition to the normal risks associated with investing, investments in smaller companies typically exhibit higher volatility. KPHO is non-diversified.
Risk Disclosures (Continued):
ETF shares are bought and sold on an exchange at market price (not NAV) and are not individually redeemed from the Fund. However, shares may be redeemed at NAV directly by certain authorized broker-dealers (Authorized Participants) in very large creation/redemption units. The returns shown do not represent the returns you would receive if you traded shares at other times. Shares may trade at a premium or discount to their NAV in the secondary market. Brokerage commissions will reduce returns. Beginning 12/23/2020, market price returns are based on the official closing price of an ETF share or, if the official closing price isn't available, the midpoint between the national best bid and national best offer ("NBBO") as of the time the ETF calculates the current NAV per share. Prior to that date, market price returns were based on the midpoint between the Bid and Ask price. NAVs are calculated using prices as of 4:00 PM Eastern Time.
The KraneShares ETFs and KFA Funds ETFs are distributed by SEI Investments Distribution Company (SIDCO), 1 Freedom Valley Drive, Oaks, PA 19456, which is not affiliated with Krane Funds Advisors, LLC, the Investment Adviser for the Funds, or any sub-advisers for the Funds.