LUMA: Photonics & Optical ETF
by Kraneshares
LUMA 7/20/2026 Let There Be Light: How Photonics & Optical Networks are Enablingthe AI Buildout An Overview of the KraneShares Photonic and Optical ETF (Ticker: LUMA) info@kraneshares.com 1
2Investment Strategy: LUMA seeks growth of capital through exposure to both public and private companies worldwide that develop optical interconnects, transceivers, fiber -optic cables, and other light -based infrastructure designed to move vast amounts of data at the speed of light.As AI models and computing clusters scale, data movement is emerging as one of the industry’s most significant bottlenecks. Traditional copper -based connections are likely approaching their physical and economic limits, accelerating the transition toward optical data transmission across chips, servers, and data centers. LUMA is designed to capture the long -term growth opportunity created by this structural shift from electrons to photons. Photonic and Optical Industry Highlights:•Computing power has increased roughly 60,000 times over the past two decades, while the capacity to move data between chips and systems has increased only about 30 times. 1 •The AI networking market is expected to reach more than $150 billion by 2028, approximately 9 times its current size.2 •Moving data is becoming one of the biggest constraints on AI growth. Optical technology helps data centers connect more chips, process information faster, reduce energy use, and improve returns on AI infrastructure spending. LUMA Features: •Access to both public and private companies shaping the future of photonics and optical AI infrastructure. •Exposure to pure -play photonics leaders and critical companies enabling the optical infrastructure value chain. •A rules -based, research -driven approach designed to capture opportunities as optical bottlenecks evolve and shift.LUMA KraneShares Photonic and Optical ETF 1.Data from Gholami, Amir et al. “AI and Memory Wall.” IEEE Micro 44 (2024): 33- 39, Retrieved 6/30/2026. 2.Data from “Optical Networking The next mega trend in AI infrastructure, ”Goldman Sachs, April 17, 2026 Forecasts are estimates only and actual results may differ materially.
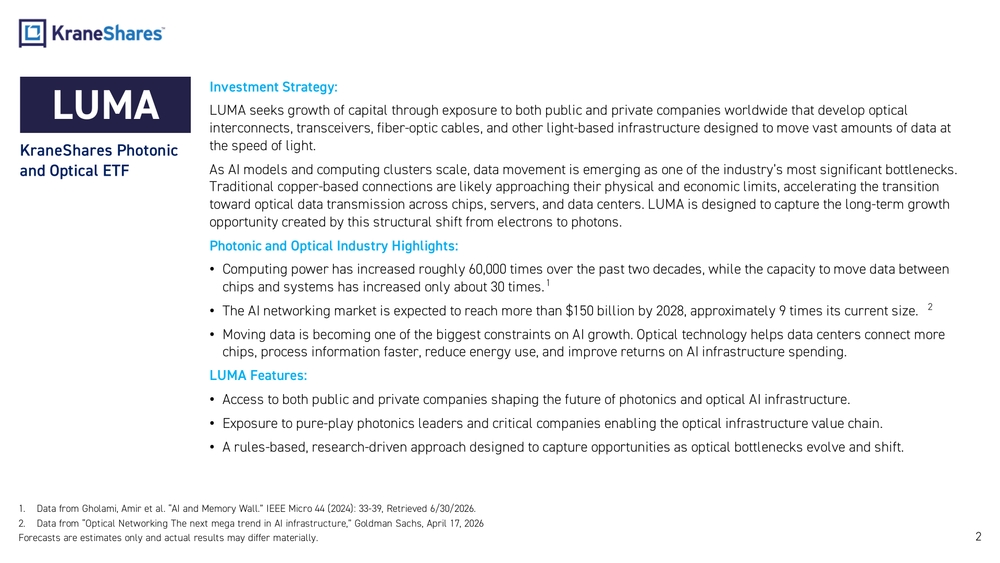
Data movement is the bottleneck for the next phase of the AI buildout 360,000x 30x 0x10,000x20,000x30,000x40,000x50,000x60,000x70,000x 2014 2016 2018 2020 2022 2024Computing performance has scaled 60,000x, far outpacing interconnect bandwidth Compute Capacity (Flops) Interconnect Capacity Data from Gholami, Amir et al. “AI and Memory Wall.” IEEE Micro 44 (2024): 33 -39, Retrieved 6/30/2026; path is illustrative.AI computing is outgrowing the roads that connect it, creating a traffic jam that could slow future AI scaling.
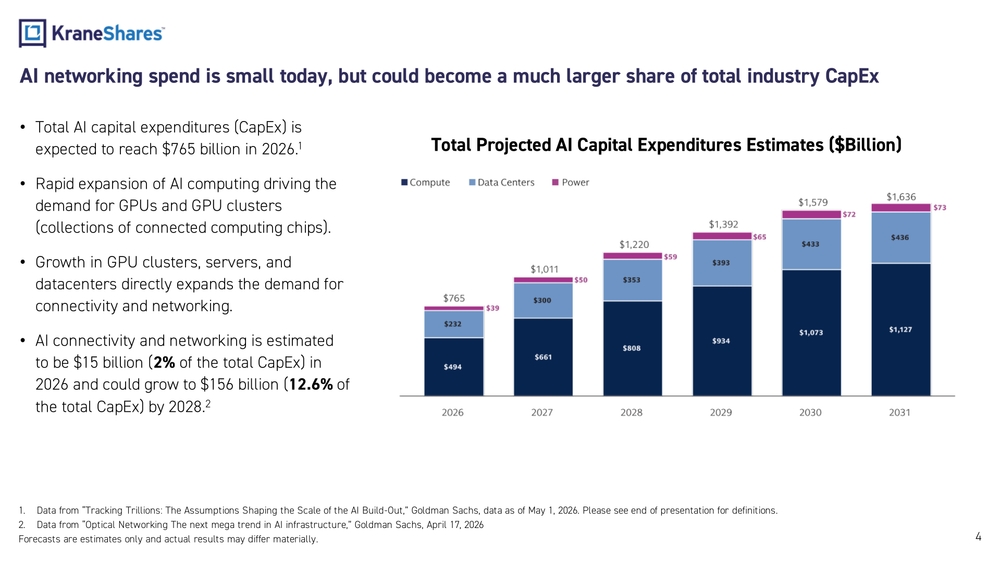
4AI networking spend is small today, but could become a much larger share of total industry CapEx •Total AI capital expenditures ( CapEx ) is expected to reach $765 billion in 2026.1 •Rapid expansion of AI computing driving the demand for GPUs and GPU clusters (collections of connected computing chips). •Growth in GPU clusters, servers, and datacenters directly expands the demand for connectivity and networking. •AI connectivity and networking is estimated to be $15 billion (2% of the total CapEx ) in 2026 and could grow to $156 billion ( 12.6% of the total CapEx ) by 2028. 2 1.Data from “Tracking Trillions: The Assumptions Shaping the Scale of the AI Build -Out,”Goldman Sachs, data as of May 1, 2026. Please see end of presentation for definitions. 2.Data from “Optical Networking The next mega trend in AI infrastructure, ”Goldman Sachs, April 17, 2026 Forecasts are estimates only and actual results may differ materially.Total Projected AI Capital Expenditures Estimates ($Billion)
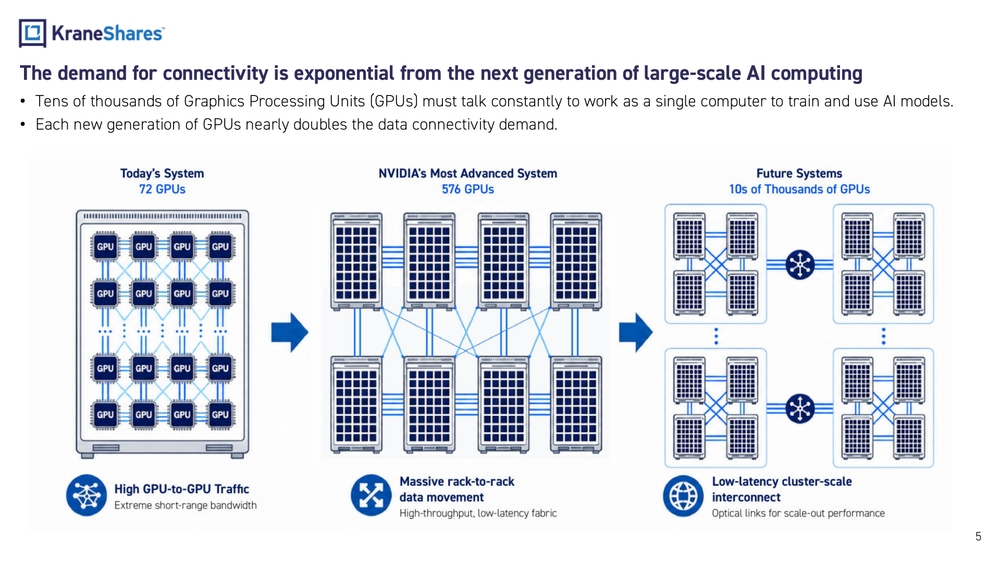
5The demand for connectivity is exponential from the next generation of large -scale AI computing •Tens of thousands of Graphics Processing Units (GPUs) must talk constantly to work as a single computer to train and use AI mode ls. •Each new generation of GPUs nearly doubles the data connectivity demand.
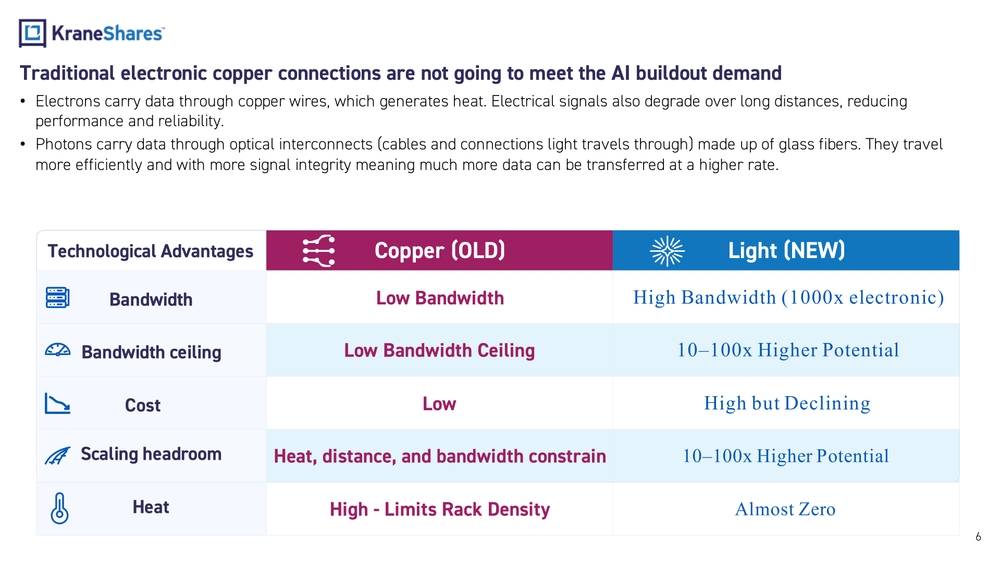
Low Bandwidth High Bandwidth (1000x electronic) Low Bandwidth Ceiling 10–100x Higher Potential Cost Low High but De cliningBandwidth Heat, distance, and bandwidth constrainCopper (OLD) Bandwidth ceiling Scaling headroomLight (NEW) 10–100x Higher PotentialTechnological Advantages Heat High - Limits Rack Density Alm o s t Ze roTraditional electronic copper connections are not going to meet the AI buildout demand •Electrons carry data through copper wires, which generates heat. Electrical signals also degrade over long distances, reducin g performance and reliability. •Photons carry data through optical interconnects (cables and connections light travels through) made up of glass fibers. They travel more efficiently and with more signal integrity meaning much more data can be transferred at a higher rate. 6
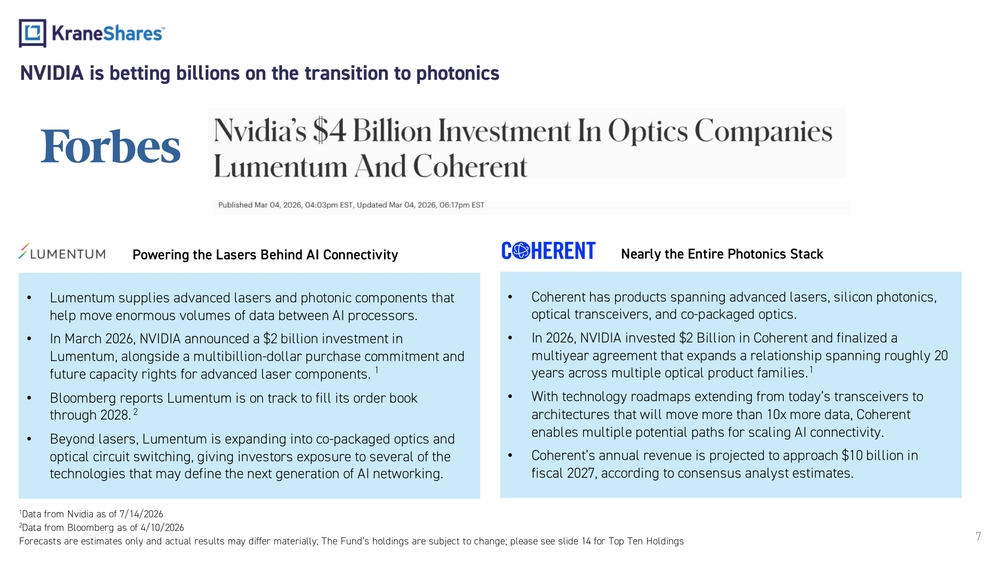
7•Lumentum supplies advanced lasers and photonic components that help move enormous volumes of data between AI processors. •In March 2026, NVIDIA announced a $2 billion investment in Lumentum , alongside a multibillion -dollar purchase commitment and future capacity rights for advanced laser components.1 •Bloomberg reports Lumentum is on track to fill its order book through 2028.2 •Beyond lasers, Lumentum is expanding into co -packaged optics and optical circuit switching, giving investors exposure to several of the technologies that may define the next generation of AI networking.•Coherent has products spanning advanced lasers, silicon photonics , optical transceivers, and co -packaged optics. •In 2026, NVIDIA invested $2 Billion in Coherent and finalized a multiyear agreement that expands a relationship spanning roughly 20 years across multiple optical product families. 1 •With technology roadmaps extending from today’s transceivers to architectures that will move more than 10x more data, Coherent enables multiple potential paths for scaling AI connectivity. •Coherent’s annual revenue is projected to approach $10 billion in fiscal 2027, according to consensus analyst estimates. 1Data from Nvidia as of 7/14/2026 2Data from Bloomberg as of 4/10/2026 Forecasts are estimates only and actual results may differ materially; The Fund’s holdings are subject to change; please see slide 14 for Top Ten HoldingsPowering the Lasers Behind AI Connectivity Nearly the Entire Photonics Stack NVIDIA is betting billions on the transition to photonics
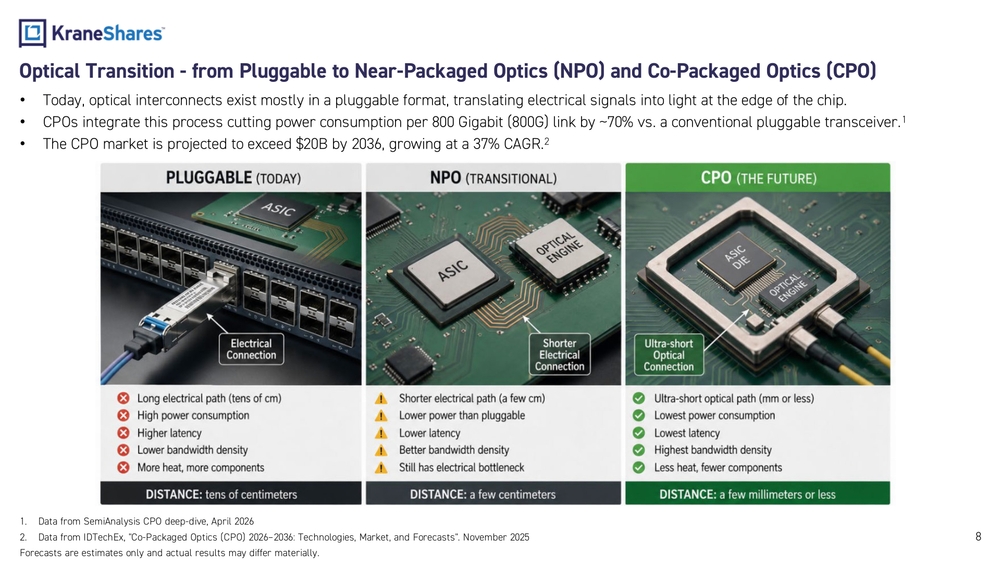
8 Optical Transition - from Pluggable to Near -Packaged Optics (NPO) and Co-Packaged Optics (CPO) •Today, optical interconnects exist mostly in a pluggable format, translating electrical signals into light at the edge of the chip. •CPOs integrate this process cutting power consumption per 800 Gigabit (800G) link by ~70% vs. a conventional pluggable transc eiver.1 •The CPO market is projected to exceed $20B by 2036, growing at a 37% CAGR.2 1.Data from SemiAnalysis CPO deep -dive, April 2026 2.Data from IDTechEx , "Co- Packaged Optics (CPO) 2026 –2036: Technologies, Market, and Forecasts". November 2025 Forecasts are estimates only and actual results may differ materially.
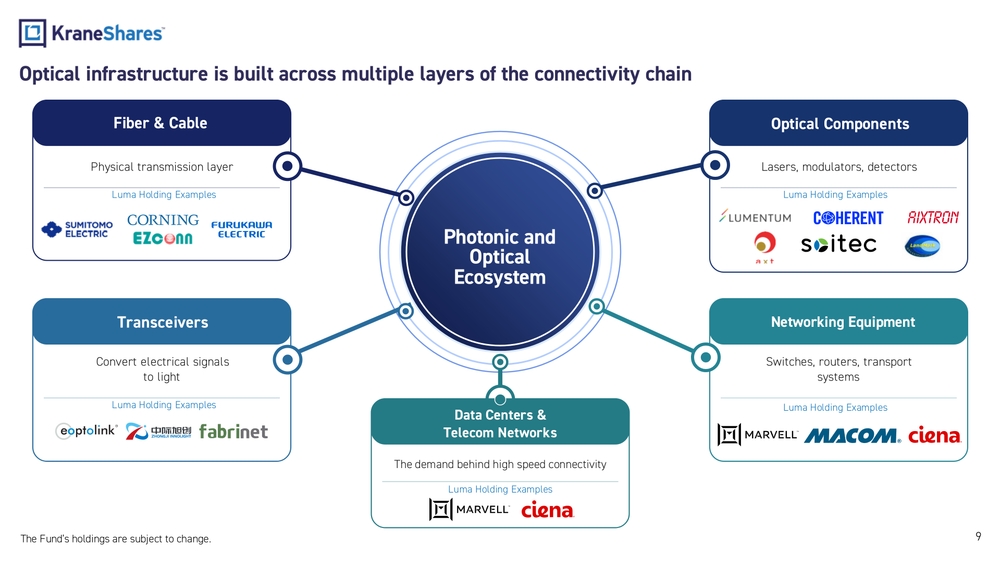
9Optical infrastructure is built across multiple layers of the connectivity chain Fiber & Cable Physical transmission layer Transceivers Convert electrical signals to lightOptical Components Lasers, modulators, detectors Networking Equipment Switches, routers, transport systems Data Centers & Telecom Networks The demand behind high speed connectivityPhotonic and Optical EcosystemLuma Holding Examples Luma Holding ExamplesLuma Holding Examples Luma Holding Examples Luma Holding Examples The Fund’s holdings are subject to change.
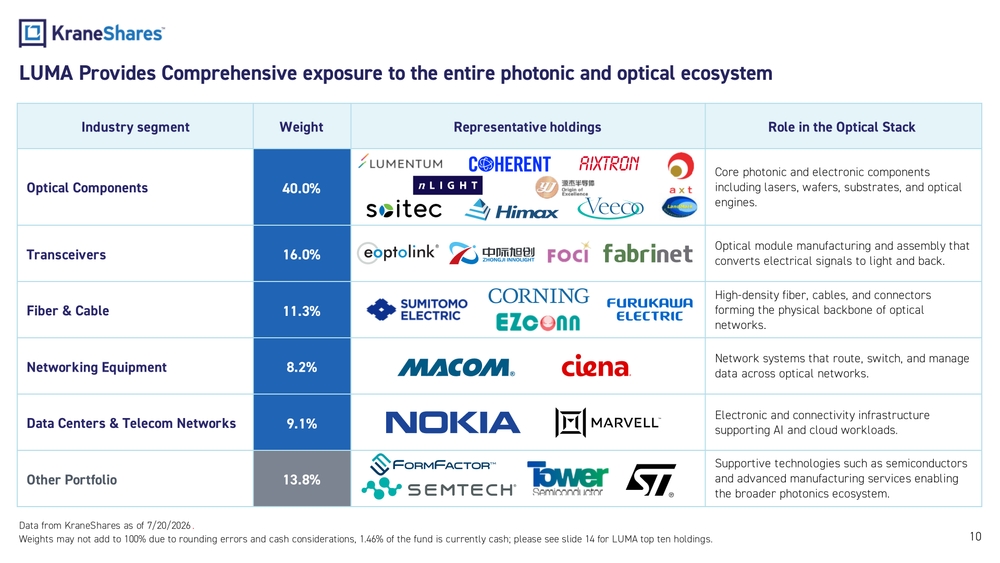
Data from KraneShares as of 7/20/2026 . Weights may not add to 100% due to rounding errors and cash considerations, 1.46% of the fund is currently cash; please see slide 14 for LUMA top ten holdings.Industry segment Weight Representative holdings Role in the Optical Stack Optical Components 40.0%Core photonic and electronic components including lasers, wafers, substrates, and optical engines. Transceivers 16.0%Optical module manufacturing and assembly that converts electrical signals to light and back. Fiber & Cable 11.3%High -density fiber, cables, and connectors forming the physical backbone of optical networks. Networking Equipment 8.2%Network systems that route, switch, and manage data across optical networks. Data Centers & Telecom Networks 9.1%Electronic and connectivity infrastructure supporting AI and cloud workloads. Other Portfolio 13.8%Supportive technologies such as semiconductors and advanced manufacturing services enabling the broader photonics ecosystem. LUMA Provides Comprehensive exposure to the entire photonic and optical ecosystem 10
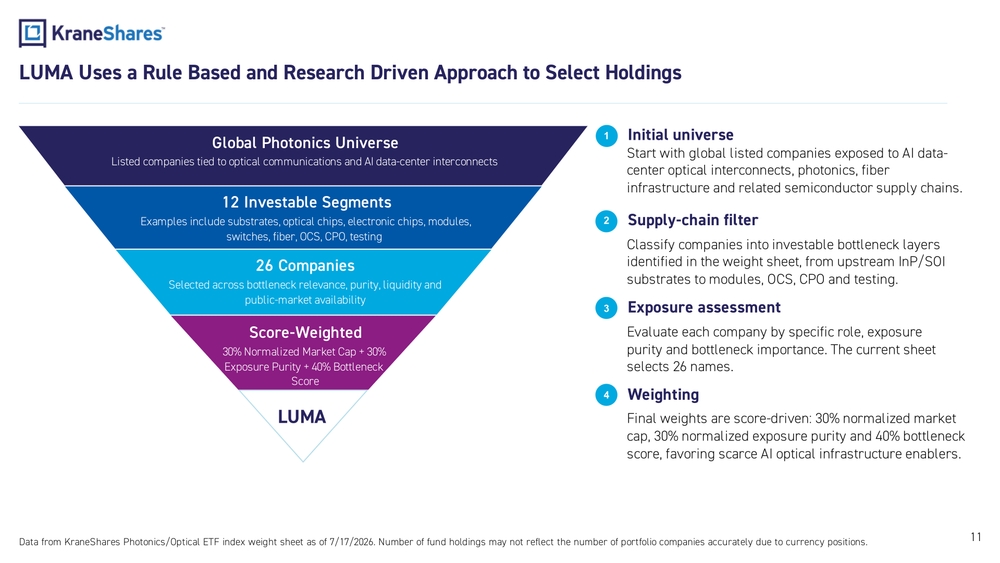
Global Photonics Universe Listed companies tied to optical communications and AI data- center interconnects 12 Investable Segments Examples include s ubstrates, optical chips, electronic chips, modules, switches, fiber, OCS, CPO, testing 26 Companies Selected across bottleneck relevance, purity, liquidity and public -market availability Score -Weighted 30% Normalized Market Cap + 30% Exposure Purity + 40% Bottleneck Score1Initial universe 2Supply- chain filter 3Exposure assessment 4Weighting Data from KraneShares Photonics/Optical ETF index weight sheet as of 7/17/2026. Number of fund holdings may not reflect the number of portfolio companies accurately due to currency positions.LUMA Uses a Rule Based and Research Driven Approach to Select Holdings Start with global listed companies exposed to AI data - center optical interconnects, photonics, fiber infrastructure and related semiconductor supply chains. Classify companies into investable bottleneck layers identified in the weight sheet, from upstream InP/SOI substrates to modules, OCS, CPO and testing. Evaluate each company by specific role, exposure purity and bottleneck importance. The current sheet selects 26 names. Final weights are score -driven: 30% normalized market cap, 30% normalized exposure purity and 40% bottleneck score, favoring scarce AI optical infrastructure enablers.LUMA 11
12LUMA Top 10 Holdings Company TickerLUMA Weight (%)Country Description LITE 6.61% USLumentum is a U.S. optical component leader with sole -source positioning in EML lasers for 1.6T transceivers, a strong market share in optical circuit switching, and growing external laser source exposure for co- packaged optics. COHR 6.24% USCoherent is a U.S. photonics platform spanning InP lasers, silicon photonics, optical modules, and data center interconnect, offering route -neutral exposure across the full optical supply chain. MTSI 5.44% USMACOM is a U.S. analog semiconductor leader with leading market share in LPO driver and TIA chips, serving as Nvidia's sole -source supplier for high- speed linear optical connectivity. AIXA 5.43% DEAixtron is a German equipment leader supplying MOCVD tools with leading market share, the essential manufacturing gateway for InP and III -V compound semiconductor capacity expansion. TSEM 5.12% ILTower Semi is an Israel -based specialty foundry and leading silicon photonics manufacturing platform, positioned to benefit from silicon photonics design wins regardless of which architecture prevails. AXTI 5.10% USAXT is a U.S.- listed indium phosphide substrate supplier positioned at the most upstream and supply -constrained layer of the optical component value chain. 300502 5.08% CNEoptolink is a China based optical transceiver supplier with exposure to linear -drive pluggable optics and next - generation AI networking. MRVL 4.97% USMarvell is a U.S. fabless semiconductor leader in DSP chips for long- reach optical links, expanding into co- packaged optics through its acquisition of Celestial AI. 300308 4.67% CNInnoLight is a China based optical transceiver leader and one of the world’s largest suppliers of high- speed data center modules. SOI 4.45% FRSOITEC is a French company that leads in designing and manufacturing semiconductor materials and specializes in engineered substrate products. The Fund’s holdings are subject to change. Data from Bloomberg and KraneShares as of 7/20/2026 excluding cash. 1.46% of the fund is currently cash. Please see the end of the presentation for definitions.
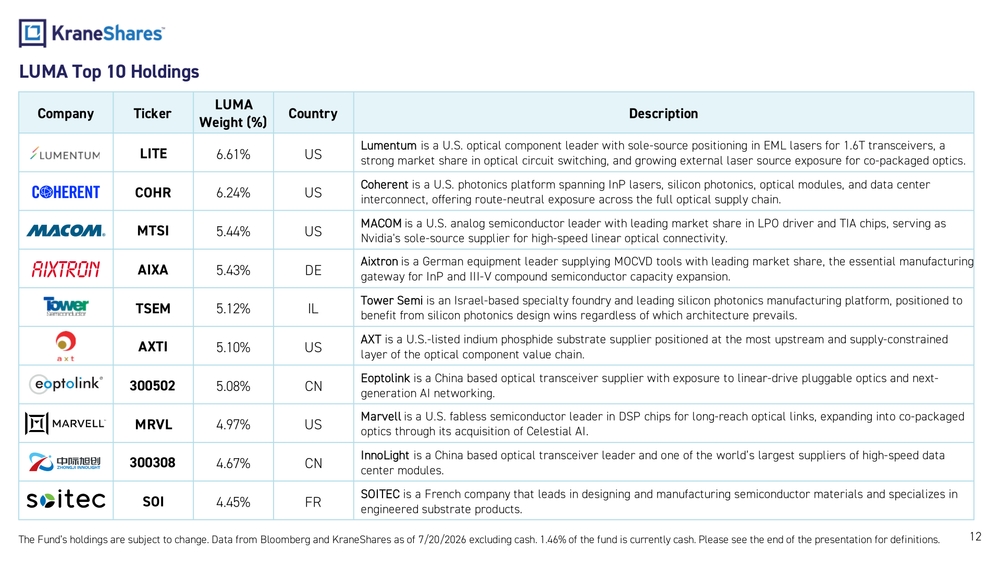
United States 42.3% Taiwan 13.5%China 11.6%Japan 5.4%Germany 5.1%Israel 5.2%France 4.5%Switzerland 4.2%Finland 3.3%Thailand 3.4% 13LUMA’s Geographical Exposure Key Takeaways •U.S. exposure leads at 42.3% , driven by companies producing world -class lasers, high -speed optical engines, and advanced connectivity components powering next- generation AI networks. •Asia represents 34% of the portfolio, anchored in Taiwan, China, and Japan, with companies producing optical modules, photonic engines, and semiconductors that power high- speed AI and cloud networks. •Europe and Israel provide strategic access to specialized photonics technologies, giving LUMA a specialized exposure in the global AI supply chain. The Fund’s holdings are subject to change. Excluding cash. 1.46% of the fund is currently cash. Data from KraneShares as of 7/20/2026. Please see the end of the presentation for definitions.
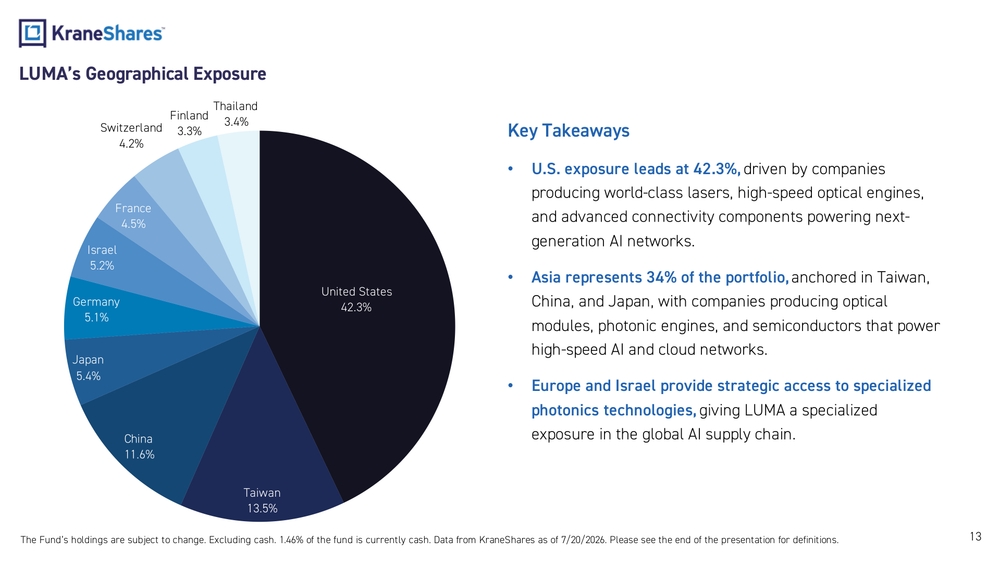
Fund Details Data as of 7/20/2026
Primary Exchange NYSE Arca
CUSIP 500767140
ISIN US5007671408
Total Annual Fund
Operating Expense
(Gross)1.00%
Total Annual Fund
Operating Expense (Net).65%*
Inception Date 07/14/2026
Distribution Frequency Annual
Management Style Active
Net Assets $2,223,044
Number ofHoldings 29Top 10 Holdings as of 7/20/2026
Excluding cash. Holdings are subject to change.Ticker %
LUMENTUM HOLDINGS INCLITE 6.61%
COHERENT CORPCOHR 6.24%
MACOM TECHNOLOGY SOLUTIONS HMTSI 5.44%
AIXTRON SEAIXA 5.43%
TOWER SEMICONDUCTOR LTDTSEM 5.12%
AXT INCAXTI 5.10%
EOPTOLINK TECHNOLOGY INC L -A300502 5.08%
MARVELL TECHNOLOGY INCMRVL 4.97%
ZHONGJI INNOLIGHT CO LTD -A300308 4.67%
S.O.I.T.E.C.SOI 4.45%KraneShares Photonic and Optical ETF
Investment Strategy:
LUMA seeks growth of capital through exposure to both public and
private companies worldwide that develop optical interconnects,
transceivers, fiber -optic cables, and other light- based infrastructure
designed to move vast amounts of data at the speed of light.
As AI models and computing clusters scale, data movement is
emerging as one of the industry’s most significant bottlenecks.
Traditional copper -based connections are likely approaching their
physical and economic limits, accelerating the transition toward
optical data transmission across chips, servers, and data centers. LUMA is designed to capture the long -term growth opportunity
created by this structural shift from electrons to photons.
LUMA Performance History as of 07/20/2026:
Cumulative % Average Annualized %
3Mo 6Mo Since Inception 1Yr 3Yr 5Yr Since Inception
Fund NAV – – – – – – –
Closing Price – – – – – – –
Theperformance data quoted represents past performance. Past performance does notguarantee future results. Theinvestment return andprincipal value ofaninvestment willfluctuate sothat
aninvestors shares, when sold orredeemed, may beworth more orless than their original cost andcurrent performance may belower orhigher than theperformance quoted. Forperformance
data current tothemost recent month end, please visit https://www.kraneshares.com/etf/luma .
*Krane has voluntarily waived its advisory fee by 0.35% of the Fund's average daily net assets. Krane may modify or terminate this waiver without notice to the Fund. 14
KraneShares Empowering investors with access to the world’ s most powerful growth themes through ETFs, private strategies, and innovative investment solutions. 15
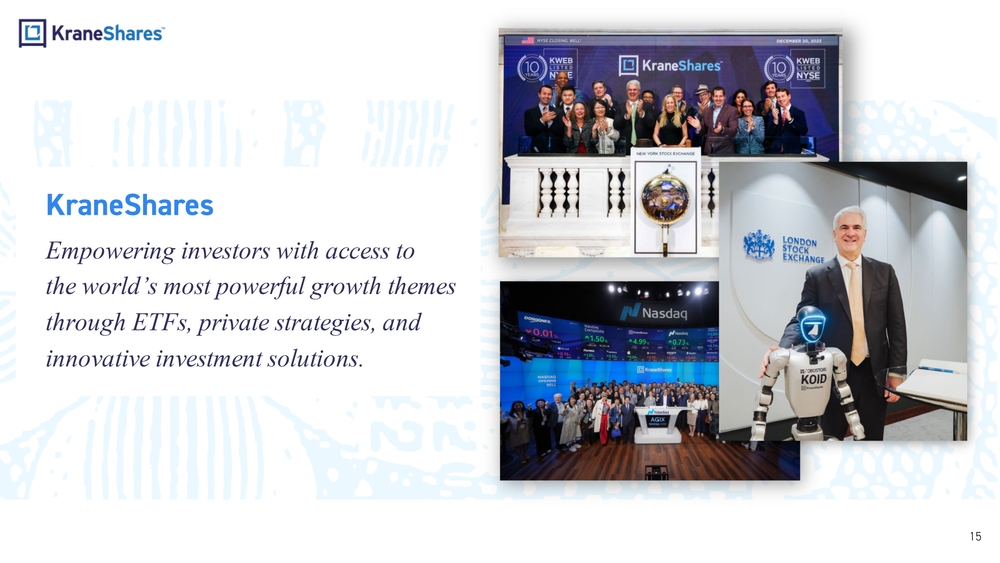
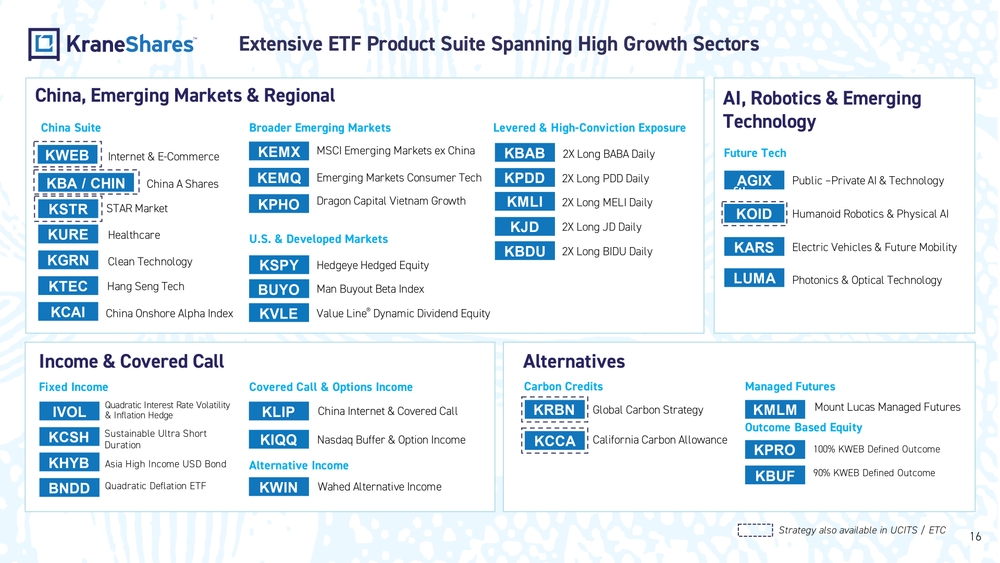
fiber optic network free stock photoChina, Emerging Markets & Regional Alternatives Income & Covered Call AI, Robotics & Emerging Technology KURE Healthcare KGRN Clean TechnologyKSTR STAR Market KTEC Hang Seng TechKWEB Internet & E -Commerce China A Shares KBA / CHIN KCAI China Onshore Alpha IndexAGIX Public –Private AI & Technology KOID Humanoid Robotics & Physical AI Electric Vehicles & Future Mobility KARSChina Suite Future TechBroader Emerging Markets KEMQ Emerging Markets Consumer Tech KPHODragon Capital Vietnam GrowthKEMX MSCI Emerging Markets ex China U.S. & Developed Markets KVLE Value Line® Dynamic Dividend EquityHedgeye Hedged Equity KSPY Man Buyout Beta Index BUYO Fixed Income BNDDQuadratic Deflation ETFIVOLQuadratic Interest Rate Volatility & Inflation Hedge KHYB Asia High Income USD BondSustainable Ultra Short DurationKCSHGlobal Carbon Strategy KRBNCarbon CreditsKPDD 2X Long PDD Daily KJD 2X Long JD DailyKBAB 2X Long BABA Daily KMLI 2X Long MELI Daily Covered Call & Options Income Managed Futures KMLMMount Lucas Managed Futures KWIN Wahed Alternative IncomeKLIP China Internet & Covered Call Outcome Based Equity KIQQ Nasdaq Buffer & Option IncomeLevered & High- Conviction Exposure KBUF90% KWEB Defined Outcome100% KWEB Defined Outcome KPRO Alternative Income KCCA California Carbon AllowanceExtensive ETF Product Suite Spanning High Growth Sectors Strategy also available in UCITS / ETCKBDU 2X Long BIDU Daily 16Photonics & Optical Technology LUMA
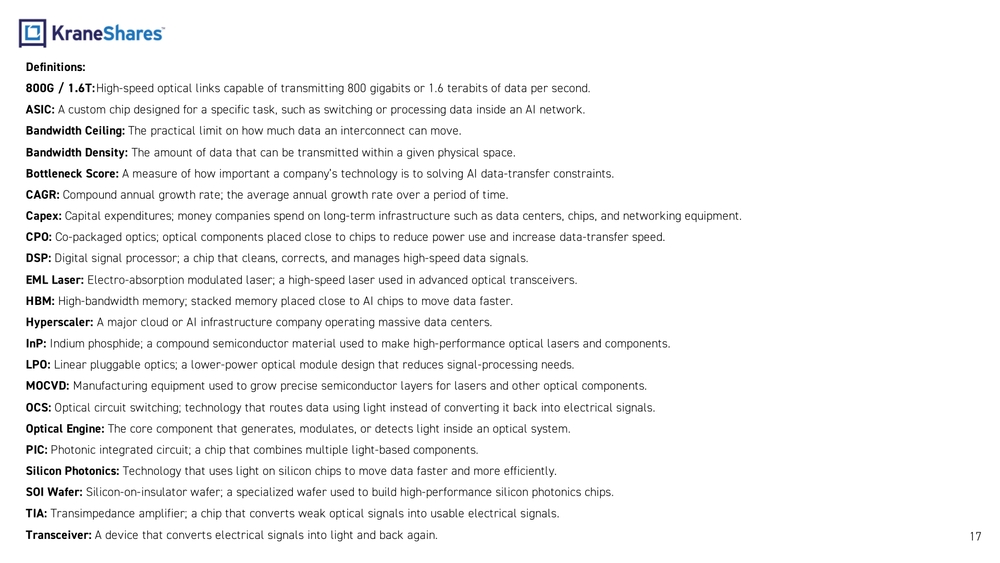
17Definitions: 800G / 1.6T: High -speed optical links capable of transmitting 800 gigabits or 1.6 terabits of data per second. ASIC: A custom chip designed for a specific task, such as switching or processing data inside an AI network. Bandwidth Ceiling: The practical limit on how much data an interconnect can move. Bandwidth Density: The amount of data that can be transmitted within a given physical space. Bottleneck Score: A measure of how important a company’s technology is to solving AI data- transfer constraints. CAGR: Compound annual growth rate; the average annual growth rate over a period of time. Capex: Capital expenditures; money companies spend on long- term infrastructure such as data centers, chips, and networking equipment. CPO: Co-packaged optics; optical components placed close to chips to reduce power use and increase data- transfer speed. DSP: Digital signal processor; a chip that cleans, corrects, and manages high- speed data signals. EML Laser: Electro -absorption modulated laser; a high- speed laser used in advanced optical transceivers. HBM: High -bandwidth memory; stacked memory placed close to AI chips to move data faster. Hyperscaler :A major cloud or AI infrastructure company operating massive data centers. InP:Indium phosphide; a compound semiconductor material used to make high- performance optical lasers and components. LPO: Linear pluggable optics; a lower -power optical module design that reduces signal -processing needs. MOCVD: Manufacturing equipment used to grow precise semiconductor layers for lasers and other optical components. OCS: Optical circuit switching; technology that routes data using light instead of converting it back into electrical signals. Optical Engine: The core component that generates, modulates, or detects light inside an optical system. PIC: Photonic integrated circuit; a chip that combines multiple light -based components. Silicon Photonics: Technology that uses light on silicon chips to move data faster and more efficiently. SOI Wafer: Silicon -on-insulator wafer; a specialized wafer used to build high- performance silicon photonics chips. TIA: Transimpedance amplifier; a chip that converts weak optical signals into usable electrical signals. Transceiver: A device that converts electrical signals into light and back again.
Carefully consider the Funds’ investment objectives, risk factors, charges and expenses before investing. This and additional information can be found in the Funds’ full and summary prospectus, which may be obtained by visiting www.kraneshares.com /LUMA . Read the prospectus carefully before investing. Risk Disclosures: Investing involves risk, including possible loss of principal. There can be no assurance that a Fund will achieve its stated obj ectives. Indices are unmanaged and do not include the effect of fees. One cannot invest directly in an index. This information should not be relied upon as research, investment advice, or a recommendation regarding any products, strate gies, or any security in particular. This material is strictly for illustrative, educational, or informational purposes and is subject to change. Certain content represents an assessment of t he market environment at a specific time and is not intended to be a forecast of future events or a guarantee of future results; material is as of the dates noted and is subject to change without notice. Narrowly focused investments typically exhibit higher volatility. The Fund may invest in Initial Public Offerings (IPOs). Sec urities issued in IPOs have no trading history, and information about the companies may be available for very limited periods. In addition, the prices of securities sold in IPOs may be highly volatile. In addition, as the Fund increases in size, the impact of IPOs on the Fund’s performance will generally decrease. The Fund is subject to liquidity risk, meaning that certain investments may become difficult to purchase or sell at a reasonable time and price. If a transaction for these securities is large, it may not be possible to initiate which may cause the Fund to suffer losses. The Fund’s assets are expected to be concentrated in an industry or group of industries, especially the Technology Sector, Communications Services Sector, and com panies focused on Artificial Intelligence and Technology. International investments may involve risk of capital loss from unfavorable fluctuation in currency values, from differences in generally accepted accounting principles or from social, economic or political instability in other nations. Emerging markets involve heightened risk related to the same factors as w ell as increased volatility and lower trading volume. The Fund may invest in derivatives, which are often more volatile than other investments and may magnify the Fund’s gains or losses. The Fund may invest in private companies. Private companies involve greater risks than investments in securities of companies that have traded publicly on an exchange for extended periods of time. Investments in these companies are generally less liquid than investments in securities issued by public com panies and may be difficult for the Fund to value. In addition to the normal risks associated with investing, investments in smaller companies typically exhibit higher volatility. LUMA is non-diversified. ETF shares are bought and sold on an exchange at market price (not NAV) and are not individually redeemed from the Fund. Howe ver, shares may be redeemed at NAV directly by certain authorized broker -dealers (Authorized Participants) in very large creation/redemption units. The returns shown do not re present the returns you would receive if you traded shares at other times. Shares may trade at a premium or discount to their NAV in the secondary market. Brokerage commissions will reduce returns. Beginning 12/23/2020, market price returns are based on the official closing price of an ETF share or, if the official closing price isn't available, the mid point between the national best bid and national best offer ("NBBO") as of the time the ETF calculates the current NAV per share. Prior to that date, market price returns were based on the midpoint between the Bid and Ask price. NAVs are calculated using prices as of 4:00 PM Eastern Time. The KraneShares ETFs and KFA Funds ETFs are distributed by SEI Investments Distribution Company (SIDCO), 1 Freedom Valley Drive, Oaks, PA 194 56, which is not affiliated with Krane Funds Advisors, LLC, the Investment Adviser for the Funds, or any sub- advisers for the Funds. 18