China AI ETF | KCAI | KraneShares
by Kraneshares
KCAI 6/30/2026 AI-Optimized Onshore China Exposure Overview of the KraneShares China Alpha Index ETF (Ticker: KCAI) info@kraneshares.com
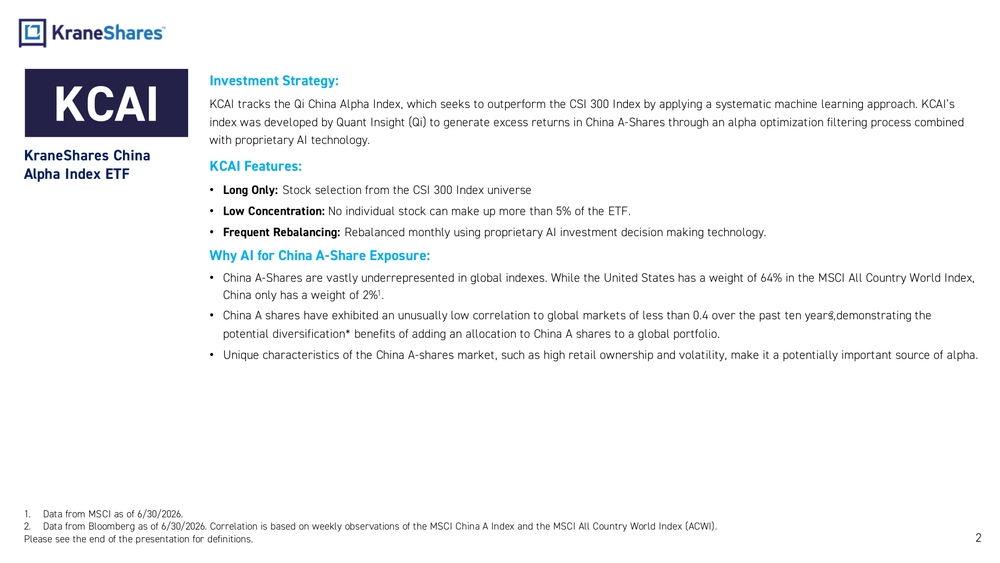
KCAI KraneShares China Alpha Index ETF 21.Data from MSCI as of 6/30/2026. 2.Data from Bloomberg as of 6/30/2026. Correlation is based on weekly observations of the MSCI China A Index and the MSCI All C ountry World Index (ACWI). Please see the end of the presentation for definitions.Investment Strategy: KCAI tracks the Qi China Alpha Index, which seeks to outperform the CSI 300 Index by applying a systematic machine learning approach. KCAI’s index was developed by Quant Insight (Qi) to generate excess returns in China A -Shares through an alpha optimization filtering p rocess combined with proprietary AI technology. KCAI Features: •Long Only: Stock selection from the CSI 300 Index universe •Low Concentration: No individual stock can make up more than 5% of the ETF. •Frequent Rebalancing: Rebalanced monthly using proprietary AI investment decision making technology. Why AI for China A -Share Exposure: •China A -Shares are vastly underrepresented in global indexes. While the United States has a weight of 64% in the MSCI All Countr y World Index, China only has a weight of 2%1. •China A shares have exhibited an unusually low correlation to global markets of less than 0.4 over the past ten years,2 demonstrating the potential diversification* benefits of adding an allocation to China A shares to a global portfolio. •Unique characteristics of the China A -shares market, such as high retail ownership and volatility, make it a potentially importa nt source of alpha.
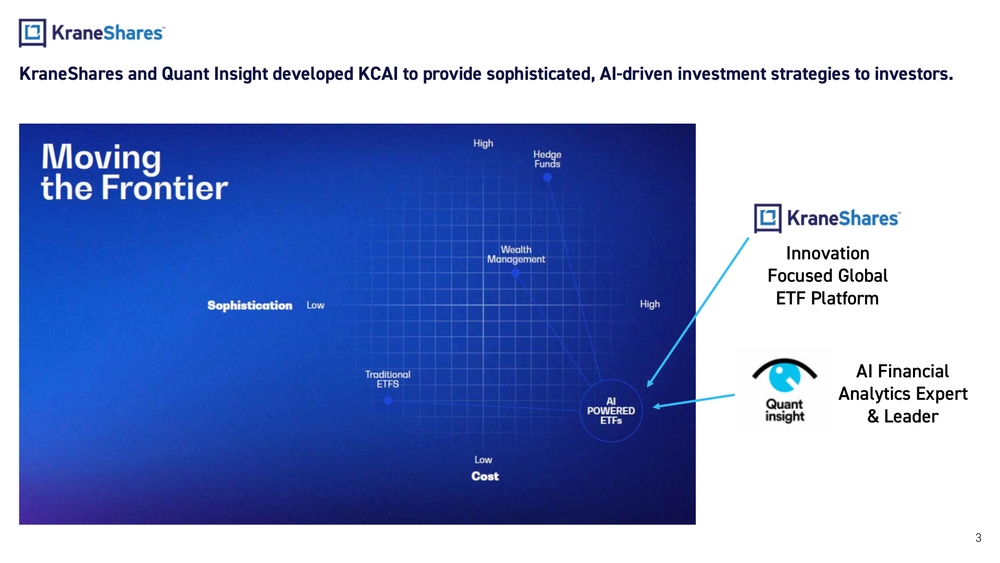
3KraneShares and Quant Insight developed KCAI to provide sophisticated, AI -driven investment strategies to investors. Innovation Focused Global ETF Platform AI Financial Analytics Expert & Leader
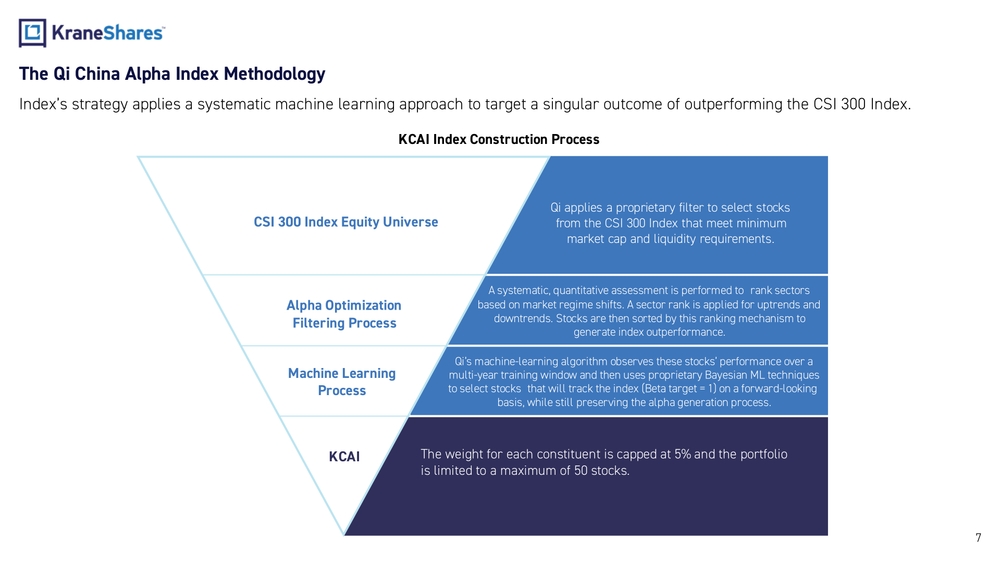
4Introducing Quant Insight (Qi) Quant Insight is a pioneer in using artificial intelligence to power investment outcomes. Quant Insight Quick Facts •Founded in 2016 •Proven AI and machine learning techniques for ETF construction •Strong track record of developing and managing AI powered indexes •Leverages intellectual property from Cambridge University’s Astrophysics team •Quant Insight’s clients include the world’s largest asset managers.Quant Insight Clients Prof. Mike Hobson Cambridge UniversityProf. Ryan Prescott Adams Princeton University Mahmood Noorani CEO Quant InsightQuant Insight Team Source: Quant Insight
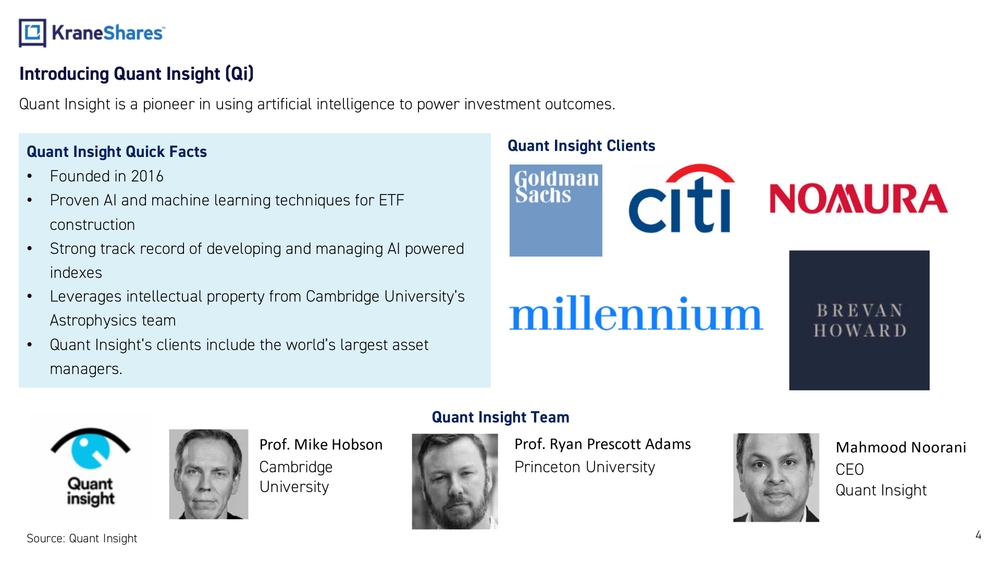
5Why are China A -Shares well suited for AI alpha generation? We believe the market is highly inefficient, with high retail participation compared to other global equity markets. Data from Morgan Stanley Execution Services, Japan Exchange Group, Reuters, Public.com, Shanghai Stock Exchange, and Bloomber g as of 12/31/2025. Data includes estimates.0102030405060708090 China A-Shares Hong Kong United States Japan% of Total VolumeRetail Investor Participation
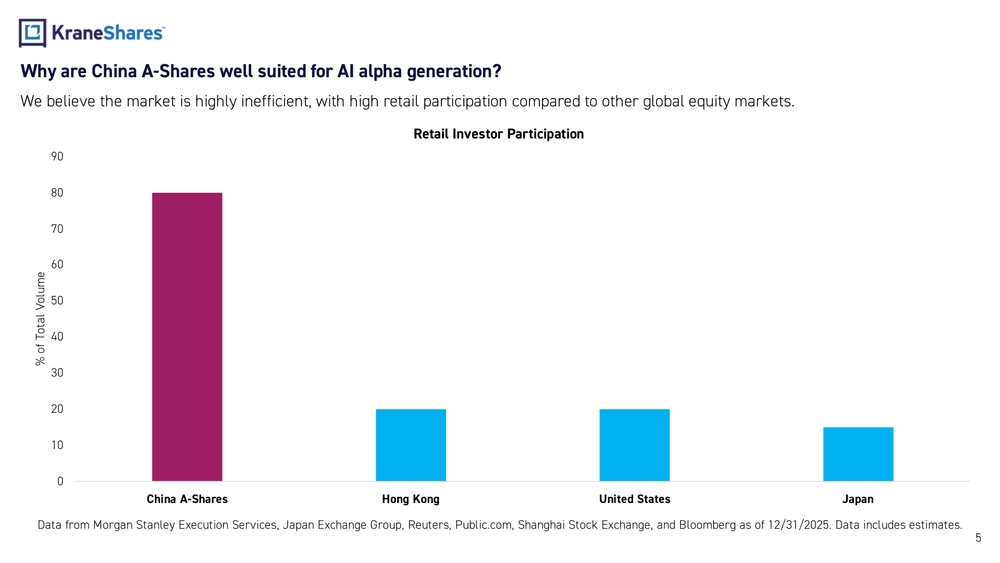
6Why are China A -Shares well suited for AI alpha generation? China A -Shares have followed a boom -and-bust cycle over the past decade, leading to heightened volatility and potential opportun ities for a more sophisticated strategy to take advantage of pullbacks. Data from Bloomberg as of 6/30/2026. Index performance is for illustrative purposes only. Indexes are unmanaged and one canno t invest directly in an index. Index returns do not reflect fees or other costs associated with investing. Past performance does not guarantee future results. Please see the end of the presentation for definitions.CSI 300 ACWI Annualized Volatility21.09% 14.19% Annualized Return 7.72% 10.96% 9,00014,00019,00024,00029,00034,00039,000 12/1/2013 7/1/2014 2/1/2015 9/1/2015 4/1/2016 11/1/2016 6/1/2017 1/1/2018 8/1/2018 3/1/2019 10/1/2019 5/1/2020 12/1/2020 7/1/2021 2/1/2022 9/1/2022 4/1/2023 11/1/2023 6/1/2024 1/1/2025 8/1/2025 3/1/2026Growth of 10,000 unitsCSI 300 vs. Global Equities CSI 300 Index MSCI All Country World Index (ACWI)
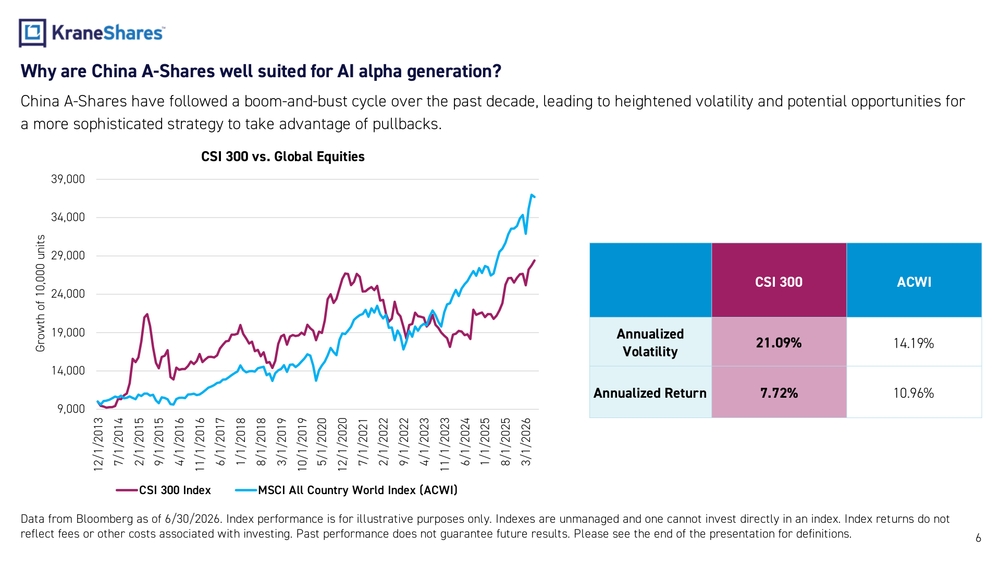
7The Qi China Alpha Index Methodology Index’s strategy applies a systematic machine learning approach to target a singular outcome of outperforming the CSI 300 Ind ex. A systematic, quantitative assessment is performed to rank sectors based on market regime shifts. A sector rank is applied for uptrends and downtrends. Stocks are then sorted by this ranking mechanism to generate index outperformance. Qi’s machine -learning algorithm observes these stocks’ performance over a multi -year training window and then uses proprietary Bayesian ML techniques to select stocks that will track the index (Beta target = 1) on a forward -looking basis, while still preserving the alpha generation process.CSI 300 Index Equity Universe Machine Learning ProcessAlpha Optimization Filtering Process KCAIQi applies a proprietary filter to select stocks from the CSI 300 Index that meet minimum market cap and liquidity requirements. The weight for each constituent is capped at 5% and the portfolio is limited to a maximum of 50 stocks.KCAI Index Construction Process
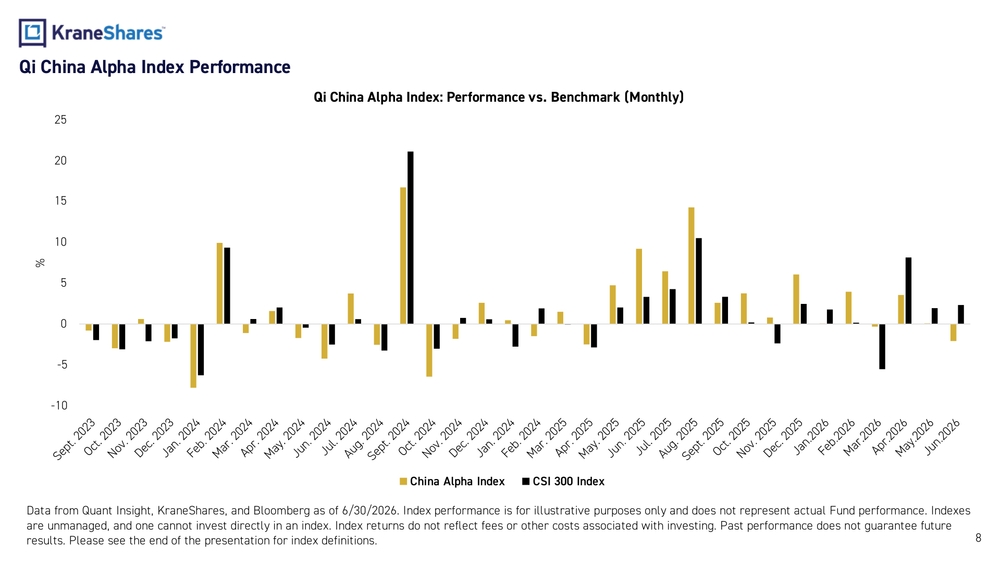
8Qi China Alpha Index Performance Data from Quant Insight, KraneShares, and Bloomberg as of 6/30/2026. Index performance is for illustrative purposes only and does not represent actual Fund performance. Indexes are unmanaged, and one cannot invest directly in an index. Index returns do not reflect fees or other costs associated with i nvesting. Past performance does not guarantee future results. Please see the end of the presentation for index definitions.-10-50510152025%Qi China Alpha Index: Performance vs. Benchmark (Monthly) China Alpha Index CSI 300 Index
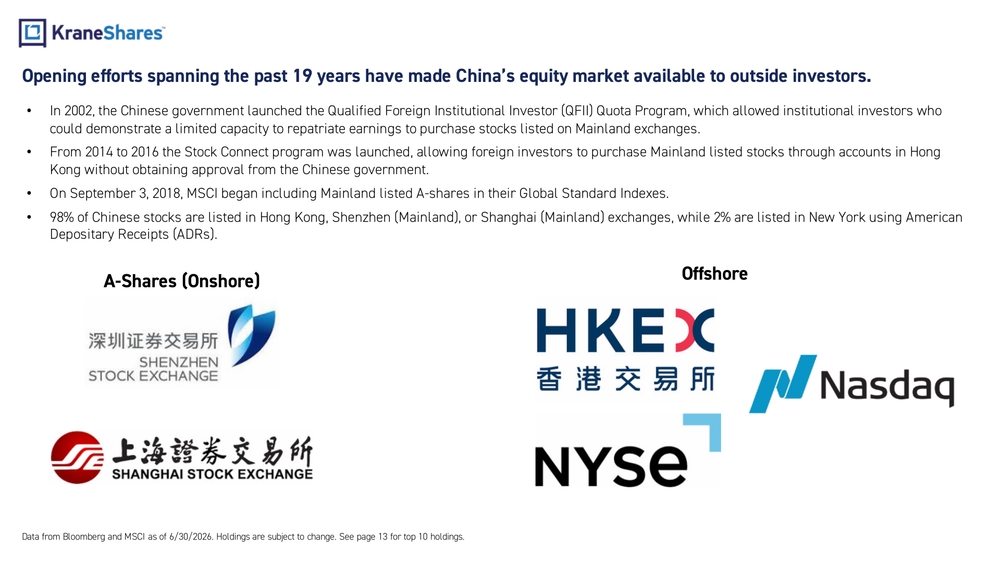
Opening efforts spanning the past 19 years have made China’s equity market available to outside investors. •In 2002, the Chinese government launched the Qualified Foreign Institutional Investor (QFII) Quota Program, which allowed ins titutional investors who could demonstrate a limited capacity to repatriate earnings to purchase stocks listed on Mainland exchanges. •From 2014 to 2016 the Stock Connect program was launched, allowing foreign investors to purchase Mainland listed stocks throu gh accounts in Hong Kong without obtaining approval from the Chinese government. •On September 3, 2018, MSCI began including Mainland listed A -shares in their Global Standard Indexes . •98% of Chinese stocks are listed in Hong Kong, Shenzhen (Mainland), or Shanghai (Mainland) exchanges, while 2% are listed in New York using American Depositary Receipts (ADRs). Data from Bloomberg and MSCI as of 6/30/2026. Holdings are subject to change. See page 13 for top 10 holdings. A-Shares (Onshore)Offshore
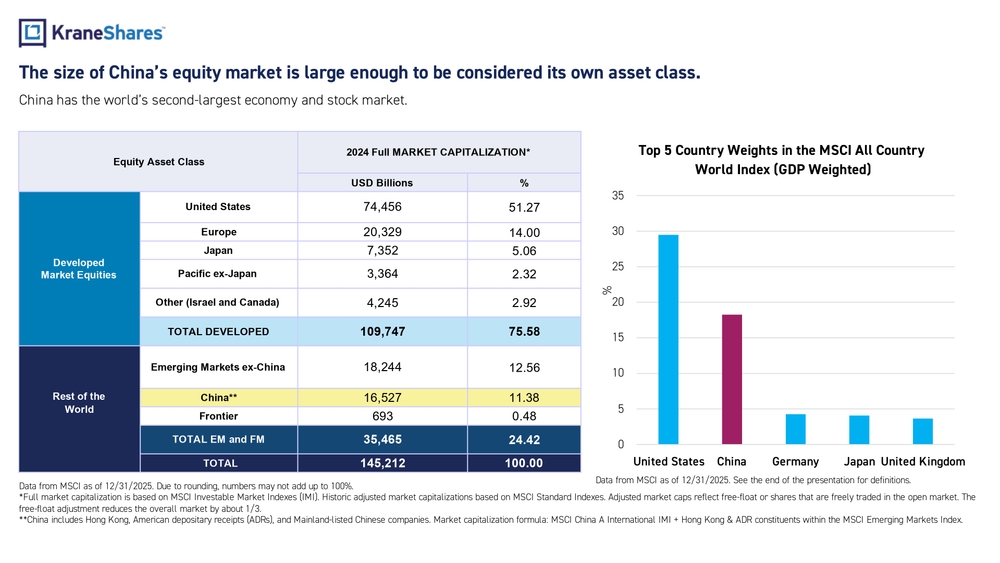
The size of China’s equity market is large enough to be considered its own asset class. China has the world’s second -largest economy and stock market. Data from MSCI as of 12 /31/2025 . See the end of the presentation for definitions.Data from MSCI as of 12/31/2025. Due to rounding, numbers may not add up to 100%. Full market capitalization is based on MSCI Investable Market Indexes (IMI). Historic adjusted market capitalizations based on MSCI Standard Indexes. Adjusted market caps reflect free -float or shares that are freely traded in the open market. The free-float adjustment reduces the overall market by about 1/3. China includes Hong Kong, American depositary receipts (ADRs), and Mainland -listed Chinese companies. Market capitalization fo rmula: MSCI China A International IMI + Hong Kong & ADR constituents within the MSCI Emerging Markets Index.Equity Asset Class2024 Full MARKET CAPITALIZATION USD Billions % Developed Market EquitiesUnited States 74,456 51.27 Europe 20,329 14.00 Japan 7,352 5.06 Pacific ex -Japan 3,364 2.32 Other (Israel and Canada) 4,245 2.92 TOTAL DEVELOPED 109,747 75.58 Rest of the WorldEmerging Markets ex -China 18,244 12.56 China 16,527 11.38 Frontier 693 0.48 TOTAL EM and FM 35,465 24.42 TOTAL 145,212 100.0005101520253035 United States China Germany Japan United KingdomTop 5 Country Weights in the MSCI All Country World Index (GDP Weighted)%
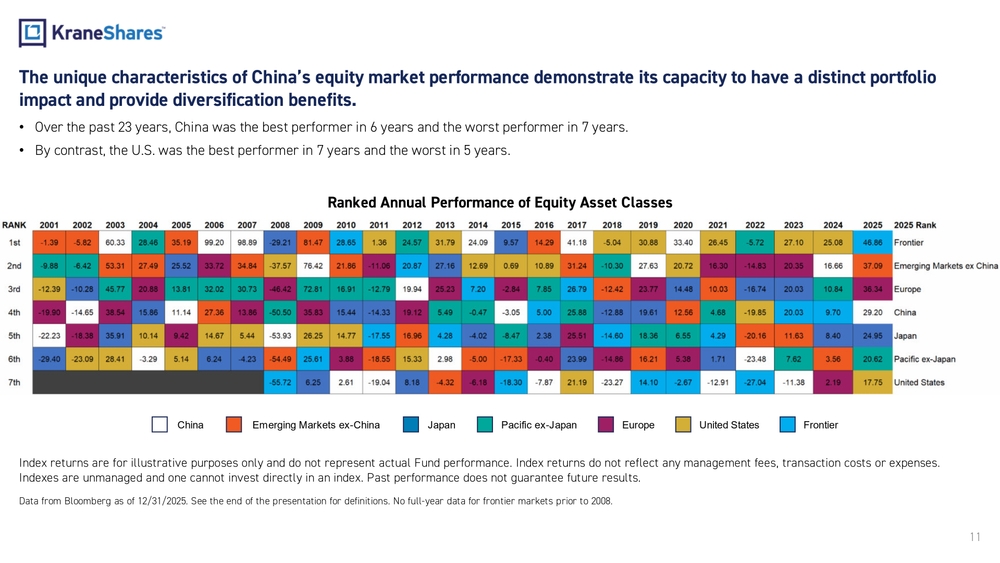
The unique characteristics of China’s equity market performance demonstrate its capacity to have a distinct portfolio impact and provide diversification benefits. •Over the past 23 years, China was the best performer in 6 years and the worst performer in 7 years. •By contrast, the U.S. was the best performer in 7 years and the worst in 5 years. Data from Bloomberg as of 12/31/2025. See the end of the presentation for definitions . No full -year data for frontier markets prior to 2008. 11Ranked Annual Performance of Equity Asset Classes Index returns are for illustrative purposes only and do not represent actual Fund performance. Index returns do not reflect a ny management fees, transaction costs or expenses. Indexes are unmanaged and one cannot invest directly in an index. Past performance does not guarantee future results. China Emerging Markets ex -China Japan Pacific ex -Japan Europe United States Frontier
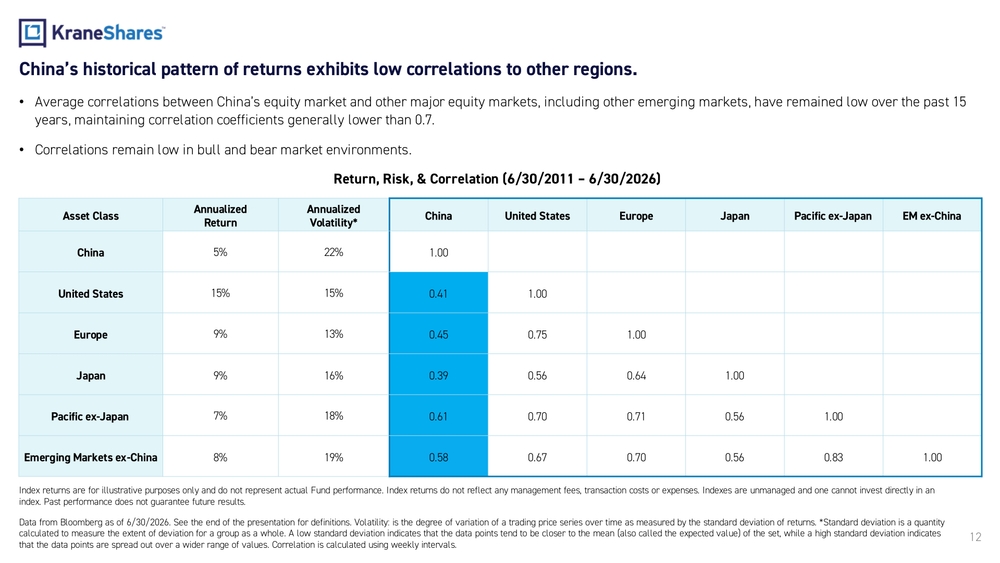
China’s historical pattern of returns exhibits low correlations to other regions. •Average correlations between China’s equity market and other major equity markets, including other emerging markets, have rem ained low over the past 15 years, maintaining correlation coefficients generally lower than 0.7. •Correlations remain low in bull and bear market environments. 12Data from Bloomberg as of 6/30/2026. Se e the end of the presentation for definitions . Volatility: is the degree of variation of a trading price series over time as measured by the standard deviation of returns. Standard deviation is a quantity calculated to measure the extent of deviation for a group as a whole. A low standard deviation indicates that the data points tend to be closer to the mean (also called the expected value) of the set, while a high standard deviation indicates that the data points are spread out over a wider range of values. Correlation is calculated using weekly intervals.Index returns are for illustrative purposes only and do not represent actual Fund performance. Index returns do not reflect a ny management fees, transaction costs or expenses. Indexes are unmanaged and one cannot invest directly in an index. Past performance does not guarantee future results. Return, Risk, & Correlation (6/30/2011 – 6/30/2026) Asset ClassAnnualized ReturnAnnualized VolatilityChina United States Europe Japan Pacific ex -Japan EM ex -China China 5% 22% 1.00 United States 15% 15% 0.41 1.00 Europe 9% 13% 0.45 0.75 1.00 Japan 9% 16% 0.39 0.56 0.64 1.00 Pacific ex -Japan 7% 18% 0.61 0.70 0.71 0.56 1.00 Emerging Markets ex -China 8% 19% 0.58 0.67 0.70 0.56 0.83 1.00
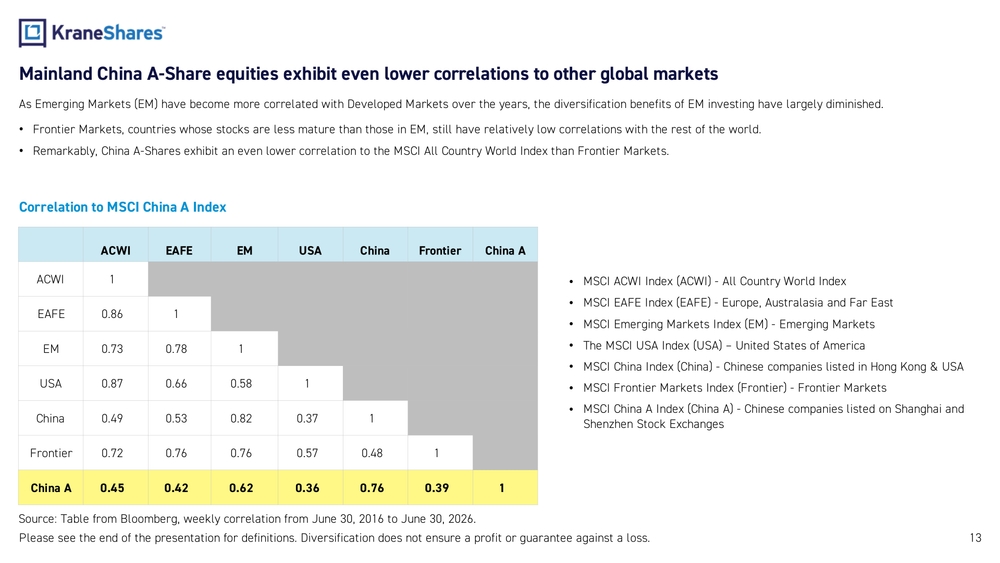
Mainland China A -Share equities exhibit even lower correlations to other global markets As Emerging Markets (EM) have become more correlated with Developed Markets over the years, the diversification benefits of E M investing have largely diminished. •Frontier Markets, countries whose stocks are less mature than those in EM, still have relatively low correlations with the re st of the world. •Remarkably, China A -Shares exhibit an even lower correlation to the MSCI All Country World Index than Frontier Markets. •MSCI ACWI Index (ACWI) - All Country World Index •MSCI EAFE Index (EAFE) - Europe, Australasia and Far East •MSCI Emerging Markets Index (EM) - Emerging Markets •The MSCI USA Index (USA) – United States of America •MSCI China Index (China) - Chinese companies listed in Hong Kong & USA •MSCI Frontier Markets Index (Frontier) - Frontier Markets •MSCI China A Index (China A) - Chinese companies listed on Shanghai and Shenzhen Stock ExchangesACWI EAFE EM USA China Frontier China A ACWI 1 EAFE 0.86 1 EM 0.73 0.78 1 USA 0.87 0.66 0.58 1 China 0.49 0.53 0.82 0.37 1 Frontier 0.72 0.76 0.76 0.57 0.48 1 China A 0.45 0.42 0.62 0.36 0.76 0.39 1 Source: Table from Bloomberg, weekly correlation from June 30, 2016 to June 30, 2026.Correlation to MSCI China A Index 13 Please see the end of the presentation for definitions. Diversification does not ensure a profit or guarantee against a loss.
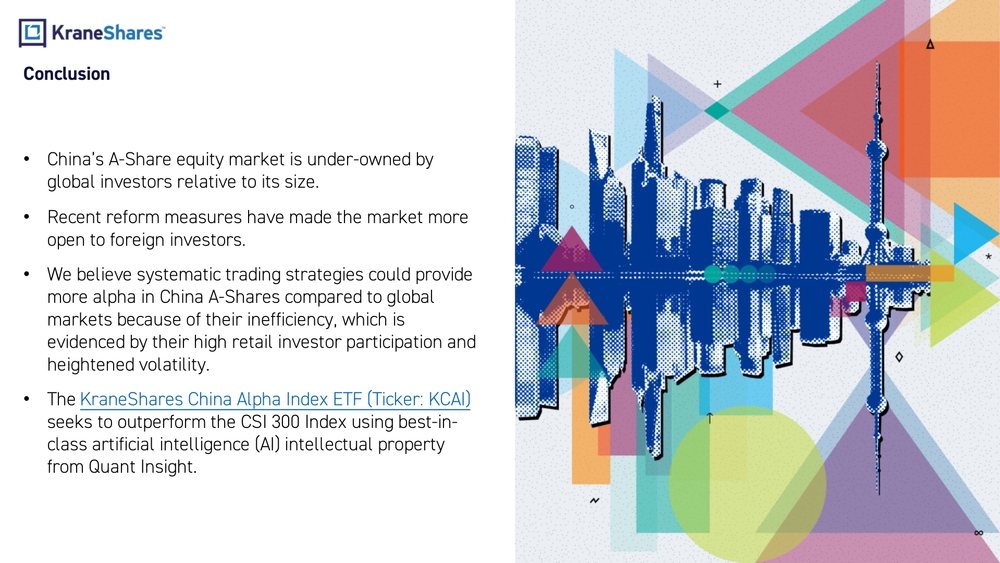
14Conclusion •China’s A -Share equity market is under -owned by global investors relative to its size. •Recent reform measures have made the market more open to foreign investors. •We believe systematic trading strategies could provide more alpha in China A -Shares compared to global markets because of their inefficiency, which is evidenced by their high retail investor participation and heightened volatility. •The KraneShares China Alpha Index ETF (Ticker: KCAI) seeks to outperform the CSI 300 Index using best-in- class artificial intelligence (AI) intellectual property from Quant Insight.
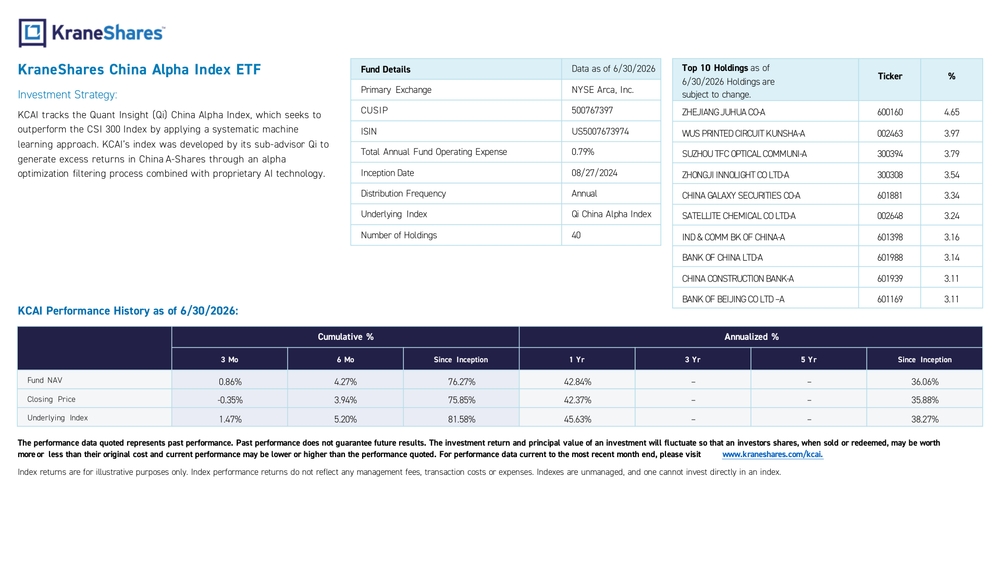
KraneShares China Alpha Index ETF Investment Strategy: KCAI tracks theQuant Insight (Qi)China Alpha Index, which seeks to outperform theCSI300Index byapplying asystematic machine learning approach. KCAI’s index was developed byitssub-advisor Qito generate excess returns inChina A-Shares through analpha optimization filtering process combined with proprietary AItechnology.Fund Details Data as of 6/30/2026 Primary Exchange NYSE Arca, Inc. CUSIP 500767397 ISIN US5007673974 Total Annual Fund Operating Expense 0.79% Inception Date 08/27/2024 Distribution Frequency Annual Underlying Index QiChina Alpha Index Number ofHoldings 40Top10Holdings asof 6/30/202 6Holdings are subject tochange.Ticker % ZHEJIANG JUHUA CO -A 600160 4.65 WUS PRINTED CIRCUIT KUNSHA -A 002463 3.97 SUZHOU TFC OPTICAL COMMUNI -A 300394 3.79 ZHONGJI INNOLIGHT CO LTD -A 300308 3.54 CHINA GALAXY SECURITIES CO -A 601881 3.34 SATELLITE CHEMICAL CO LTD -A 002648 3.24 IND & COMM BK OF CHINA -A 601398 3.16 BANK OF CHINA LTD -A 601988 3.14 CHINA CONSTRUCTION BANK -A 601939 3.11 BANK OF BEIJING CO LTD –A 601169 3.11 KCAI Performance History asof6/30/202 6: Cumulative % Annualized % 3Mo 6Mo Since Inception 1Yr 3Yr 5Yr Since Inception Fund NAV 0.86% 4.27% 76.27 % 42.84 % – – 36.06 % Closing Price -0.35% 3.94% 75.85 % 42.37 % – – 35.88 % Underlying Index 1.47% 5.20% 81.58 % 45.63 % – – 38.27 % Theperformance data quoted represents past performance. Past performance does notguarantee future results. Theinvestment return andprincipal value ofaninvestment will fluctuate sothat aninvestors shares, when sold orredeemed, may beworth more orless than their original cost andcurrent performance may belower orhigher than theperformance quoted. Forperformance data current tothemost recent month end, please visit www.kraneshares.com/kcai. Index returns areforillustrative purposes only. Index performance returns donotreflect anymanagement fees, transaction costs orexpenses. Indexes areunmanaged ,andonecannot invest directly inanindex.
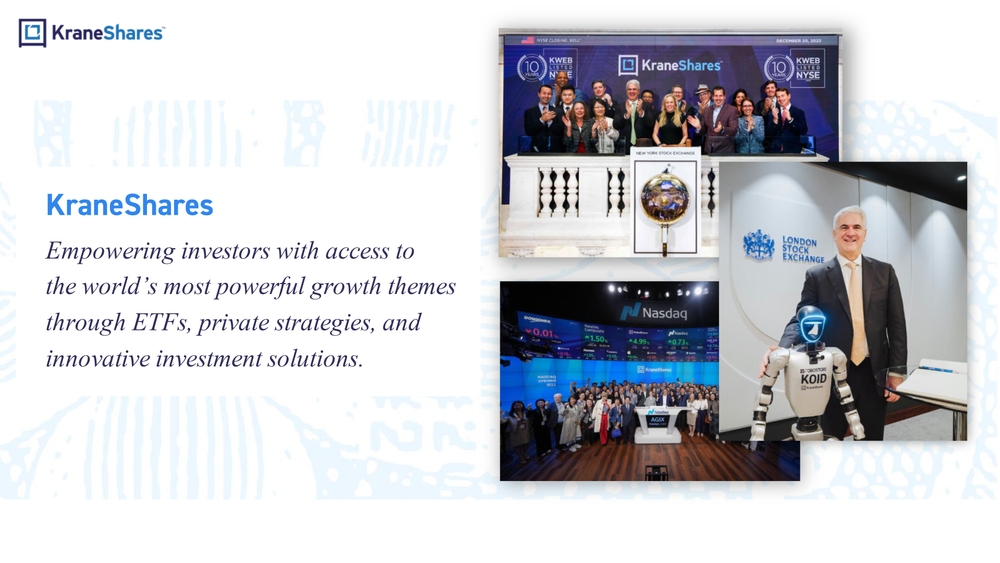
KraneShares Empowering investors with access to the world’ s most powerful growth themes through ETFs, private strategies, and innovative investment solutions.
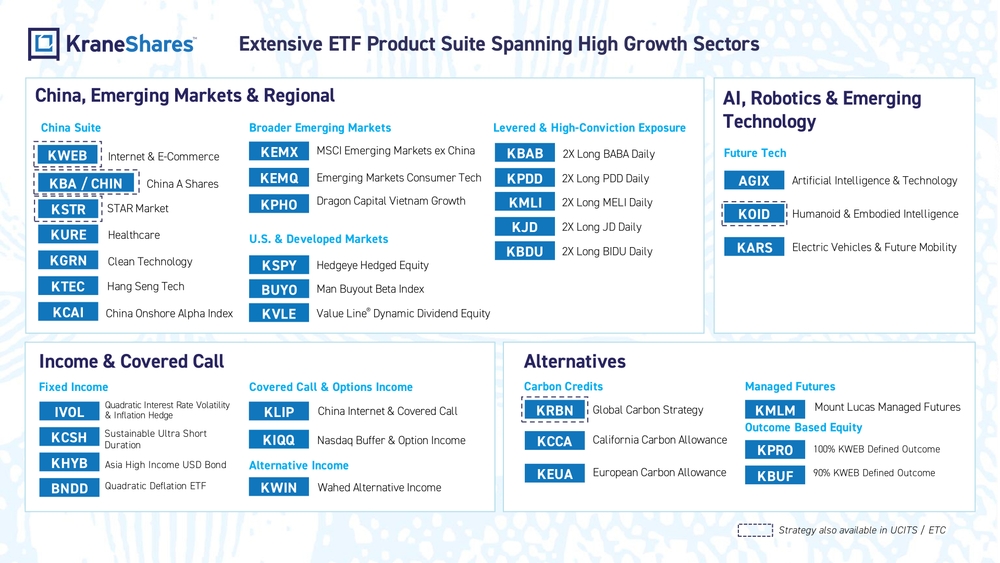
China, Emerging Markets & Regional Alternatives Income & Covered Call AI, Robotics & Emerging Technology KURE Healthcare KGRN Clean TechnologyKSTR STAR Market KTEC Hang Seng TechKWEB Internet & E -Commerce China A Shares KBA / CHIN KCAI China Onshore Alpha IndexAGIX Artificial Intelligence & Technology KOID Humanoid & Embodied Intelligence Electric Vehicles & Future Mobility KARSChina Suite Future TechBroader Emerging Markets KEMQ Emerging Markets Consumer Tech KPHODragon Capital Vietnam GrowthKEMX MSCI Emerging Markets ex China U.S. & Developed Markets KVLE Value Line® Dynamic Dividend EquityHedgeye Hedged Equity KSPY Man Buyout Beta Index BUYO Fixed Income BNDDQuadratic Deflation ETFIVOLQuadratic Interest Rate Volatility & Inflation Hedge KHYB Asia High Income USD BondSustainable Ultra Short DurationKCSH KEUA European Carbon AllowanceGlobal Carbon Strategy KRBNCarbon CreditsKPDD 2X Long PDD Daily KJD 2X Long JD DailyKBAB 2X Long BABA Daily KMLI 2X Long MELI Daily Covered Call & Options Income Managed Futures KMLMMount Lucas Managed Futures KWIN Wahed Alternative IncomeKLIP China Internet & Covered Call Outcome Based Equity KIQQ Nasdaq Buffer & Option IncomeLevered & High -Conviction Exposure KBUF90% KWEB Defined Outcome100% KWEB Defined Outcome KPRO Alternative Income KCCA California Carbon AllowanceExtensive ETF Product Suite Spanning High Growth Sectors Strategy also available in UCITS / ETCKBDU 2X Long BIDU Daily
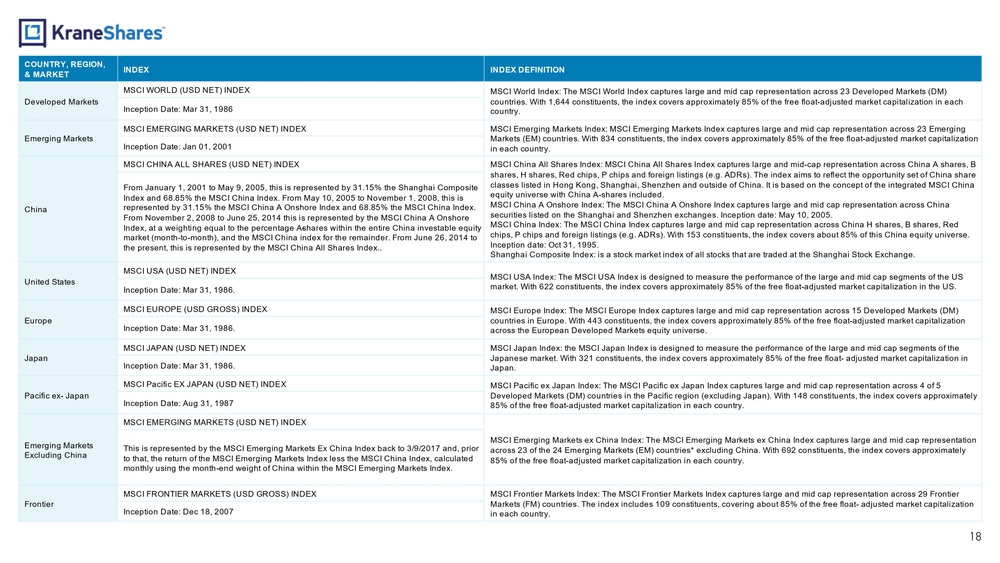
18COUNTRY, REGION,
& MARKETINDEX INDEX DEFINITION
Developed Markets MSCI WORLD (USD NET) INDEX MSCI World Index: The MSCI World Index captures large and mid cap representation across 23 Developed Markets (DM)
countries. With 1,644 constituents, the index covers approximately 85% of the free float -adjusted market capitalization in each
country. Inception Date: Mar 31, 1986
Emerging Markets MSCI EMERGING MARKETS (USD NET) INDEX MSCI Emerging Markets Index: MSCI Emerging Markets Index captures large and mid cap representation across 23 Emerging
Markets (EM) countries. With 834 constituents, the index covers approximately 85% of the free float -adjusted market capitalizati on
in each country. Inception Date: Jan 01, 2001
China MSCI CHINA ALL SHARES (USD NET) INDEX MSCI China All Shares Index: MSCI China All Shares Index captures large and mid -cap representation across China A shares, B
shares, H shares, Red chips, P chips and foreign listings (e.g. ADRs). The index aims to reflect the opportunity set of China share
classes listed in Hong Kong, Shanghai, Shenzhen and outside of China. It is based on the concept of the integrated MSCI China
equity universe with China A -shares included.
MSCI China A Onshore Index: The MSCI China A Onshore Index captures large and mid cap representation across China
securities listed on the Shanghai and Shenzhen exchanges. Inception date: May 10, 2005.
MSCI China Index: The MSCI China Index captures large and mid cap representation across China H shares, B shares, Red
chips, P chips and foreign listings (e.g. ADRs). With 153 constituents, the index covers about 85% of this China equity unive rse.
Inception date: Oct 31, 1995.
Shanghai Composite Index: is a stock market index of all stocks that are traded at the Shanghai Stock Exchange. From January 1, 2001 to May 9, 2005, this is represented by 31.15% the Shanghai Composite
Index and 68.85% the MSCI China Index. From May 10, 2005 to November 1, 2008, this is
represented by 31.15% the MSCI China A Onshore Index and 68.85% the MSCI China Index.
From November 2, 2008 to June 25, 2014 this is represented by the MSCI China A Onshore
Index, at a weighting equal to the percentage A -shares within the entire China investable equity
market (month -to-month), and the MSCI China index for the remainder. From June 26, 2014 to
the present, this is represented by the MSCI China All Shares Index..
United States MSCI USA (USD NET) INDEX MSCI USA Index: The MSCI USA Index is designed to measure the performance of the large and mid cap segments of the US
market. With 622 constituents, the index covers approximately 85% of the free float -adjusted market capitalization in the US. Inception Date: Mar 31, 1986.
Europe MSCI EUROPE (USD GROSS) INDEX MSCI Europe Index: The MSCI Europe Index captures large and mid cap representation across 15 Developed Markets (DM)
countries in Europe. With 443 constituents, the index covers approximately 85% of the free float -adjusted market capitalization
across the European Developed Markets equity universe. Inception Date: Mar 31, 1986.
Japan MSCI JAPAN (USD NET) INDEX MSCI Japan Index: the MSCI Japan Index is designed to measure the performance of the large and mid cap segments of the
Japanese market. With 321 constituents, the index covers approximately 85% of the free float - adjusted market capitalization in
Japan. Inception Date: Mar 31, 1986.
Pacific ex - Japan MSCI Pacific EX JAPAN (USD NET) INDEX MSCI Pacific ex Japan Index: The MSCI Pacific ex Japan Index captures large and mid cap representation across 4 of 5
Developed Markets (DM) countries in the Pacific region (excluding Japan). With 148 constituents, the index covers approximate ly
85% of the free float -adjusted market capitalization in each country. Inception Date: Aug 31, 1987
Emerging Markets
Excluding ChinaMSCI EMERGING MARKETS (USD NET) INDEX
MSCI Emerging Markets ex China Index: The MSCI Emerging Markets ex China Index captures large and mid cap representation
across 23 of the 24 Emerging Markets (EM) countries* excluding China. With 692 constituents, the index covers approximately
85% of the free float -adjusted market capitalization in each country. This is represented by the MSCI Emerging Markets Ex China Index back to 3/9/2017 and, prior
to that, the return of the MSCI Emerging Markets Index less the MSCI China Index, calculated
monthly using the month -end weight of China within the MSCI Emerging Markets Index.
Frontier MSCI FRONTIER MARKETS (USD GROSS) INDEX MSCI Frontier Markets Index: The MSCI Frontier Markets Index captures large and mid cap representation across 29 Frontier
Markets (FM) countries. The index includes 109 constituents, covering about 85% of the free float - adjusted market capitalizatio n
in each country. Inception Date: Dec 18, 2007
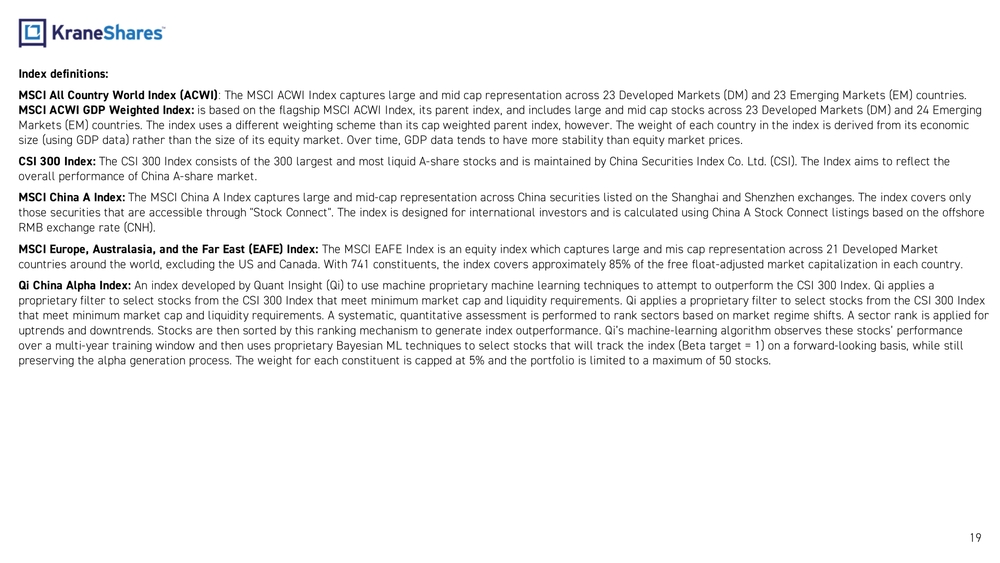
Index definitions:
MSCI All Country World Index (ACWI) : The MSCI ACWI Index captures large and mid cap representation across 23 Developed Markets (DM) and 23 Emerging Markets (EM) countries.
MSCI ACWI GDP Weighted Index: is based on the flagship MSCI ACWI Index, its parent index, and includes large and mid cap stocks across 23 Developed Markets (DM) and 24 Emerging
Markets (EM) countries. The index uses a different weighting scheme than its cap weighted parent index, however. The weight o f each country in the index is derived from its economic
size (using GDP data) rather than the size of its equity market. Over time, GDP data tends to have more stability than equity market prices.
CSI 300 Index: The CSI 300 Index consists of the 300 largest and most liquid A -share stocks and is maintained by China Securities Index Co. Ltd . (CSI). The Index aims to reflect the
overall performance of China A -share market.
MSCI China A Index: The MSCI China A Index captures large and mid -cap representation across China securities listed on the Shanghai and Shenzhen exc hanges. The index covers only
those securities that are accessible through "Stock Connect". The index is designed for international investors and is calcul ated using China A Stock Connect listings based on the offshore
RMB exchange rate (CNH).
MSCI Europe, Australasia, and the Far East (EAFE) Index: The MSCI EAFE Index is an equity index which captures large and mis cap representation across 21 Developed Market
countries around the world, excluding the US and Canada. With 741 constituents, the index covers approximately 85% of the fre e float-adjusted market capitalization in each country.
Qi China Alpha Index: An index developed by Quant Insight (Qi) to use machine proprietary machine learning techniques to attempt to outperform the CSI 300 Index. Qi applies a
proprietary filter to select stocks from the CSI 300 Index that meet minimum market cap and liquidity requirements. Qi applie s a proprietary filter to select stocks from the CSI 300 Index
that meet minimum market cap and liquidity requirements. A systematic, quantitative assessment is performed to rank sectors b ased on market regime shifts. A sector rank is applied for
uptrends and downtrends. Stocks are then sorted by this ranking mechanism to generate index outperformance. Qi’s machine -learnin g algorithm observes these stocks’ performance
over a multi -year training window and then uses proprietary Bayesian ML techniques to select stocks that will track the index (B eta target = 1) on a forward -looking basis, while still
preserving the alpha generation process. The weight for each constituent is capped at 5% and the portfolio is limited to a ma ximum of 50 stocks.
19
20Term definitions:
Morningstar -Ranked Top China A Share Mutual Fund: Morningstar ranks mutual funds in various categories including China equity. The performance quoted is for the top -ranked fund i n
the China active category, which is an A share fund, as of 9/30/2024.
Qualified Foreign Institutional Investor (QFII/RQFII): The Qualified Foreign Institutional Investor program grants access to China’s domestic stock markets to foreign institutional
investors that register with and are approved for trading by the State Administration of Foreign Exchange (SAFE). Until the l aunch of the Stock Connect program in 2016, this and the
similar Registered Qualified Foreign Institutional Investor (RQFII) were the only means by which foreign investors could acce ss stock markets in Mainland China.
Stock Connect: A mutual market access program between the Hong Kong Stock Exchange, Shanghai Stock Exchange, and Shenzhen Stock Exchange. Th e program allows investors who
are not citizens of the People’s Republic of China (PRC) to trade stocks listed on the Shanghai Stock Exchange and/or the She nzhen Stock Exchange through brokerage accounts used for
trading on the Hong Kong Stock Exchange. It also allows for flows in the other direction, allowing investors located in Mainl and China to trade certain stocks that are listed in Hong Kong.
Correlation: A statistical measure that calculates the strength of the relationship between the relative movements of two variables.
Volatility: The degree of variation of a trading price series over time as measured by the standard deviation of returns. Standard deviation is a quantity calculated to measure the extent
of deviation for a group. A low standard deviation indicates that the data points tend to be closer to the mean (also called the expected value) of the set, while a high standard deviation
indicates that the data points are spread out over a wider range of values. Correlation is calculated using weekly intervals.
Alpha : The degree to which an investment outperforms a designated benchmark.
Beta: The degree to which an investment tracks a designated benchmark.
Machine Learning (ML): The use and development of computer algorithms that are able to learn and adapt without following explicit instructions by us ing algorithms and statistical
models to analyze and draw inferences from patterns in data.
Bayesian ML: A sophisticated paradigm in the field of artificial intelligence that marries the power of statistical inference with machine learning to allow a system to improve its
predictions over time by dynamically learning from past experiences.
Important Notes: Carefully consider the Funds’ investment objectives, risk factors, charges and expenses before investing. This and additional information can be found in the Funds' full and summary prospectus, which may be obtained by visiting www.kraneshares.com /kcai .Read the prospectus carefully before investing. Risk Disclosures: Investing involves risk, including possible loss of principal. There can be no assurance that a Fund will achieve its stated objectives. Indices are unmanaged and do not include the effect of fees. One cannot invest directly in an index. This information should not be relied upon as research, investment advice, or a recommendation regarding any products, strate gies, or any security in particular. This material is strictly for illustrative, educational, or informational purposes and is subject to change. Certain content represents an assessment of the market envir onment at a specific time and is not intended to be a forecast of future events or a guarantee of future results; material is as of the dates noted and is subject to change without notice. A-Shares are issued by companies in mainland China and traded on local exchanges. They are available to domestic and certain fo reign investors, including QFIs and those participating in Stock Connect Programs like Shanghai -Hong Kong and Shenzhen -Hong Kong. Foreign investments in A -Shares face various regulations and restrictio ns, including limits on asset repatriation. A -Shares may experience frequent trading halts and illiquidity, which can lead to volatility in the Fund’s share price and increased trading halt ris ks. The Chinese economy is an emerging market, vulnerable to domestic and regional economic and political changes, often showing more volatility than developed markets. Companies face risks from pote ntial government interventions, and the export -driven economy is sensitive to downturns in key trading partners, impacting the Fund. U.S. -China tensions raise concerns over tariffs and trade restrictions , which could harm China’s exports and the Fund. China's regulatory standards are less stringent than in the U.S., resulting in limited information about issuers. Tax laws are unclear and subje ct to change, potentially impacting the Fund and leading to unexpected liabilities for foreign investors. Fluctuations in currency of foreign countries may have an adverse effect to domestic currency values. Machine learning is a part of artificial intelligence that creates algorithms to improve from data without explicit programmi ng. The Underlying Index depends on a machine learning model using various inputs, including historical data. If the model fails, the Index and Fund may lose value. Biases or errors in the model or da ta can lead to poor selections and may not be quickly corrected, harming the Fund. Additionally, machine learning models may overfit historical data and struggle with unexpected market conditions, negat ively impacting the Index and the Fund. In addition to the normal risks associated with investing, investments in mid -size companies typically exhibit higher volatility. The Fund is new and does not y et have a significant number of shares outstanding. If the Fund does not grow in size, it will be at greater risk than larger funds of wider bid -ask spreads for its shares, trading at a greater premium or discount to NAV, liquidation and/or a trading halt. Narrowly focused investments typically exhibit higher volatility. The Fund’s assets are expected to be concentrated in a sect or, industry, market, or group of concentrations to the extent that the Underlying Index has such concentrations. The securities or futures in that concentration could react similarly to market dev elopments. Thus, the Fund is subject to loss due to adverse occurrences that affect that concentration. KCAI is non -diversified. ETF shares are bought and sold on an exchange at market price (not NAV) and are not individually redeemed from the Fund. Howe ver, shares may be redeemed at NAV directly by certain authorized broker -dealers (Authorized Participants) in very large creation/redemption units. The returns shown do not represent the returns you would receive if you traded shares at other times. Shares may trade at a premium or discount to their NAV in the secondary market. Brokerage commissions will reduce returns. Beginning 12/23/202 0, market price returns are based on the official closing price of an ETF share or, if the official closing price isn't available, the midpoint between the national best bid and national best offer ( "NBBO") as of the time the ETF calculates the current NAV per share. Prior to that date, market price returns were based on the midpoint between the Bid and Ask price. NAVs are calculated using prices as of 4 :00 PM Eastern Time. The KraneShares ETFs and KFA Funds ETFs are distributed by SEI Investments Distribution Company (SIDCO), 1 Freedom Valley Dri ve, Oaks, PA 19456, which is not affiliated with Krane Funds Advisors, LLC, the Investment Adviser for the Funds, or any sub -advisers for the Funds.