2024_managed_futures_outlook
by Kraneshares
info@kfafunds.com +1 (212) 933 0393OUTLOOKMANAGED FUTURE S
2 kfafunds.cominfo@kfafunds.com +1 (212) 933 0393 Back to Top ↑Table of Contents Portfolio Management in 2024 – Planning for Uncertainty with Managed Futures & KMLM3 Stocks 5 Fixed Income and Currency 5 Commodities 6 Summary 7 KMLM Provides Exposure to Managed Futures 8 Citations 11 Definitions 11 Disclosures 12
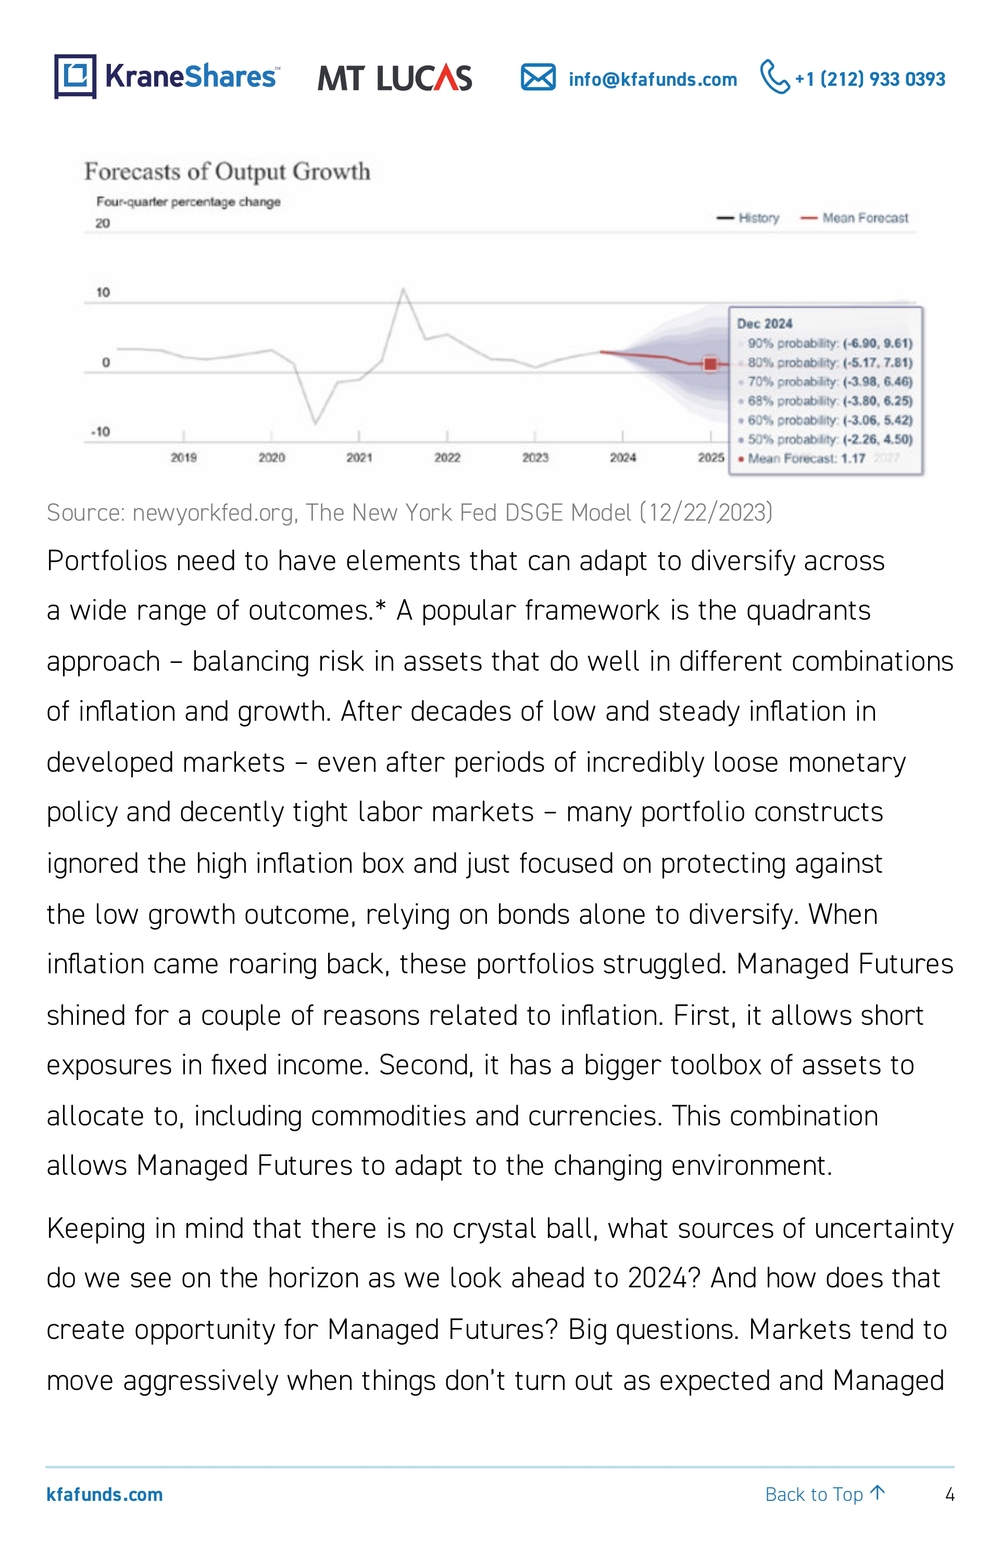
3 kfafunds.com info@kfafunds.com +1 (212) 933 0393 Back to Top ↑ Portfolio Management in 2024 – Planning for Uncertainty with Managed Futures and KMLM The turn of calendar years are interesting times to take stock of how market prices evolved compared to what was expected to transpire a year or two ago. This can serve as a great lesson in humility and an appreciation in the uncertain nature of the world. We also think it makes the case for investment strategies that can adapt and navigate uncertainty to shift allocations in broader portfolios. Remember the end of December 2021? Interest rates were at rock bottom pandemic levels (itself an exercise in who-knows-what-can- happen) while the S&P 500 was around 4800, riding high on free money forever. Fed Funds futures markets at that time expected December 2023 rates to be about 1.4%....by December 2022, those forward looking interest rate expectations had moved to 4.65%, CPI had hit 9% in the summer of 2022 and the stock market had fallen 20%. Inflation and interest rate fears were everywhere. Over the course of 2023, interest rates actually went up higher than expected – currently 5.33% – and the stock market is within a whisker of 4800 again. When it comes to markets and the economic environment, nobody knows anything for sure. The NY Fed puts out forecasts for output growth over the next few years, the most recent one is below. With 90% confidence, a four quarter percentage change in output growth in the US over the next year should be between -6.9% and +9.6%. That’s a 16% band! So, the smartest people in the room are sure of at least one thing – the world is very uncertain and there are no crystal balls.
4 kfafunds.com info@kfafunds.com +1 (212) 933 0393 Back to Top ↑ Source: newyorkfed.org, The New York Fed DSGE Model (12/22/2023) Portfolios need to have elements that can adapt to diversify across a wide range of outcomes.* A popular framework is the quadrants approach – balancing risk in assets that do well in different combinations of inflation and growth. After decades of low and steady inflation in developed markets – even after periods of incredibly loose monetary policy and decently tight labor markets – many portfolio constructs ignored the high inflation box and just focused on protecting against the low growth outcome, relying on bonds alone to diversify. When inflation came roaring back, these portfolios struggled. Managed Futures shined for a couple of reasons related to inflation. First, it allows short exposures in fixed income. Second, it has a bigger toolbox of assets to allocate to, including commodities and currencies. This combination allows Managed Futures to adapt to the changing environment. Keeping in mind that there is no crystal ball, what sources of uncertainty do we see on the horizon as we look ahead to 2024? And how does that create opportunity for Managed Futures? Big questions. Markets tend to move aggressively when things don’t turn out as expected and Managed
5 kfafunds.com info@kfafunds.com +1 (212) 933 0393 Back to Top ↑ Futures can be framed as exposure to this uncertainty. Let’s start with the big markets. Stocks The stock market is close to record highs and trading at fairly expensive multiples – assuming 2023 S&P 500 earnings per share (EPS) comes in at the $215 currently expected, we are at a 22 price to earnings (P/E) ratio. Using 2024 expectations of $240, you get a forward PE a little under 20. Over the last few months, the valuation multiple has expanded. This has been driven in part by the expectation of interest rate cuts over the next couple of years being sooner and greater than previously expected, inflation normalization, and the Fed’s reactions being reassessed. We will see how that plays out, but stocks are not cheap right now and priced for a smooth, soft landing. It sure seems like a good time for the diversification Managed Futures can provide.* Fixed Income and Currency Rates look to have peaked and markets assume inflation is solved but markets have sure been wrong before on the pace of inflation reduction as well as the Fed reaction function. These are complex, reflexive systems. If they are right, Managed Futures should move to long positions in fixed income. If inflation is stubborn, however, and doesn’t continue to come down as quickly or the Fed is spooked by the rapid loosening of condition, yields could go back up. With the inverse nature of price and yields, prices should come down. The US dollar implications of *Diversification does not ensure a profit or guarantee against a loss.
6 kfafunds.com info@kfafunds.com +1 (212) 933 0393 Back to Top ↑ a shifting monetary policy landscape are also large, as the past few years have seen a strong dollar against major currencies driven in part by rate differentials. Witness the large move down in the Japanese Yen over the past few years. US rates went up 500bps, at 75bps a clip for a time, while the Japanese maintained the Policy Balance Rate at -10bps. Should the Japanese decide to end the period of extraordinarily low rates while the US is cutting rates by 150bps, we could see large shifts in the yen. Foreign exchange market moves are often driven by diverging monetary and fiscal policy stances – the last mile in of inflation may well be bumpy and experienced differently in different countries. We also have elections in the US and the UK that could usher in very different policy. Chinese stimulus measures and the subsequent impact on the ‘commodity’ currencies of Australia and Canada could also drive currency volatility and uncertainty. Managed Futures offers exposure to these different countries and currencies. Commodities We see similar potential for moves in commodity markets, where there are growing imbalances. Copper is a great example. The world may be sliding into a Copper deficit over the coming years, impacted on the demand side by the continuing shift to a renewable energy infrastructure and electric vehicles as well as on the supply side through political disputes in producing countries. That this worsening deficit picture is happening amidst the downturn in Chinese property values makes us wonder what happens if stimulus measures are enacted there. Oil markets are also likely to be in focus as the forces of incredible US
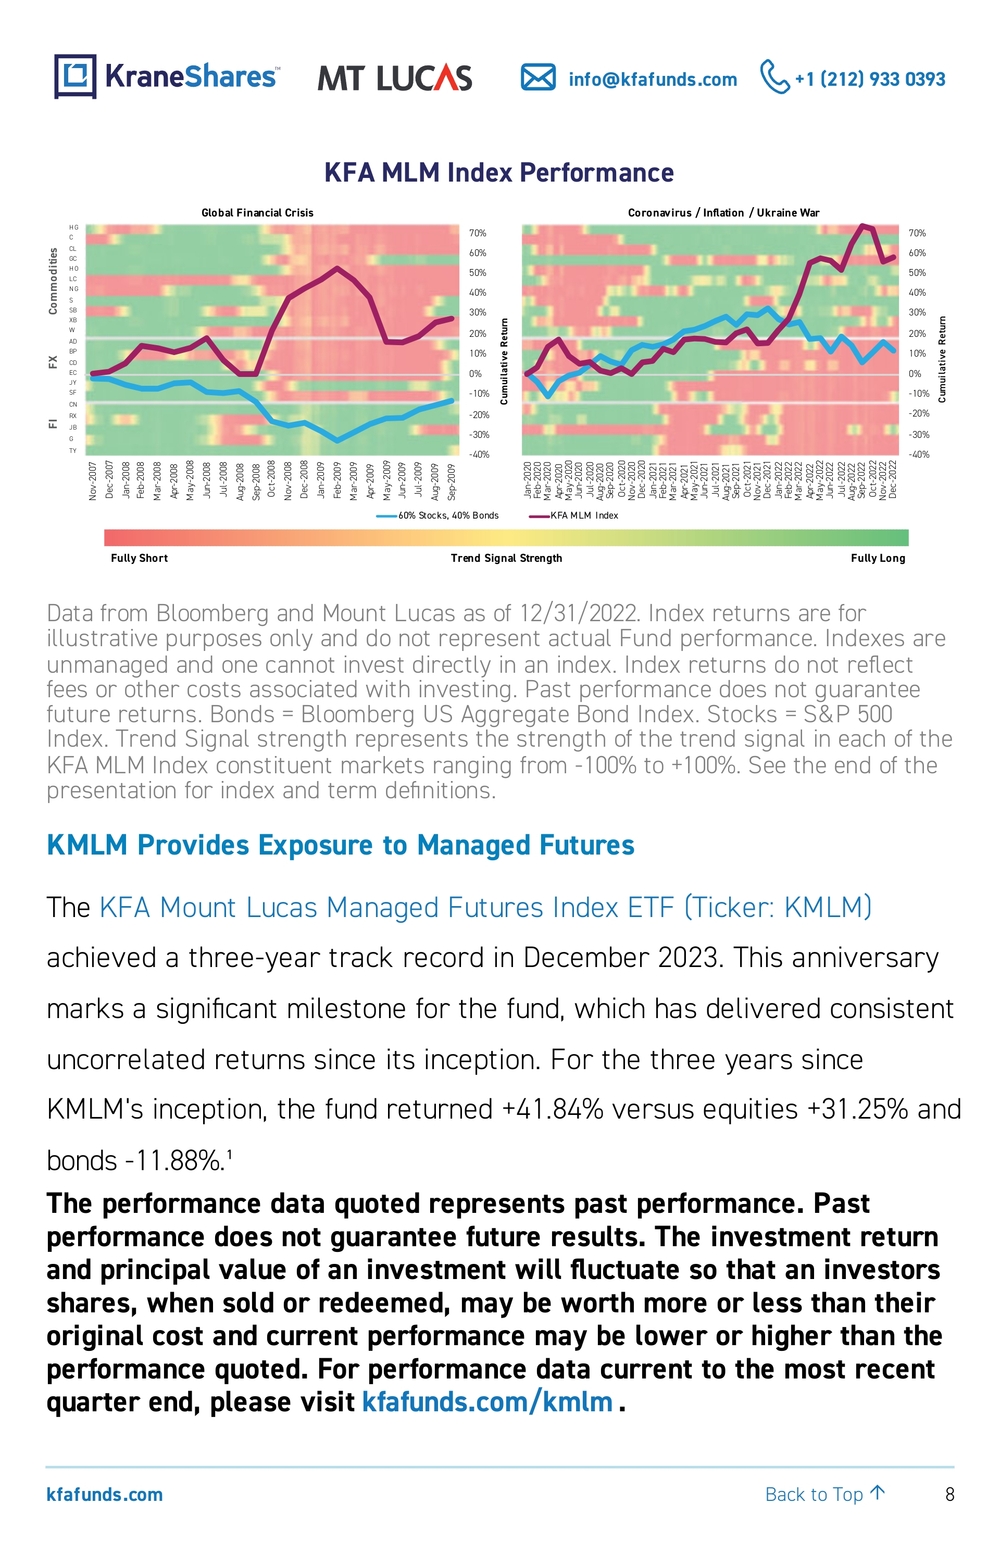
7 kfafunds.com info@kfafunds.com +1 (212) 933 0393 Back to Top ↑ supply growth creates tensions with the Organization of the Petroleum Exporting Countries (OPEC) production cuts and continuing Russia sanctions/heightened tensions in the Middle East. It only takes a couple of million barrels a day either way on supply and demand to move markets a big way. Grain markets also may be coming off a period of low supply and see the high prices of the past couple of years dissipating. Managed Futures offers exposure to these uncertain commodity markets. Summary In our view, portfolios benefit from being adaptable and need to make the most of the tools that are available to best navigate uncertainty. Direct commodity exposures. Long exposures AND short exposures. Managed Futures gives that flexibility. The charts below show two different periods of maximum uncertainty – the Global Financial Crisis (GFC) years and the Coronavirus / Inflation / Ukraine War years. This uncertainty was not good for traditional assets. Managed Futures were able to navigate the uncertainty and diversify.* The color coding details the strategy exposures through the periods – the most interesting thing to us is that it shows the adaptability. In the GFC, the right thing to do was long bonds and short commodities. In the inflation years, the right thing was short bonds and long commodities. Managed Futures offer maximum flexibility to adapt to a wide range of outcomes. *Diversification does not ensure a profit or guarantee against a loss.
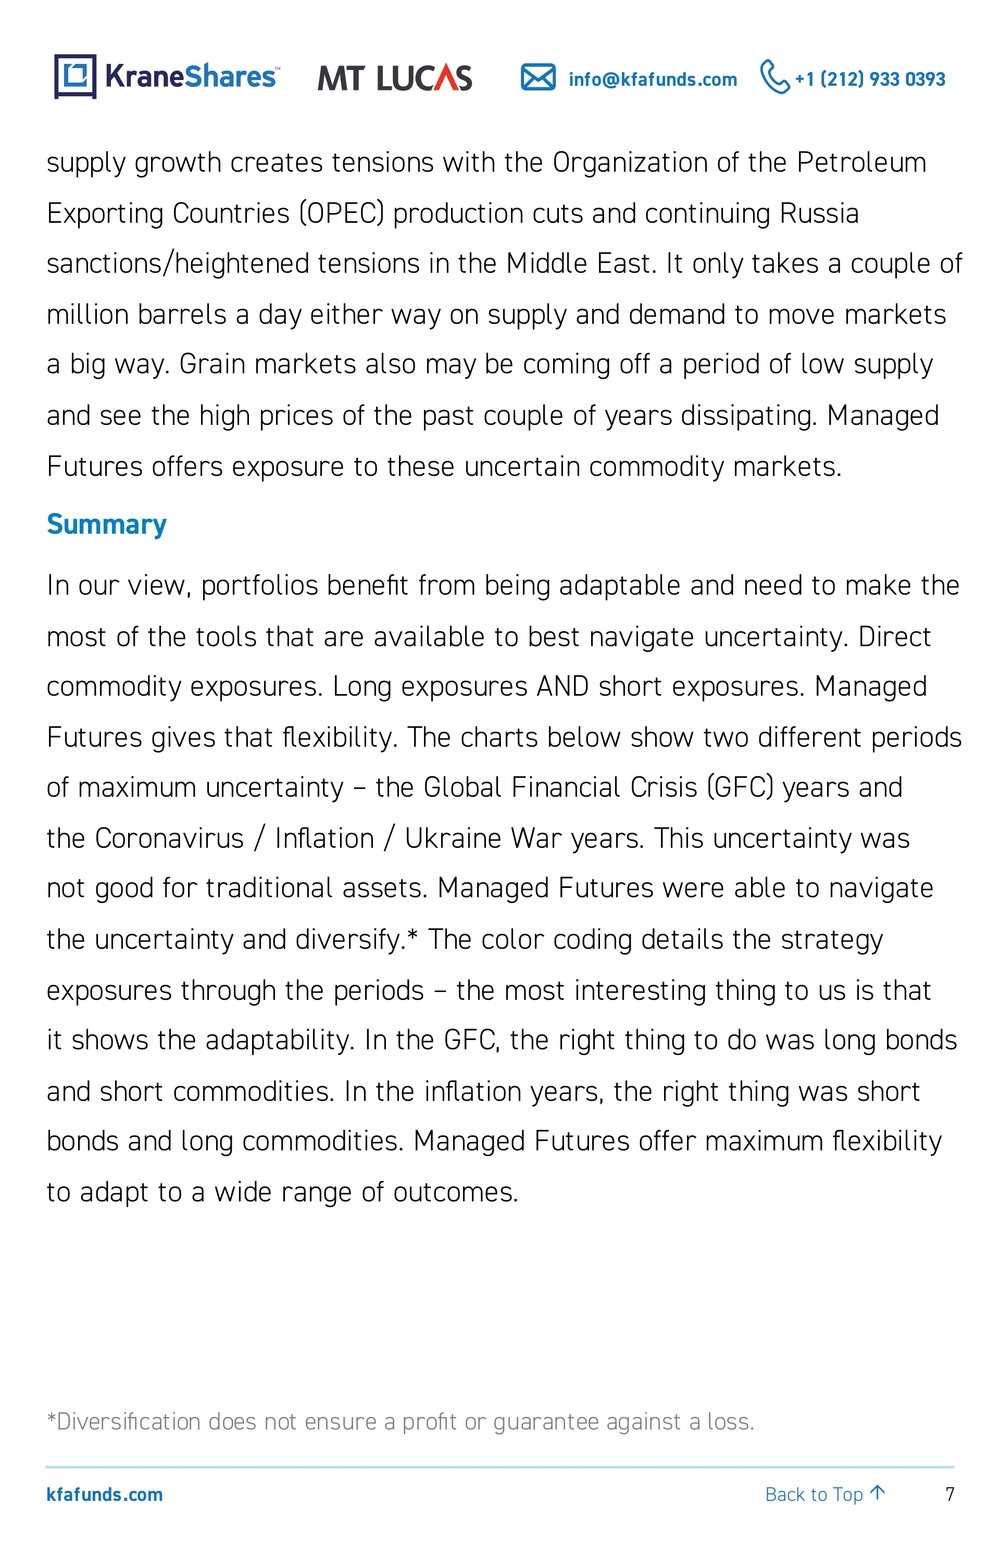
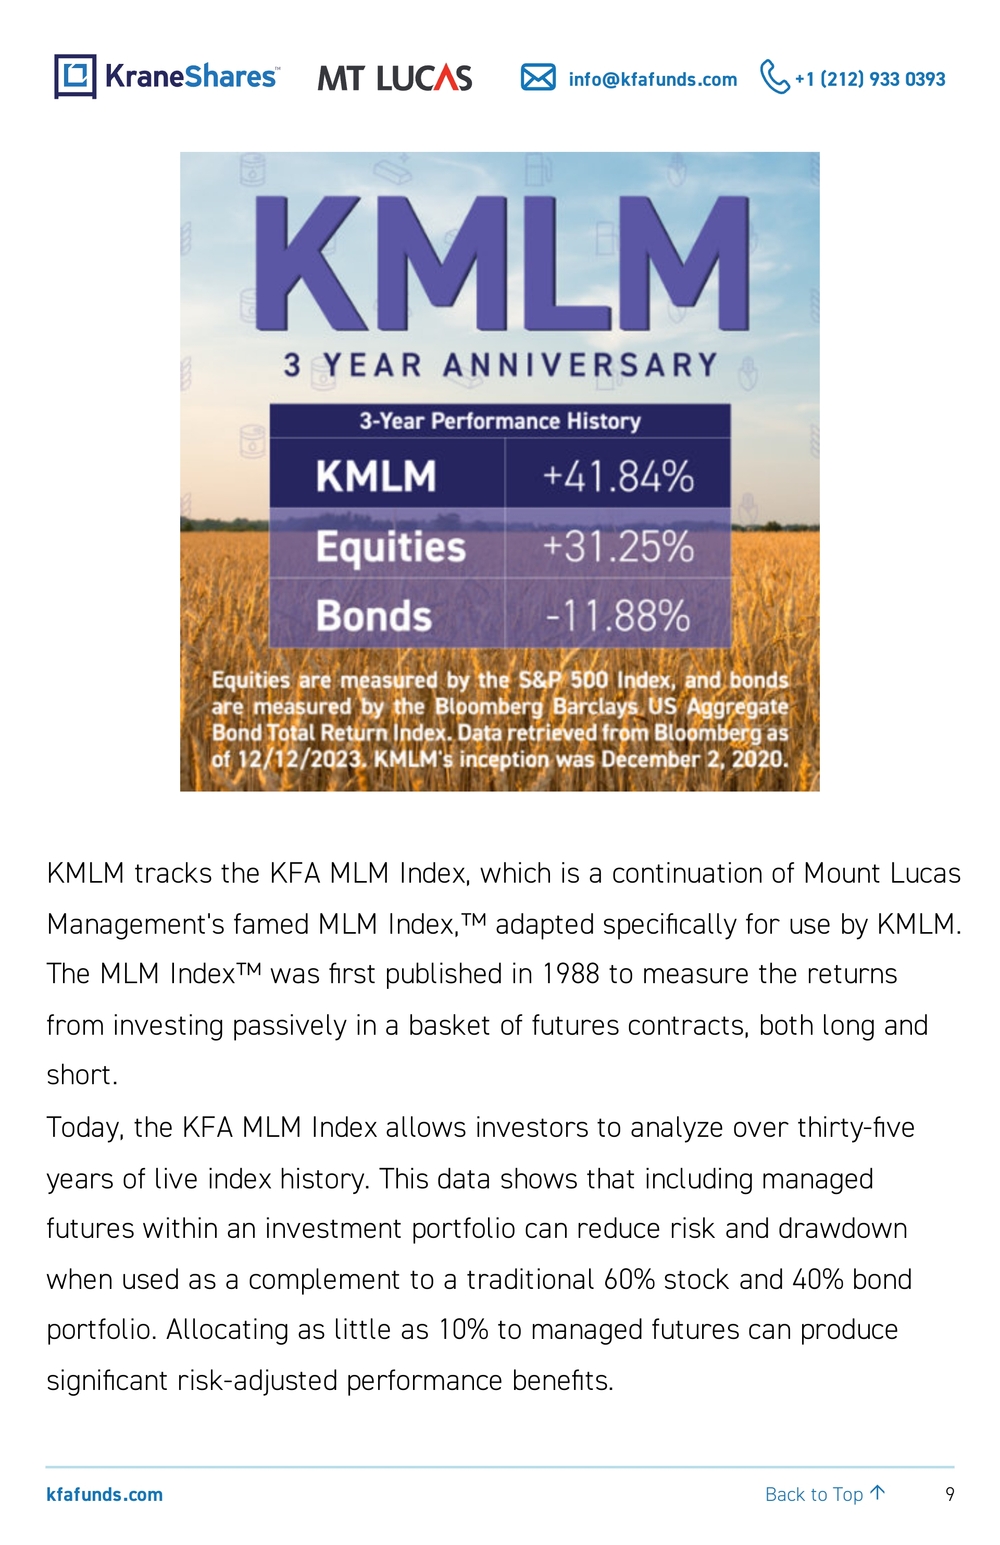
8 kfafunds.com info@kfafunds.com +1 (212) 933 0393 Back to Top ↑ KFA MLMIndex Performanc e HG C CL GC HO LC NG S SB XB W AD BP CD EC JY SF CN RX JB G TYCommodities FX FIGlobal Financial Crisis Coronaviru s/Inflation / Ukraine War Fully Shor t Fully Long -40%-30%-20%-10%0%10%20%30%40%50%60%70%Nov-2007 Dec-2007 Jan-2008 Feb-2008 Mar-2008 Apr-2008 May-2008 Jun-2008 Jul-2008 Aug-2008 Sep-2008 Oct-2008 Nov-2008 Dec-2008 Jan-2009 Feb-2009 Mar-2009 Apr-2009 May-2009 Jun-2009 Jul-2009 Aug-2009 Sep-2009 Cumu ilativeReturn -40%-30%-20%-10%0%10%20%30%40%50%60%70%Jan-2020 Feb-2020 Mar-2020 Apr-2020 May-2020 Jun-2020 Jul-2020 Aug-2020 Sep-2020 Oct-2020 Nov-2020 Dec-2020 Jan-2021 Feb-2021 Mar-2021 Apr-2021 May-2021 Jun-2021 Jul-2021 Aug-2021 Sep-2021 Oct-2021 Nov-2021 Dec-2021 Jan-2022 Feb-2022 Mar-2022 Apr-2022 May-2022 Jun-2022 Jul-2022 Aug-2022 Sep-2022 Oct-2022 Nov-2022 Dec-2022 Cumu ilativeReturn Trend Signal Strength60% Stocks, 40% Bonds KFA MLM Index Data from Bloomberg and Mount Lucas as of 12/31/2022. Index returns are for illustrative purposes only and do not represent actual Fund performance. Indexes are unmanaged and one cannot invest directly in an index. Index returns do not reflect fees or other costs associated with investing. Past performance does not guarantee future returns. Bonds = Bloomberg US Aggregate Bond Index. Stocks = S&P 500 Index. Trend Signal strength represents the strength of the trend signal in each of the KFA MLM Index constituent markets ranging from -100% to +100%. See the end of the presentation for index and term definitions. KMLM Provides Exposure to Managed Futures The KFA Mount Lucas Managed Futures Index ETF (Ticker: KMLM) achieved a three-year track record in December 2023. This anniversary marks a significant milestone for the fund, which has delivered consistent uncorrelated returns since its inception. For the three years since KMLM's inception, the fund returned +41.84% versus equities +31.25% and bonds -11.88%.¹ The performance data quoted represents past performance. Past performance does not guarantee future results. The investment return and principal value of an investment will fluctuate so that an investors shares, when sold or redeemed, may be worth more or less than their original cost and current performance may be lower or higher than the performance quoted. For performance data current to the most recent quarter end, please visit kfafunds.com/kmlm .
9 kfafunds.com info@kfafunds.com +1 (212) 933 0393 Back to Top ↑
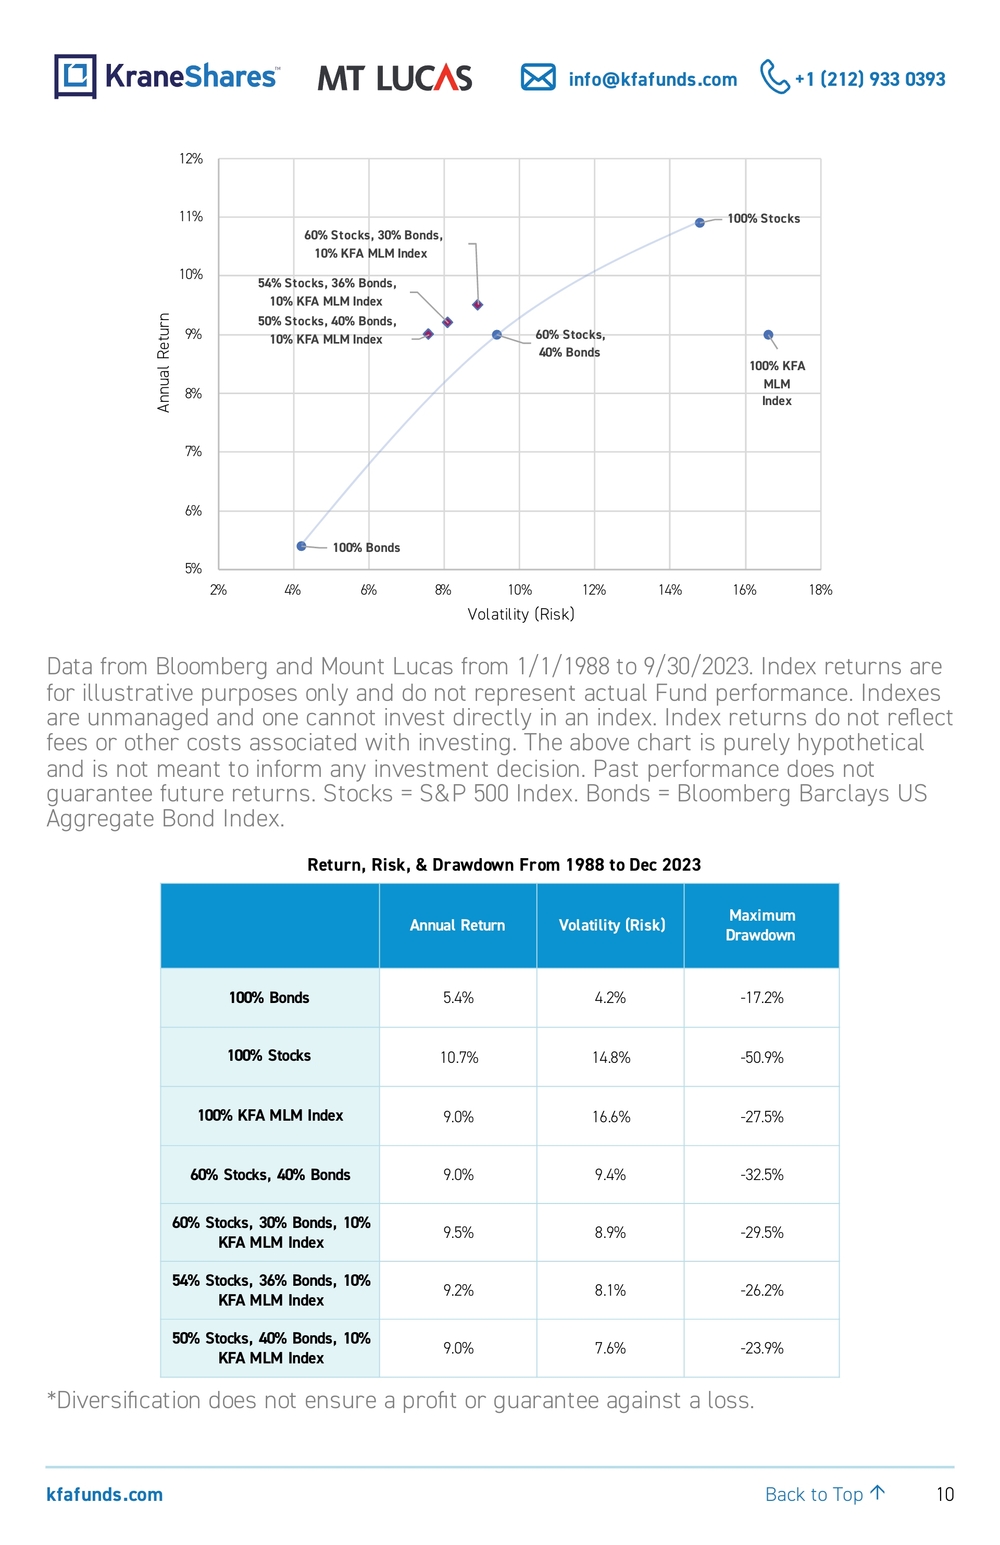
KMLM tracks the KFA MLM Index, which is a continuation of Mount Lucas Management's famed MLM Index,™ adapted specifically for use by KMLM. The MLM Index™ was first published in 1988 to measure the returns from investing passively in a basket of futures contracts, both long and short. Today, the KFA MLM Index allows investors to analyze over thirty-five years of live index history. This data shows that including managed futures within an investment portfolio can reduce risk and drawdown when used as a complement to a traditional 60% stock and 40% bond portfolio. Allocating as little as 10% to managed futures can produce significant risk-adjusted performance benefits.
10 kfafunds.com info@kfafunds.com +1 (212) 933 0393 Back to Top ↑ 100% Bonds100% Stocks 100% KFA MLM Index60% Stocks, 40% Bonds60% Stocks, 30% Bonds, 10% KFA MLM Index 50% Stocks, 40% Bonds, 10% KFA MLM Index54% Stocks, 36% Bonds, 10% KFA MLM Index 5%6%7%8%9%10%11%12% 2% 4% 6% 8% 10%1 2% 14%1 6% 18%Annual Return Volatility (Risk) Data from Bloomberg and Mount Lucas from 1/1/1988 to 9/30/2023. Index returns are for illustrative purposes only and do not represent actual Fund performance. Indexes are unmanaged and one cannot invest directly in an index. Index returns do not reflect fees or other costs associated with investing. The above chart is purely hypothetical and is not meant to inform any investment decision. Past performance does not guarantee future returns. Stocks = S&P 500 Index. Bonds = Bloomberg Barclays US Aggregate Bond Index. Maximum Draw downVolatility (Risk) Annual Return -17.2% 4.2% 5.4% 100% Bond s -50.9% 14.8% 10.7% 100% Stocks -27.5% 16.6% 9.0% 100% KFAMLM Index -32.5% 9.4% 9.0% 60% Stocks, 40% Bond s -29.5% 8.9% 9.5%60% Stocks, 30% Bonds, 10% KFAMLM Index -26.2% 8.1% 9.2%54% Stocks, 36% Bonds, 10% KFAMLM Index -23.9% 7.6% 9.0%50% Stocks, 40% Bonds, 10% KFAMLM IndexReturn ,Risk, & Drawdown From 1988 to Dec 2023 *Diversification does not ensure a profit or guarantee against a loss.
11 kfafunds.com info@kfafunds.com +1 (212) 933 0393 Back to Top ↑ Citations:
- Equities are measured by the S&P 500 Index, and bonds are measured by the Bloomberg US Aggregate Bond Total Return Index. Data retrieved from Bloomberg as of 12/12/2023. KMLM's inception was December 2, 2020. Definitions: Earnings Per Share (EPS): A widely used metric for estimating corporate value. It is calculated by dividing a company’s net profit by the number of common shares it has outstanding. In the context of the S&P 500, the EPS is the total earnings of the 500 companies, divided by the same divisor used to calculate the index. The EPS calculation includes earnings of all the companies in the index. Price to Earnings (P/E) Ratio: The share price of a company divided by a company’s earnings per share. The P/E ratio is the most used measure of valuing a company. A lower P/E ratio means a company is cheaper based on its current earnings. Forward price-to-earnings (forward P/E) is a version of the ratio of price-to-earnings (P/E) that uses forecasted earnings for the P/E calculation. While the earnings used in this formula are just an estimate and not as reliable as current or historical earnings data, there is still benefit in estimated P/E analysis. S&P 500 Index: The S&P 500 Index is widely regarded as the best single gauge of large-cap U.S. equities. There is over USD 9.9 trillion indexed or benchmarked to the index, with indexed assets comprising approximately USD 3.4 trillion of this total. The index includes 500 leading companies and covers approximately 80% of available market capitalization. The
12 kfafunds.com info@kfafunds.com +1 (212) 933 0393 Back to Top ↑ index was launched on March 4, 1957. KFA MLM Index (“KMLM’s Index”): The KFA MLM Index is a diversified trend-following portfolio of commodity, currency, and global fixed-income futures contracts traded on US and foreign exchanges. The performance data for the index is a representation of the MLM Index™ from 1/1/1988 to 12/31/2004, the MLM Index EV (“EV”), with enhanced Execution and Volatility characteristics, from 1/1/2005 to 11/30/2020, and, using the same methodology as the “EV,” the KFA MLM Index from 12/1/2020 on. Bloomberg US Aggregate Bond Total Return Index (“US Aggregate Bond Index”: Bloomberg US Aggregate Bond Index: The Bloomberg US Aggregate Bond Index is a broad-based flagship benchmark that measures the investment grade, US dollar-denominated, fixed-rate, taxable bond market in the United States. The index includes Treasuries, government-related, and corporate securities. The index was launched on January 1, 1976. Important Notes: Carefully consider the Funds’ investment objectives, risk factors, charges and expenses before investing. This and additional information can be found in the Funds’ full and summary prospectus, which may be obtained by visiting: www.kfafunds.com/kmlm . Read the prospectus carefully before investing. Risk Disclosures: Investing involves risk, including possible loss of principal. There can be no assurance that a Fund will achieve its stated objectives. Indices are unmanaged and do not include the effect of fees. One cannot invest directly in an index. This information should not be relied upon as research, investment advice,
13 kfafunds.com info@kfafunds.com +1 (212) 933 0393 Back to Top ↑ or a recommendation regarding any products, strategies, or any security in particular. This material is strictly for illustrative, educational, or informational purposes and is subject to change. Certain content represents an assessment of the market environment at a specific time and is not intended to be a forecast of future events or a guarantee of future results; material is as of the dates noted and is subject to change without notice. KMLM may invest in derivatives, which are often more volatile than other investments and may magnify KMLM’s gains or losses. A derivative (i.e., futures/forward contracts, swaps, and options) is a contract that derives its value from the performance of an underlying asset. The primary risk of derivatives is that changes in the asset’s market value and the derivative may not be proportionate, and some derivatives can have the potential for unlimited losses. Derivatives are also subject to liquidity and counterparty risk. KMLM is subject to liquidity risk, meaning that certain investments may become difficult to purchase or sell at a reasonable time and price. If a transaction for these securities is large, it may not be possible to initiate, which may cause KMLM to suffer losses. Counterparty risk is the risk of loss in the event that the counterparty to an agreement fails to make required payments or otherwise comply with the terms of the derivative. Fluctuations in currency of foreign countries may have an adverse effect to domestic currency values. The use of futures contracts is subject to special risk considerations. The primary risks associated with the use of futures contracts include: (a) an imperfect correlation between the change in market value of the reference asset and the price of the futures contract; (b) possible lack of a liquid secondary market for a futures contract and the resulting inability to close a futures contract when desired; (c) losses caused by unanticipated market movements, which are potentially unlimited; (d) the inability to predict correctly the direction of market prices, interest rates, currency exchange rates and other economic factors; and (e) if KMLM has insufficient cash, it may
14 kfafunds.com info@kfafunds.com +1 (212) 933 0393 Back to Top ↑ have to sell securities or financial instruments from its portfolio to meet daily variation margin requirements, which may lead to KMLM selling securities or financial instruments at a loss. KMLM invests through a subsidiary, and is indirectly exposed to the risks associated with the Subsidiary’s investments. Since the Subsidiary is organized under the law of the Cayman Islands and is not registered with the SEC under the Investment Company Act of 1940, as such KMLM will not receive all of the protections offered to shareholders of registered investment companies. KMLM and the Subsidiary will be considered commodity pools upon commencement of operations, and each will be subject to regulation under the Commodity Exchange Act and CFTC rules. Commodity pools are subject to additional laws, regulations and enforcement policies, which may increase compliance costs and may affect the operations and performance of KMLM and the Subsidiary. Futures and other contracts may have to be liquidated at disadvantageous times or prices to prevent KMLM from exceeding any applicable position limits established by the CFTC. The value of a commodity-linked derivative investment typically is based upon the price movements of a physical commodity and may be affected by changes in overall market movements, volatility of the Index, changes in interest rates, or factors affecting a particular industry or commodity. KMLM is subject to interest rate risk, which is the chance that bonds will decline in value as interest rates rise. KMLM is subject to liquidity risk, meaning that certain investments may become difficult to purchase or sell at a reasonable time and price. If a transaction for these securities is large, it may not be possible to initiate which may cause KMLM to suffer losses. Narrowly focused investments typically exhibit higher volatility. KMLM’s assets are expected to be concentrated in a sector, industry, market, or group of concentrations to the extent that the Underlying Index has such concentrations. The securities or futures in that concentration could react similarly to market
15 kfafunds.com info@kfafunds.com +1 (212) 933 0393 Back to Top ↑ developments. Thus, KMLM is subject to loss due to adverse occurrences that affect that concentration. KMLM is non-diversified. ETF shares are bought and sold on an exchange at market price (not NAV) and are not individually redeemed from the Fund. However, shares may be redeemed at NAV directly by certain authorized broker-dealers (Authorized Participants) in very large creation/redemption units. The returns shown do not represent the returns you would receive if you traded shares at other times. Shares may trade at a premium or discount to their NAV in the secondary market. Brokerage commissions will reduce returns. Beginning 12/23/2020, market price returns are based on the official closing price of an ETF share or, if the official closing price isn't available, the midpoint between the national best bid and national best offer ("NBBO") as of the time the ETF calculates the current NAV per share. Prior to that date, market price returns were based on the midpoint between the Bid and Ask price. NAVs are calculated using prices as of 4:00 PM Eastern Time. The KraneShares ETFs and KFA Funds ETFs are distributed by SEI Investments Distribution Company (SIDCO), 1 Freedom Valley Drive, Oaks, PA 19456, which is not affiliated with Krane Funds Advisors, LLC, the Investment Adviser for the Funds, or any sub-advisers for the Funds.
ABOUT KRANESHARES Krane Funds Advisors, LLC is the investment manager for KraneShares ETFs. KraneShares offers innovative investment solutions tailored to three key pillars: China, Climate, and Uncorrelated Assets. Our team is determined to provide industry-leading, differentiated, and high-conviction investment strategies that offer access to key market trends. Our mission is to empower investors with the knowledge and tools necessary to capture the importance of these themes as an essential element of a well-designed investment portfolio. ABOUT MOUNT LUCAS Since 1986, Mount Lucas Management LP has provided innovative alternative investment strategies to institutional and high-net-worth investors that enhance and diversify traditional investments. Mount Lucas’ investment professionals have extensive experience in the development and use of systematic investment strategies that access alternative risk premia as well as a long history of discretionary macro trading and risk taking.info@kfafunds.com +1 (212) 933 0393KFAFunds.comSign Up For Our Research