IVOL Presentation
by Kraneshares
IVOL: The Quadratic Interest Rate Volatility and Inflation Hedge ETF 1Q3 2026
2Quadratic Capital Management
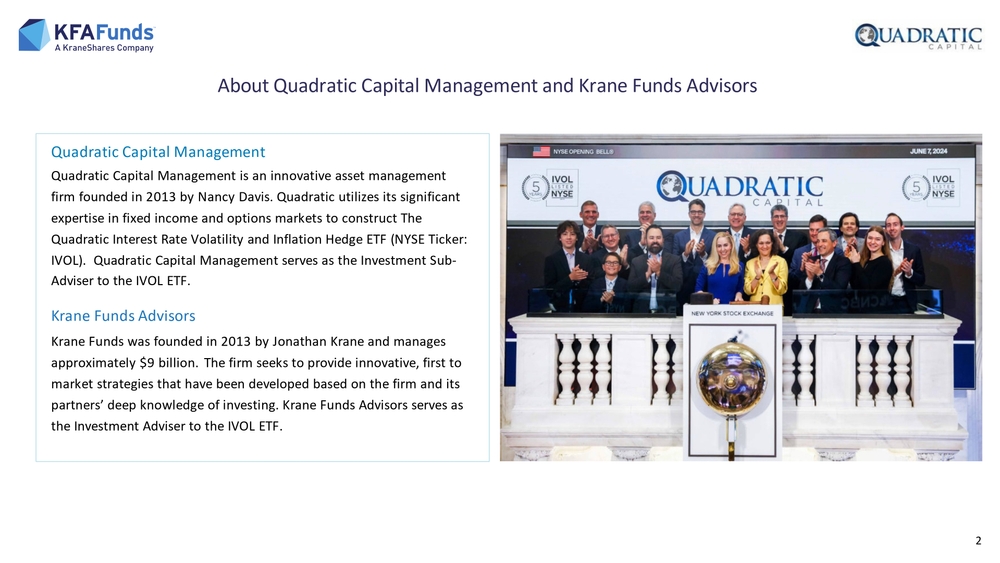
Quadratic Capital Management is an innovative asset management
firm founded in 2013 by Nancy Davis. Quadratic utilizes its significant
expertise in fixed income and options markets to construct The
Quadratic Interest Rate Volatility and Inflation Hedge ETF (NYSE Ticker:
IVOL). Quadratic Capital Management serves as the Investment Sub -
Adviser to the IVOL ETF.
Krane Funds Advisors
Krane Funds was founded in 2013 by Jonathan Krane and manages
approximately $9 billion. The firm seeks to provide innovative, first to
market strategies that have been developed based on the firm and its
partners’ deep knowledge of investing. Krane Funds Advisors serves as
the Investment Adviser to the IVOL ETF.
About Quadratic Capital Management and Krane Funds Advisors
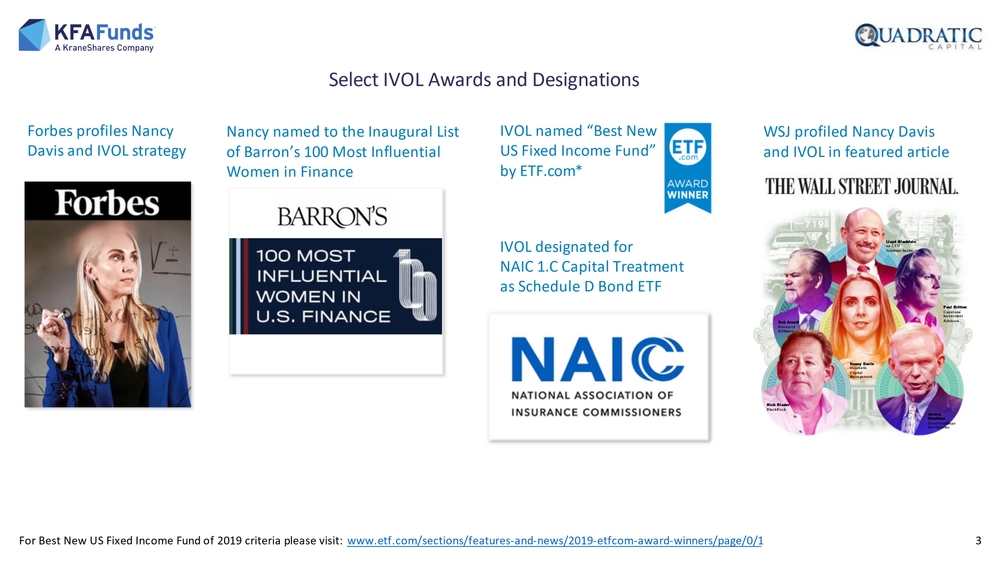
Nancy named to the Inaugural List of Barron’s 100 Most Influential Women in FinanceWSJ profiled Nancy Davis and IVOL in featured articleIVOL named “Best New US Fixed Income Fund” by ETF.com * Forbes profiles Nancy Davis and IVOL strategy For Best New US Fixed Income Fund of 2019 criteria please visit: www.etf.com/sections/features -and-news/2019 -etfcom -award -winners/page/0/1 3Select IVOL Awards and Designations Lloyd Blankfein ex-CEO Goldman Sachs Paul Britton Capstone Investment Advisors Nancy Davis Quadratic Capital Management Rick Rieder BlackRock Jeremy Grantham Grantham Mayo Van OtterlooRob Arnott Research Affiliates IVOL designated for NAIC 1.C Capital Treatment as Schedule D Bond ETF
Executive Summary – Why IVOL? Portfolio Diversification IVOL’s combination of inflation, volatility, and yield curve exposure is generally uncorrelated to S&P 500 and Core Fixed Inc ome Volatility Hedge Provides diversification from short volatility exposures embedded in mortgage and callable bond investments Income Stability IVOL has paid at least 30bps per month since inception. Distributions in 2022, 2023, 2024, 2025 were not taxable Potential Tax Efficiency IVOL’s distributions may compare favorably on an after -tax basis to other bond, tax -managed and income -oriented strategies Liquidity and Transparency Listed ETFs offer intraday mark -to-market and tangible liquidity Present -Day Relevance Seeks to provide consistent fixed income returns with tail risk benefits, a portfolio ballast during market volatility 4
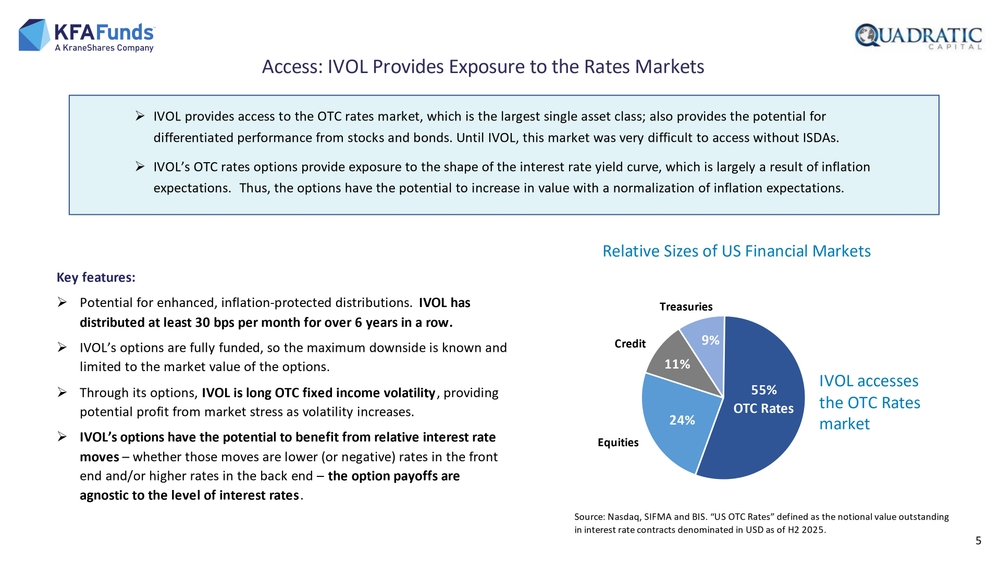
IVOL accesses the OTC Rates marketTreasuries Credit Equities 5➢IVOL provides access to the OTC rates market, which is the largest single asset class; also provides the potential for differentiated performance from stocks and bonds. Until IVOL, this market was very difficult to access without ISDAs. ➢IVOL’s OTC rates options provide exposure to the shape of the interest rate yield curve, which is largely a result of inflati on expectations. Thus, the options have the potential to increase in value with a normalization of inflation expectations. Source: Nasdaq, SIFMA and BIS. “US OTC Rates” defined as the notional value outstanding in interest rate contracts denominated in USD as of H2 2025.Key features: ➢Potential for enhanced, inflation -protected distributions. IVOL has distributed at least 30 bps per month for over 6 years in a row. ➢IVOL’s options are fully funded, so the maximum downside is known and limited to the market value of the options. ➢Through its options, IVOL is long OTC fixed income volatility , providing potential profit from market stress as volatility increases. ➢IVOL’s options have the potential to benefit from relative interest rate moves – whether those moves are lower (or negative) rates in the front end and/or higher rates in the back end – the option payoffs are agnostic to the level of interest rates .Access: IVOL Provides Exposure to the Rates Markets Relative Sizes of US Financial Markets 24%11%9% 55% OTC Rates
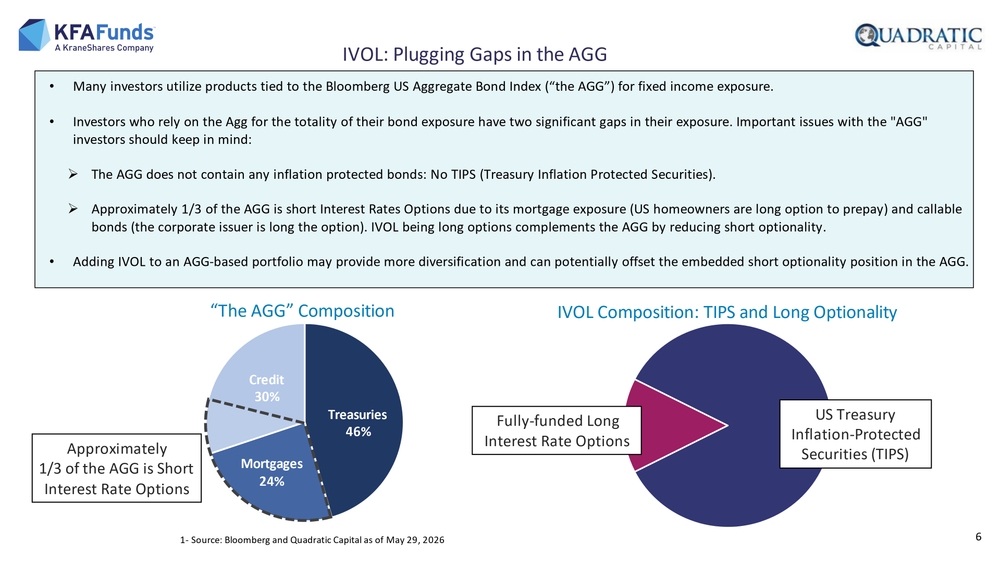
Treasuries 46% Mortgages 24%Credit 30%“The AGG” Composition IVOL Composition: TIPS and Long Optionality Fully -funded Long Interest Rate OptionsUS Treasury Inflation -Protected Securities (TIPS) 6•Many investors utilize products tied to the Bloomberg US Aggregate Bond Index (“the AGG”) for fixed income exposure. •Investors who rely on the Agg for the totality of their bond exposure have two significant gaps in their exposure. Important issues with the "AGG" investors should keep in mind: ➢The AGG does not contain any inflation protected bonds: No TIPS (Treasury Inflation Protected Securities). ➢Approximately 1/3 of the AGG is short Interest Rates Options due to its mortgage exposure (US homeowners are long option to p repay) and callable bonds (the corporate issuer is long the option). IVOL being long options complements the AGG by reducing short optionality. •Adding IVOL to an AGG -based portfolio may provide more diversification and can potentially offset the embedded short optionality position in the AGG.IVOL: Plugging Gaps in the AGG 1- Source: Bloomberg and Quadratic Capital as of May 29, 2026Approximately 1/3 of the AGG is Short Interest Rate Options
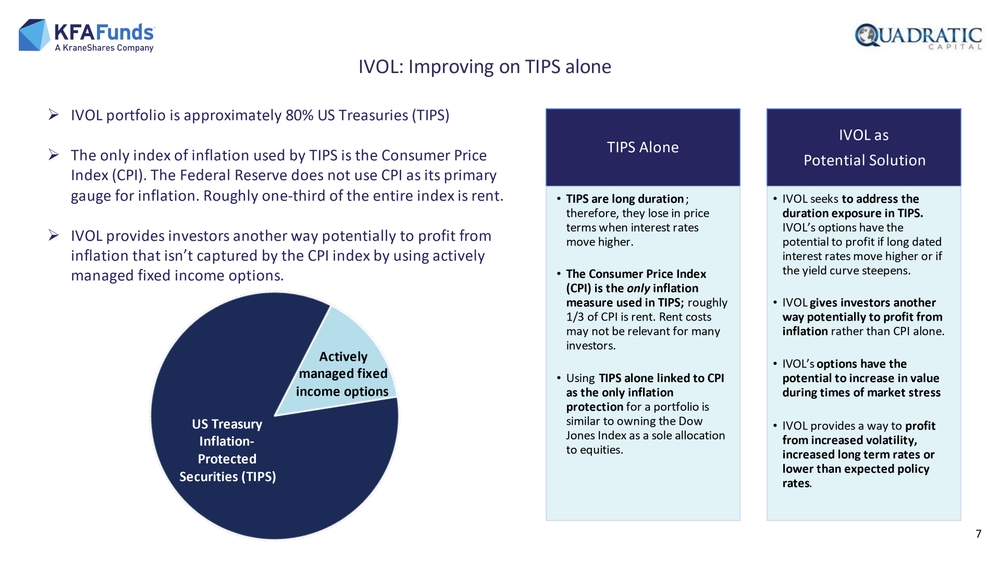
➢IVOL portfolio is approximately 80% US Treasuries (TIPS) ➢The only index of inflation used by TIPS is the Consumer Price Index (CPI). The Federal Reserve does not use CPI as its primary gauge for inflation. Roughly one -third of the entire index is rent. ➢IVOL provides investors another way potentially to profit from inflation that isn’t captured by the CPI index by using actively managed fixed income options.IVOL: Improving on TIPS alone US Treasury Inflation - Protected Securities (TIPS)Actively managed fixed income optionsTIPS Alone •TIPS are long duration ; therefore, they lose in price terms when interest rates move higher. •The Consumer Price Index (CPI) is the only inflation measure used in TIPS; roughly 1/3 of CPI is rent. Rent costs may not be relevant for many investors. •Using TIPS alone linked to CPI as the only inflation protection for a portfolio is similar to owning the Dow Jones Index as a sole allocation to equities.IVOL as Potential Solution •IVOL seeks to address the duration exposure in TIPS. IVOL’s options have the potential to profit if long dated interest rates move higher or if the yield curve steepens. •IVOL gives investors another way potentially to profit from inflation rather than CPI alone. •IVOL’s options have the potential to increase in value during times of market stress •IVOL provides a way to profit from increased volatility, increased long term rates or lower than expected policy rates . 7
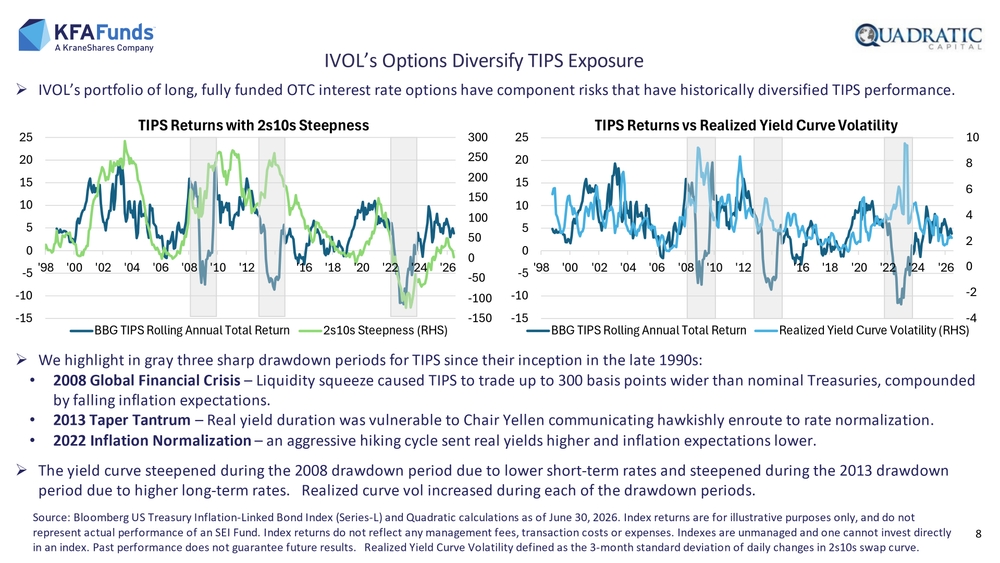
-4-20246810 -15-10-50510152025 '98 '00 '02 '04 '06 '08 '10 '12 '14 '16 '18 '20 '22 '24 '26TIPS Returns vs Realized Yield Curve Volatility BBG TIPS Rolling Annual Total Return Realized Yield Curve Volatility (RHS) -150-100-50050100150200250300 -15-10-50510152025 '98 '00 '02 '04 '06 '08 '10 '12 '14 '16 '18 '20 '22 '24 '26TIPS Returns with 2s10s Steepness BBG TIPS Rolling Annual Total Return 2s10s Steepness (RHS)➢IVOL’s portfolio of long, fully funded OTC interest rate options have component risks that have historically diversified TIPS performance. ➢We highlight in gray three sharp drawdown periods for TIPS since their inception in the late 1990s: •2008 Global Financial Crisis – Liquidity squeeze caused TIPS to trade up to 300 basis points wider than nominal Treasuries, compounded by falling inflation expectations. •2013 Taper Tantrum – Real yield duration was vulnerable to Chair Yellen communicating hawkishly enroute to rate normalization. •2022 Inflation Normalization – an aggressive hiking cycle sent real yields higher and inflation expectations lower. ➢The yield curve steepened during the 2008 drawdown period due to lower short -term rates and steepened during the 2013 drawdown period due to higher long -term rates. Realized curve vol increased during each of the drawdown periods. IVOL’s Options Diversify TIPS Exposure 8Source: Bloomberg US Treasury Inflation -Linked Bond Index (Series -L) and Quadratic calculations as of June 30, 2026. Index retur ns are for illustrative purposes only, and do not represent actual performance of an SEI Fund. Index returns do not reflect any management fees, transaction costs or expenses. Indexes are unmanaged and one cannot invest directly in an index. Past performance does not guarantee future results. Realized Yield Curve Volatility defined as the 3 -month standar d deviation of daily changes in 2s10s swap curve.
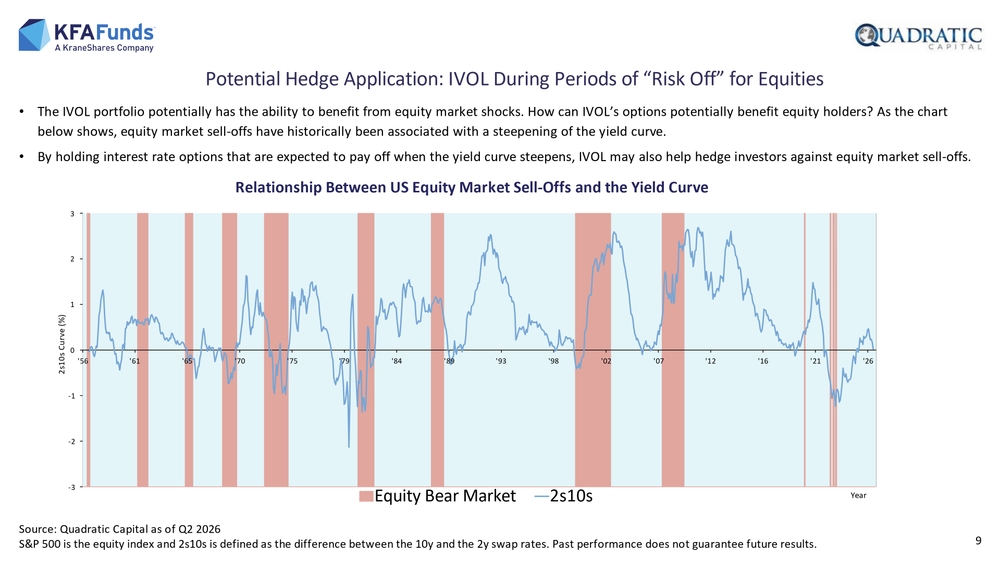
9•The IVOL portfolio potentially has the ability to benefit from equity market shocks. How can IVOL’s options potentially benef it equity holders? As the chart below shows, equity market sell -offs have historically been associated with a steepening of the yield curve. •By holding interest rate options that are expected to pay off when the yield curve steepens, IVOL may also help hedge investo rs against equity market sell -offs. Relationship Between US Equity Market Sell -Offs and the Yield CurvePotential Hedge Application: IVOL During Periods of “Risk Off” for Equities Source: Quadratic Capital as of Q2 2026 S&P 500 is the equity index and 2s10s is defined as the difference between the 10y and the 2y swap rates. Past performance do es not guarantee future results. -3-2-10123 '56 '61 '65 '70 '75 '79 '84 '89 '93 '98 '02 '07 '12 '16 '21 '26 Equity Bear Market 2s10s2s10s Curve (%) Year
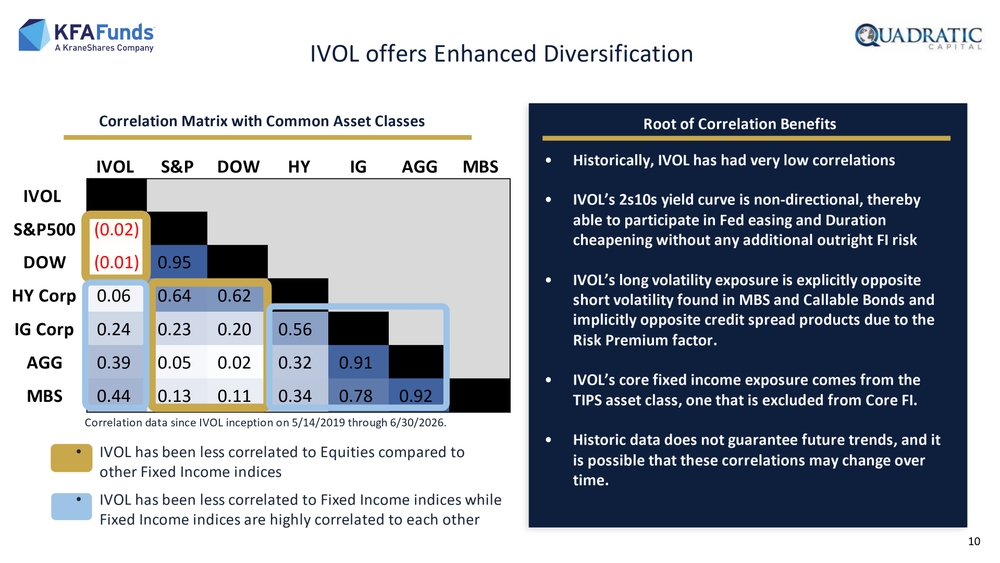
IVOL S&P DOW HY IG AGG MBS IVOL 1.00 S&P500 (0.02) 1.00 DOW (0.01) 0.95 1.00 HY Corp 0.06 0.64 0.62 1.00 IG Corp 0.24 0.23 0.20 0.56 1.00 AGG 0.39 0.05 0.02 0.32 0.91 1.00 MBS 0.44 0.13 0.11 0.34 0.78 0.92 1.00IVOL offers Enhanced Diversification Correlation Matrix with Common Asset Classes Root of Correlation Benefits •Historically, IVOL has had very low correlations •IVOL’s 2s10s yield curve is non -directional, thereby able to participate in Fed easing and Duration cheapening without any additional outright FI risk •IVOL’s long volatility exposure is explicitly opposite short volatility found in MBS and Callable Bonds and implicitly opposite credit spread products due to the Risk Premium factor. •IVOL’s core fixed income exposure comes from the TIPS asset class, one that is excluded from Core FI. •Historic data does not guarantee future trends, and it is possible that these correlations may change over time. •IVOL has been less correlated to Equities compared to other Fixed Income indices •IVOL has been less correlated to Fixed Income indices while Fixed Income indices are highly correlated to each other 10Correlation data since IVOL inception on 5/14/2019 through 6/30/2026.
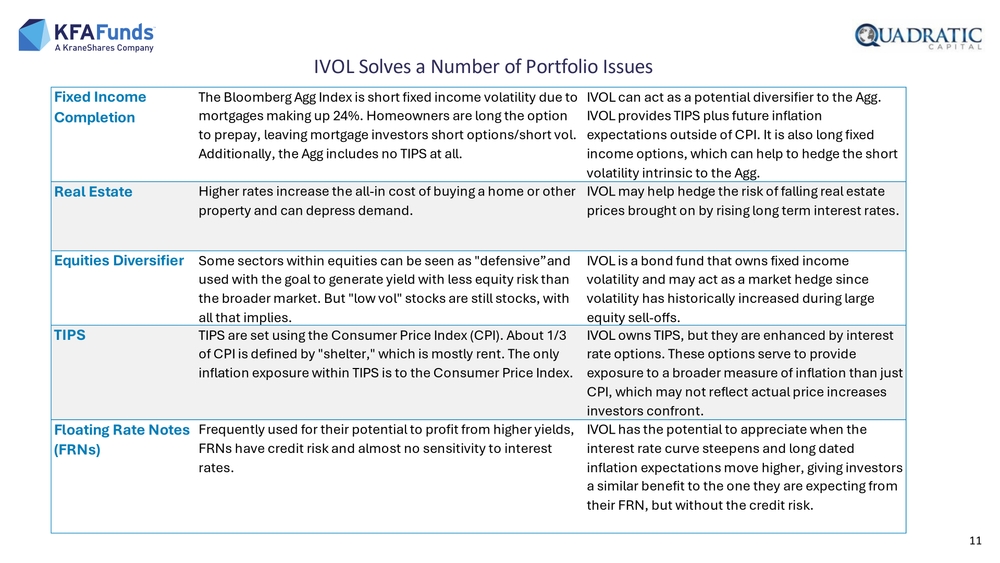
11IVOL Solves a Number of Portfolio Issues Fixed Income CompletionThe Bloomberg Agg Index is short fixed income volatility due to mortgages making up 24%. Homeowners are long the option to prepay, leaving mortgage investors short options/short vol. Additionally, the Agg includes no TIPS at all.IVOL can act as a potential diversifier to the Agg. IVOL provides TIPS plus future inflation expectations outside of CPI. It is also long fixed income options, which can help to hedge the short volatility intrinsic to the Agg. Real Estate Higher rates increase the all-in cost of buying a home or other property and can depress demand.IVOL may help hedge the risk of falling real estate prices brought on by rising long term interest rates. Equities Diversifier Some sectors within equities can be seen as "defensive”and used with the goal to generate yield with less equity risk than the broader market. But "low vol" stocks are still stocks, with all that implies.IVOL is a bond fund that owns fixed income volatility and may act as a market hedge since volatility has historically increased during large equity sell-offs. TIPS TIPS are set using the Consumer Price Index (CPI). About 1/3 of CPI is defined by "shelter," which is mostly rent. The only inflation exposure within TIPS is to the Consumer Price Index.IVOL owns TIPS, but they are enhanced by interest rate options. These options serve to provide exposure to a broader measure of inflation than just CPI, which may not reflect actual price increases investors confront. Floating Rate Notes (FRNs)Frequently used for their potential to profit from higher yields, FRNs have credit risk and almost no sensitivity to interest rates.IVOL has the potential to appreciate when the interest rate curve steepens and long dated inflation expectations move higher, giving investors a similar benefit to the one they are expecting from their FRN, but without the credit risk.
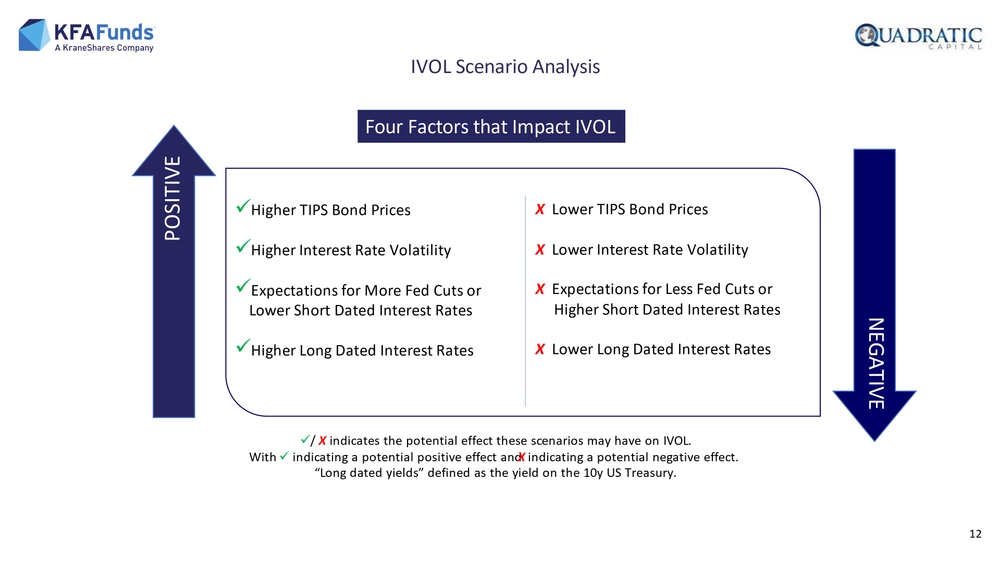
✓/ X indicates the potential effect these scenarios may have on IVOL. With ✓ indicating a potential positive effect and X indicating a potential negative effect. “Long dated yields” defined as the yield on the 10y US Treasury.✓Higher TIPS Bond Prices ✓Higher Interest Rate Volatility ✓Expectations for More Fed Cuts or Lower Short Dated Interest Rates ✓Higher Long Dated Interest RatesX Lower TIPS Bond Prices X Lower Interest Rate Volatility
X Expectations for Less Fed Cuts or Higher Short Dated Interest Rates X Lower Long Dated Interest RatesPOSITIVENEGATIVEFour Factors that Impact IVOL 12IVOL Scenario Analysis
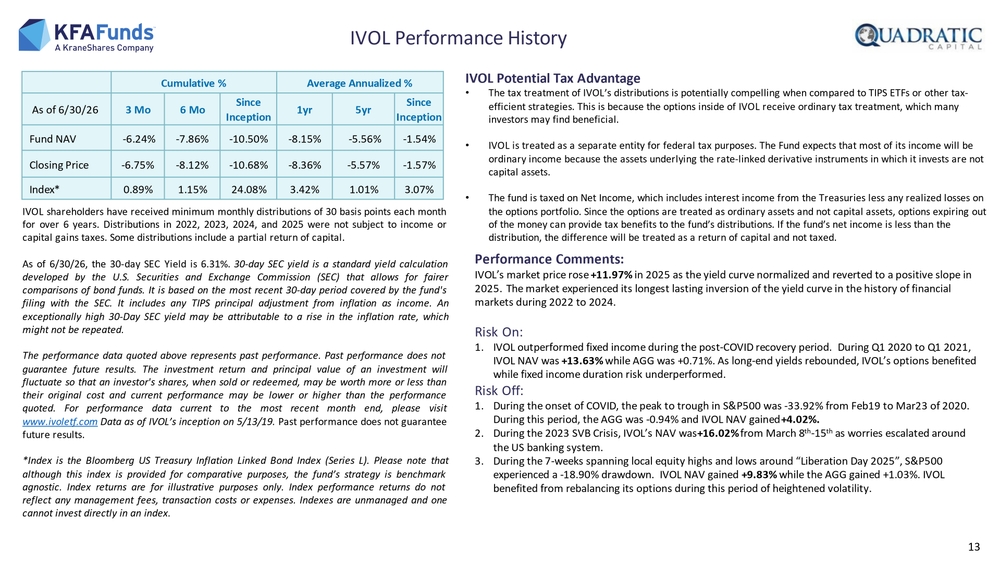
13IVOL shareholders have received minimum monthly distributions of 30 basis points each month
for over 6 years . Distributions in 2022 , 2023 , 2024 , and 2025 were not subject to income or
capital gains taxes . Some distributions include a partial return of capital .
As of 6/30/26, the 30-day SEC Yield is 6.31%. 30-day SEC yield is a standard yield calculation
developed by the U.S. Securities and Exchange Commission (SEC) that allows for fairer
comparisons of bond funds . It is based on the most recent 30-day period covered by the fund's
filing with the SEC. It includes any TIPS principal adjustment from inflation as income . An
exceptionally high 30-Day SEC yield may be attributable to a rise in the inflation rate, which
might not be repeated .
The performance data quoted above represents past performance . Past performance does not
guarantee future results . The investment return and principal value of an investment will
fluctuate so that an investor's shares, when sold or redeemed, may be worth more or less than
their original cost and current performance may be lower or higher than the performance
quoted . For performance data current to the most recent month end, please visit
www .ivoletf .com Data as of IVOL’s inception on 5/13/19. Past performance does not guarantee
future results .
Index is the Bloomberg US Treasury Inflation Linked Bond Index (Series L). Please note that
although this index is provided for comparative purposes, the fund’s strategy is benchmark
agnostic . Index returns are for illustrative purposes only. Index performance returns do not
reflect any management fees, transaction costs or expenses . Indexes are unmanaged and one
cannot invest directly in an index .Performance Comments:
IVOL’s market price rose +11.97% in 2025 as the yield curve normalized and reverted to a positive slope in
2025. The market experienced its longest lasting inversion of the yield curve in the history of financial
markets during 2022 to 2024.
Risk On:
1.IVOL outperformed fixed income during the post -COVID recovery period. During Q1 2020 to Q1 2021,
IVOL NAV was +13.63% while AGG was +0.71%. As long -end yields rebounded, IVOL’s options benefited
while fixed income duration risk underperformed.
Risk Off:
1.During the onset of COVID, the peak to trough in S&P500 was -33.92% from Feb19 to Mar23 of 2020.
During this period, the AGG was -0.94% and IVOL NAV gained +4.02%.
2.During the 2023 SVB Crisis, IVOL’s NAV was +16.02% from March 8th-15th as worries escalated around
the US banking system.
3.During the 7 -weeks spanning local equity highs and lows around “Liberation Day 2025”, S&P500
experienced a -18.90% drawdown. IVOL NAV gained +9.83% while the AGG gained +1.03%. IVOL
benefited from rebalancing its options during this period of heightened volatility. Cumulative % Average Annualized %
As of 6/30/26 3 Mo 6 MoSince
Inception1yr 5yrSince
Inception
Fund NAV -6.24% -7.86% -10.50% -8.15% -5.56% -1.54%
Closing Price -6.75% -8.12% -10.68% -8.36% -5.57% -1.57%
Index 0.89% 1.15% 24.08% 3.42% 1.01% 3.07%IVOL Performance History
IVOL Potential Tax Advantage
• The tax treatment of IVOL’s distributions is potentially compelling when compared to TIPS ETFs or other tax -
efficient strategies. This is because the options inside of IVOL receive ordinary tax treatment, which many
investors may find beneficial.
• IVOL is treated as a separate entity for federal tax purposes. The Fund expects that most of its income will be
ordinary income because the assets underlying the rate -linked derivative instruments in which it invests are not
capital assets.
• The fund is taxed on Net Income, which includes interest income from the Treasuries less any realized losses on
the options portfolio. Since the options are treated as ordinary assets and not capital assets, options expiring out
of the money can provide tax benefits to the fund’s distributions. If the fund’s net income is less than the
distribution, the difference will be treated as a return of capital and not taxed.
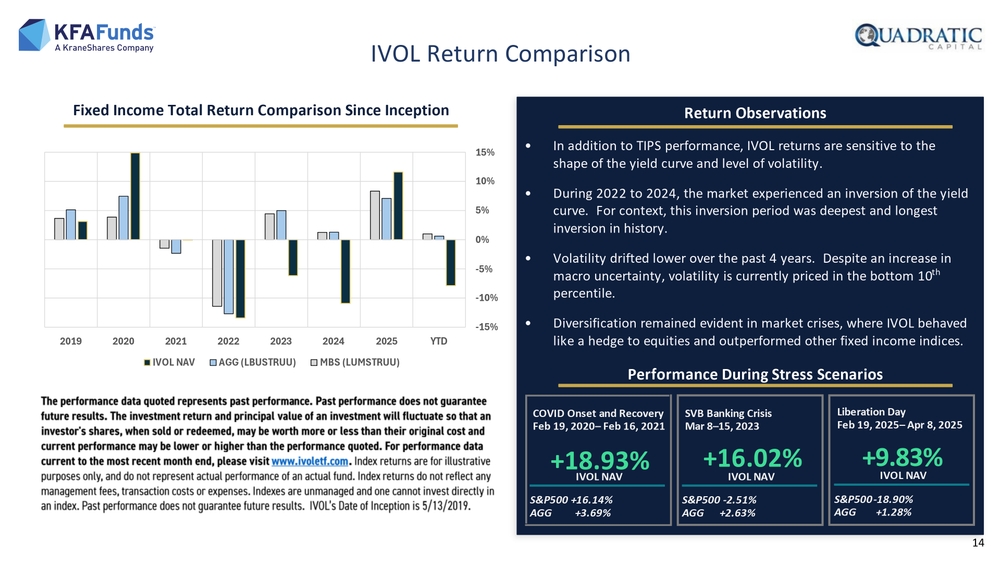
SVB Banking Crisis Mar 8 –15, 2023 +16.02% IVOL NAV S&P500 -2.51% AGG +2.63%COVID Onset and Recovery Feb 19, 2020 –Feb 16 , 2021 IVOL NAV S&P500 +16.14% AGG +3.69%Liberation Day Feb 19, 2025 –Apr 8, 2025 +9.83% IVOL NAV S&P500 -18.90% AGG +1.28%+18.93%IVOL Return Comparison Return Observations • In addition to TIPS performance, IVOL returns are sensitive to the shape of the yield curve and level of volatility. • During 2022 to 2024, the market experienced an inversion of the yield curve. For context, this inversion period was deepest and longest inversion in history. • Volatility drifted lower over the past 4 years. Despite an increase in macro uncertainty, volatility is currently priced in the bottom 10th percentile. • Diversification remained evident in market crises, where IVOL behaved like a hedge to equities and outperformed other fixed income indices. Fixed Income Total Return Comparison Since Inception 14Performance During Stress Scenarios The performance data quoted represents past performance. Past performance does not guarantee future results. The investment return and principal value of an investment will fluctuate so that an investor's shares, when sold or redeemed, may be worth more or less than their original cost and current performance may be lower or higher than the performance quoted. For performance data current to the most recent month end, please visit www.ivoletf.com . Index returns are for illustrative purposes only, and do not represent actual performance of an actual fund. Index returns do not reflect any management fees, transaction costs or expenses. Indexes are unmanaged and one cannot invest directly in an index. Past performance does not guarantee future results. IVOL’s Date of Inception is 5/13/2019. -15%-10%-5%0%5%10%15% YTD 2025 2024 2023 2022 2021 2020 2019 IVOL NAV AGG (LBUSTRUU) MBS (LUMSTRUU)
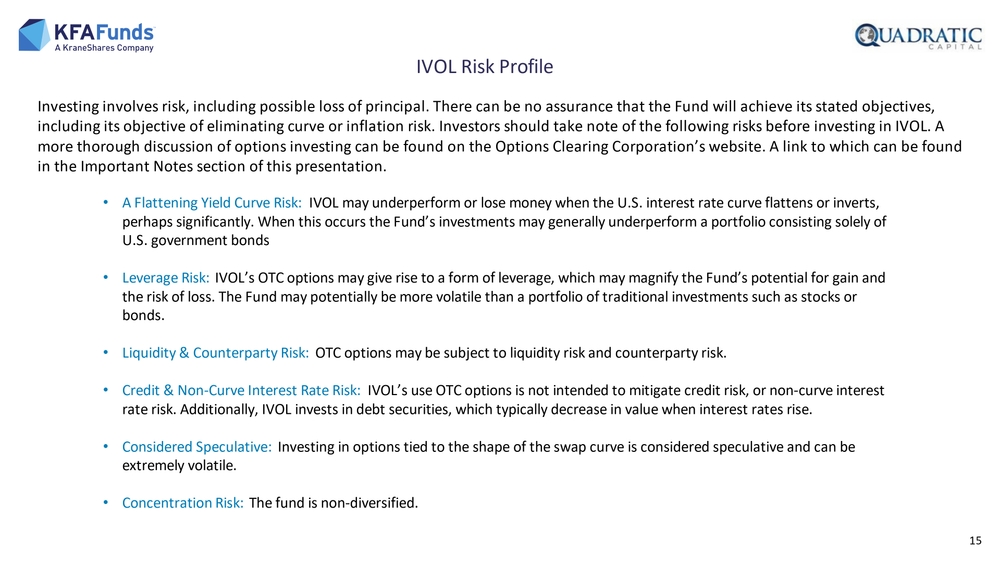
15Investing involves risk, including possible loss of principal. There can be no assurance that the Fund will achieve its state d objectives, including its objective of eliminating curve or inflation risk. Investors should take note of the following risks before inve sting in IVOL. A more thorough discussion of options investing can be found on the Options Clearing Corporation’s website. A link to which can be found in the Important Notes section of this presentation.IVOL Risk Profile •A Flattening Yield Curve Risk: IVOL may underperform or lose money when the U.S. interest rate curve flattens or inverts, perhaps significantly. When this occurs the Fund’s investments may generally underperform a portfolio consisting solely of U.S. government bonds •Leverage Risk: IVOL’s OTC options may give rise to a form of leverage, which may magnify the Fund’s potential for gain and the risk of loss. The Fund may potentially be more volatile than a portfolio of traditional investments such as stocks or bonds. •Liquidity & Counterparty Risk: OTC options may be subject to liquidity risk and counterparty risk. •Credit & Non -Curve Interest Rate Risk: IVOL’s use OTC options is not intended to mitigate credit risk, or non -curve interest rate risk. Additionally, IVOL invests in debt securities, which typically decrease in value when interest rates rise. •Considered Speculative: Investing in options tied to the shape of the swap curve is considered speculative and can be extremely volatile. •Concentration Risk: The fund is non -diversified.
16ETF liquidity is determined by the asset class, not by the fund size •Exchange -traded funds (ETFs) are a wrapper, and although an investor may hold a large percentage of an ETF, one must look at the percentage owned of the underlying asset class. ETF investors are not impacted by other investors’ trades in the same ETF •The ETF structure is unique in that all investors transact independently on an exchange. Being a large or small owner in a f und does not cause one investor to be more or less impacted by the actions of other investors. In a mutual fund, all investors ar e impacted by the trading activity of other holders in the fund. An ETF closure does not create principal risk •If a fund were to close, neither large nor small investors would have a principal risk. The fund would be liquidated by the p ortfolio manager, and the investors would receive back NAV of the fund, minus costs, at the time of liquidation. Trading in and out and fund size •Investors can trade in and out of a fund regardless of the fund’s AUM. ETF liquidity providers (market makers) can easily tr ansfer the liquidity of the underlying basket into ETF shares. Market makers also accept NAV based orders for larger tickets. Guide to Trading ETFs
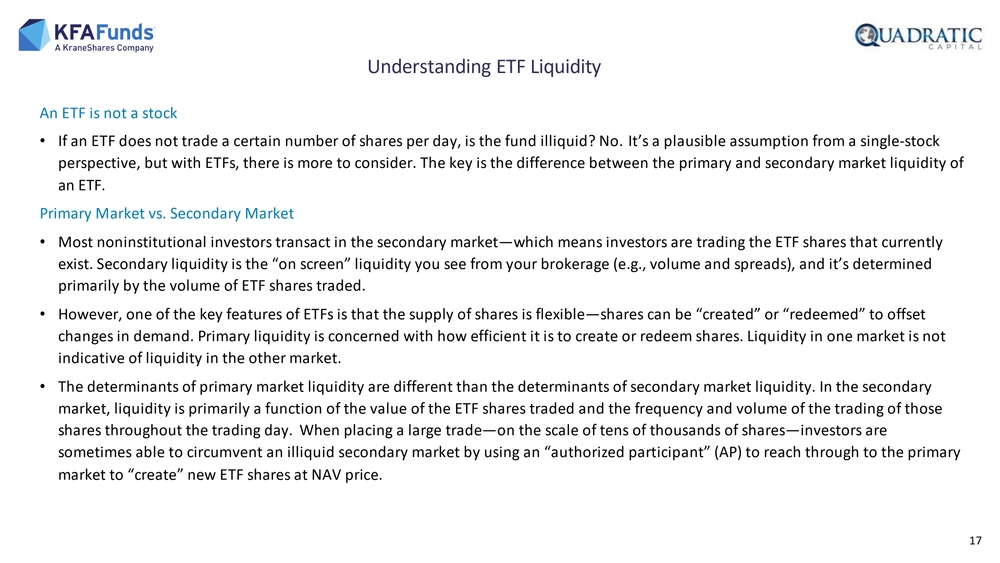
17An ETF is not a stock
•If an ETF does not trade a certain number of shares per day, is the fund illiquid? No. It’s a plausible assumption from a si ngle-stock
perspective, but with ETFs, there is more to consider. The key is the difference between the primary and secondary market liq uidity of
an ETF.
Primary Market vs. Secondary Market
•Most noninstitutional investors transact in the secondary market —which means investors are trading the ETF shares that currently
exist. Secondary liquidity is the “on screen” liquidity you see from your brokerage (e.g., volume and spreads), and it’s dete rmined
primarily by the volume of ETF shares traded.
•However, one of the key features of ETFs is that the supply of shares is flexible —shares can be “created” or “redeemed” to offse t
changes in demand. Primary liquidity is concerned with how efficient it is to create or redeem shares. Liquidity in one marke t is not
indicative of liquidity in the other market.
•The determinants of primary market liquidity are different than the determinants of secondary market liquidity. In the second ary
market, liquidity is primarily a function of the value of the ETF shares traded and the frequency and volume of the trading o f those
shares throughout the trading day. When placing a large trade —on the scale of tens of thousands of shares —investors are
sometimes able to circumvent an illiquid secondary market by using an “authorized participant” (AP) to reach through to the p rimary
market to “create” new ETF shares at NAV price.Understanding ETF Liquidity
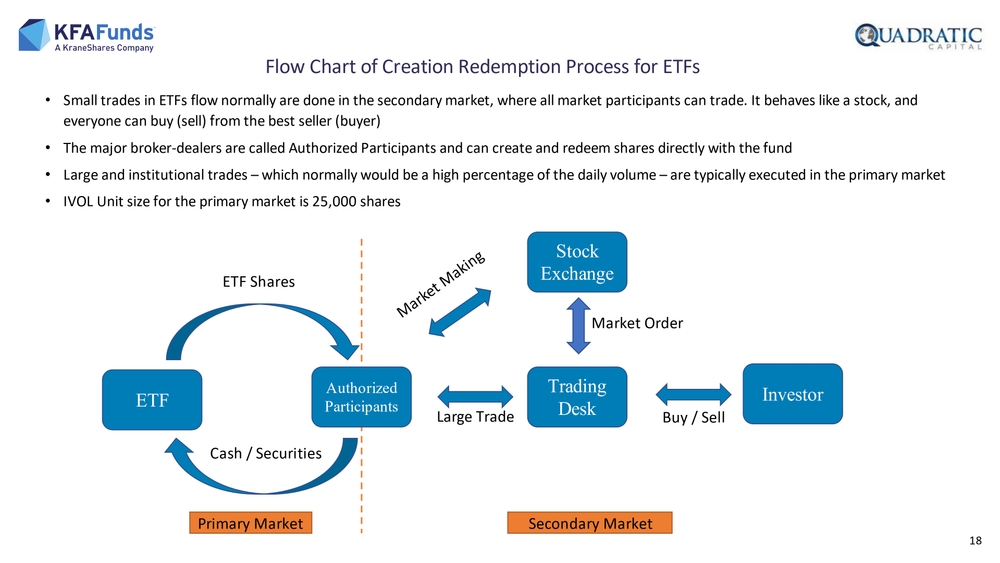
18•Small trades in ETFs flow normally are done in the secondary market, where all market participants can trade. It behaves like a stock, and everyone can buy (sell) from the best seller (buyer) •The major broker -dealers are called Authorized Participants and can create and redeem shares directly with the fund •Large and institutional trades – which normally would be a high percentage of the daily volume – are typically executed in the p rimary market •IVOL Unit size for the primary market is 25,000 shares ETFAuthorized ParticipantsTrading DeskStock Exchange Investor Primary Market Secondary MarketETF Shares Cash / SecuritiesLarge TradeMarket Order Buy / SellFlow Chart of Creation Redemption Process for ETFs
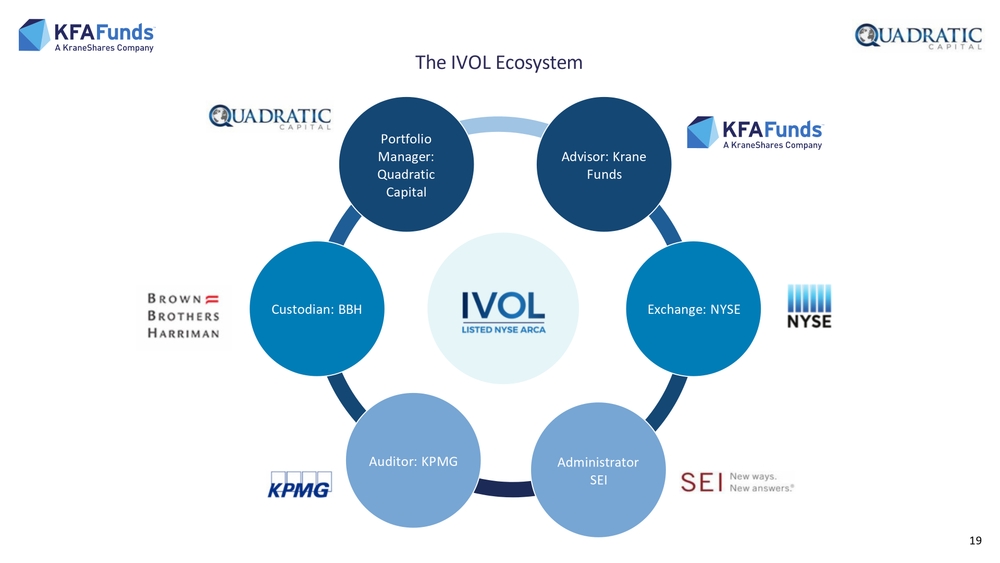
Portfolio Manager: Quadratic CapitalAdvisor: Krane Funds Exchange: NYSE Administrator SEIAuditor: KPMGCustodian: BBH 19 The IVOL Ecosystem
CK Chan, Senior Trader and Market Strategist, Quadratic Capital Management CK’s fixed income and volatility experience spans over 20 years as he headed market -making businesses for large banks such as Go ldman Sachs, Morgan Stanley, and Citigroup. In those roles, CK provided liquidity and solutions for institutional clients such as asset managers, insurers , pensions, banks, and hedge funds. CK serves as an Adjunct Professor of Fixed Income at New York University and holds B.S. degrees in Mathematics and Management Science from Massachusetts Institute of Technology and an M.S. in Financial Risk Engineering from New York University. Nancy Davis, Chief Investment Officer, Quadratic Capital Management Nancy Davis founded Quadratic Capital in 2013. She is the portfolio manager for The Quadratic Interest Rate Volatility and In flation Hedge ETF (Ticker: IVOL). Prior to starting Quadratic, Nancy was with Goldman Sachs for about a decade, where she spent the majority of her time with the pro prietary trading group. During her tenure, she advanced to become the Head of Credit, Derivatives and OTC Trading for Goldman Sachs Principal Strategies. She wa s also a Portfolio Manager at JP Morgan’s hedge fund Highbridge Capital Management. Nancy has been the recipient of numerous industry recognitions. Barron’s named her to their inaugural list of the "100 Most I nfluential Women in U.S. Finance." Institutional Investor called her a "Rising Star of Hedge Funds." The Hedge Fund Journal tapped her as one of "Tomorrow's Tit ans." Nancy writes and speaks frequently about markets and investing. She has been profiled by Forbes, and interviewed by Barron’s, The Economist, The Wall Street Journal, and The Financial Times, among others. Nancy is also a frequent guest on financial television. Glenn Christal, Chief Operating Officer, Quadratic Capital Management Glenn Christal is responsible for overseeing the business and trading operations for the company. Previously, Glenn Christal was at Tudor Investment Corp, a multi – billion macro hedge fund, for fifteen years where he was the Treasurer and chair of the Treasury and Credit Committees. Mr. C hristal oversaw collateral management, cash management, credit and trade documentation negotiations. His prior role was the Chief Operations Officer at Millennium Partners where he oversaw trade operations. 20 Portfolio Management and Capital Markets Leadership
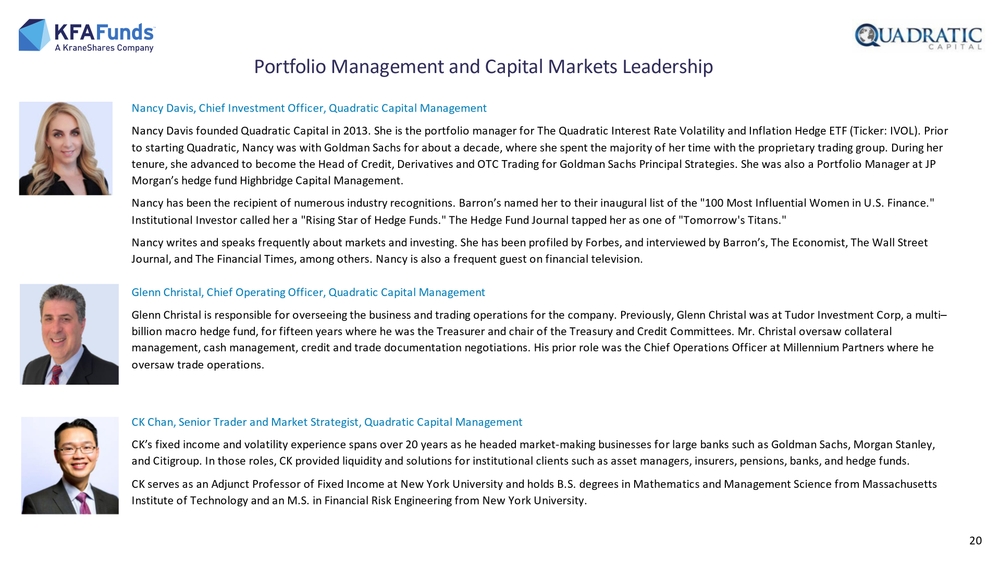
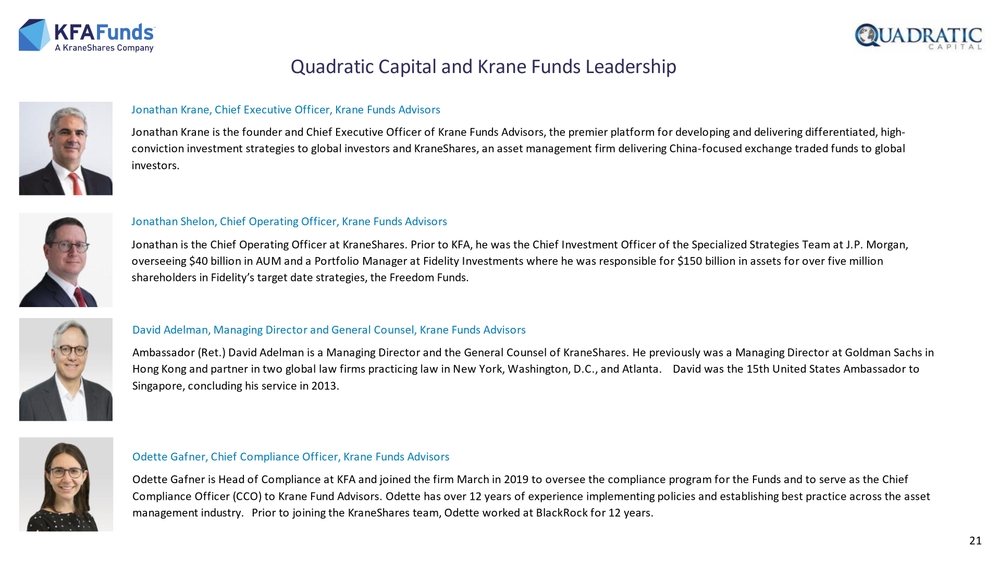
21Jonathan Shelon , Chief Operating Officer, Krane Funds Advisors Jonathan is the Chief Operating Officer at KraneShares. Prior to KFA, he was the Chief Investment Officer of the Specialized Strategies Team at J.P . Morgan, overseeing $40 billion in AUM and a Portfolio Manager at Fidelity Investments where he was responsible for $150 billion in as sets for over five million shareholders in Fidelity’s target date strategies, the Freedom Funds. David Adelman, Managing Director and General Counsel, Krane Funds Advisors Ambassador (Ret.) David Adelman is a Managing Director and the General Counsel of KraneShares. He previously was a Managing D irector at Goldman Sachs in Hong Kong and partner in two global law firms practicing law in New York, Washington, D.C., and Atlanta. David was the 15th United States Ambassador to Singapore, concluding his service in 2013.Jonathan Krane, Chief Executive Officer, Krane Funds Advisors Jonathan Krane is the founder and Chief Executive Officer of Krane Funds Advisors, the premier platform for developing and de livering differentiated, high - conviction investment strategies to global investors and KraneShares, an asset management firm delivering China -focused exchange traded funds to global investors. Quadratic Capital and Krane Funds Leadership Odette Gafner , Chief Compliance Officer, Krane Funds Advisors Odette Gafner is Head of Compliance at KFA and joined the firm March in 2019 to oversee the compliance program for the Funds and to serve a s the Chief Compliance Officer (CCO) to Krane Fund Advisors. Odette has over 12 years of experience implementing policies and establishin g best practice across the asset management industry. Prior to joining the KraneShares team, Odette worked at BlackRock for 12 years.
22
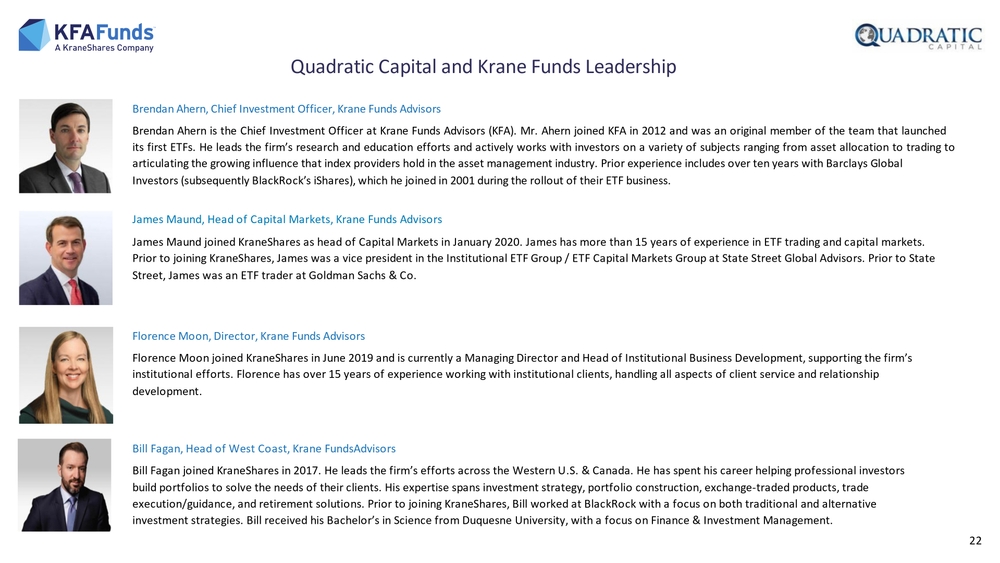
James Maund , Head of Capital Markets, Krane Funds Advisors
James Maund joined KraneShares as head of Capital Markets in January 2020. James has more than 15 years of experience in ETF trading and capital markets.
Prior to joining KraneShares, James was a vice president in the Institutional ETF Group / ETF Capital Markets Group at State Street Global Advisors. Prior to State
Street, James was an ETF trader at Goldman Sachs & Co. Quadratic Capital and Krane Funds Leadership
Brendan Ahern, Chief Investment Officer, Krane Funds Advisors
Brendan Ahern istheChief Investment Officer atKrane Funds Advisors (KFA) .Mr.Ahern joined KFA in2012 and was anoriginal member oftheteam that launched
itsfirst ETFs .Heleads thefirm’s research and education efforts and actively works with investors onavariety ofsubjects ranging from asset allocation totrading to
articulating thegrowing influence that index providers hold intheasset management industry .Prior experience includes over tenyears with Barclays Global
Investors (subsequently BlackRock’s iShares), which hejoined in2001 during therollout oftheir ETFbusiness .
Florence Moon, Director, Krane Funds Advisors
Florence Moon joined KraneShares in June 2019 and is currently a Managing Director and Head of Institutional Business Develop men t, supporting the firm’s
institutional efforts. Florence has over 15 years of experience working with institutional clients, handling all aspects of c lient service and relationship
development.
Bill Fagan, Head of West Coast , Krane Funds Advisors
Bill Fagan joined KraneShares in 2017. He leads the firm’s efforts across the Western U.S. & Canada. He has spent his career helping professional investors
build portfolios to solve the needs of their clients. His expertise spans investment strategy, portfolio construction, exchan ge-traded products, trade
execution/guidance, and retirement solutions. Prior to joining KraneShares, Bill worked at BlackRock with a focus on both tra ditional and alternative
investment strategies. Bill received his Bachelor’s in Science from Duquesne University, with a focus on Finance & Investment Management.
23Quadratic Capital and Krane Funds Leadership
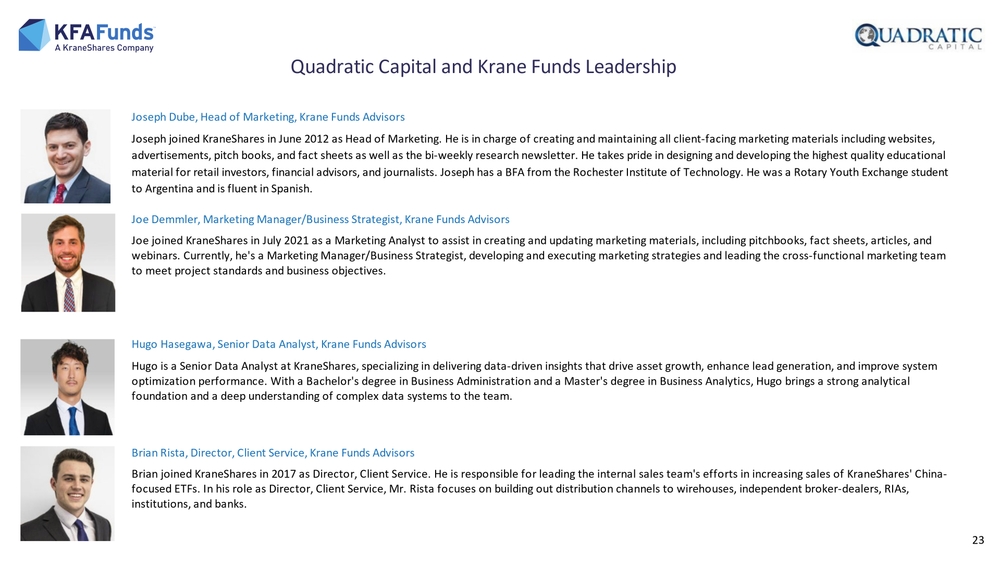
Joe Demmler, Marketing Manager/Business Strategist, Krane Funds Advisors
Joe joined KraneShares in July 2021 as a Marketing Analyst to assist in creating and updating marketing materials, including pitchbooks, fact sheets, articles, and
webinars. Currently, he's a Marketing Manager/Business Strategist, developing and executing marketing strategies and leading the cross -functional marketing team
to meet project standards and business objectives.
Joseph Dube, Head of Marketing, Krane Funds Advisors
Joseph joined KraneShares in June 2012 as Head of Marketing. He is in charge of creating and maintaining all client -facing marketing materials including websites,
advertisements, pitch books, and fact sheets as well as the bi-weekly research newsletter . He takes pride in designing and developing the highest quality educational
material for retail investors, financial advisors, and journalists. Joseph has a BFA from the Rochester Institute of Technology. He was a Rotary Youth Exchange student
to Argentina and is fluent in Spanish.
Hugo Hasegawa, Senior Data Analyst, Krane Funds Advisors
Hugo is a Senior Data Analyst at KraneShares, specializing in delivering data -driven insights that drive asset growth, enhance l ead generation, and improve system
optimization performance. With a Bachelor's degree in Business Administration and a Master's degree in Business Analytics, Hu go brings a strong analytical
foundation and a deep understanding of complex data systems to the team.
Brian Rista, Director, Client Service, Krane Funds Advisors
Brian joined KraneShares in 2017 as Director, Client Service. He is responsible for leading the internal sales team's efforts in increasing sales of KraneShares' China -
focused ETFs. In his role as Director, Client Service, Mr. Rista focuses on building out distribution channels to wirehouses , independent broker -dealers, RIAs,
institutions, and banks.
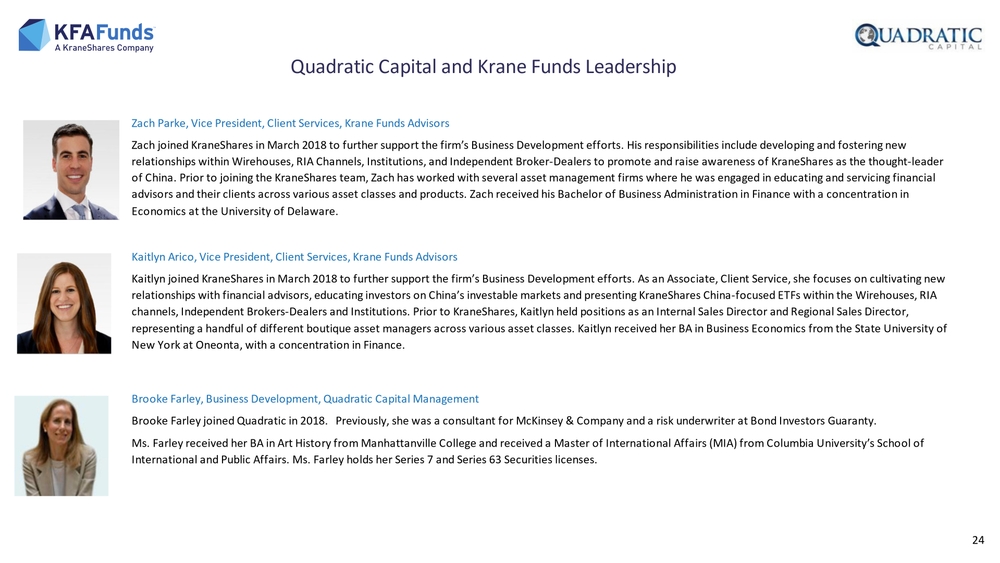
24Zach Parke, Vice President, Client Services, Krane Funds Advisors
Zach joined KraneShares in March 2018 to further support the firm’s Business Development efforts. His responsibilities includ e developing and fostering new
relationships within Wirehouses , RIA Channels, Institutions, and Independent Broker -Dealers to promote and raise awareness of KraneShares as the thought -leader
of China. Prior to joining the KraneShares team, Zach has worked with several asset management firms where he was engaged in educating and servicing financial
advisors and their clients across various asset classes and products. Zach received his Bachelor of Business Administration i n Finance with a concentration in
Economics at the University of Delaware.
Kaitlyn Arico, Vice President, Client Services, Krane Funds Advisors
Kaitlyn joined KraneShares in March 2018 to further support the firm’s Business Development efforts. As an Associate, Client Service, she focuses on cultivating new
relationships with financial advisors, educating investors on China’s investable markets and presenting KraneShares China -focuse d ETFs within the Wirehouses , RIA
channels, Independent Brokers -Dealers and Institutions. Prior to KraneShares, Kaitlyn held positions as an Internal Sales Direct or and Regional Sales Director,
representing a handful of different boutique asset managers across various asset classes. Kaitlyn received her BA in Business Economics from the State University of
New York at Oneonta, with a concentration in Finance.
Brooke Farley, Business Development, Quadratic Capital Management
Brooke Farley joined Quadratic in 2018. Previously, she was a consultant for McKinsey & Company and a risk underwriter at Bo nd Investors Guaranty.
Ms. Farley received her BA in Art History from Manhattanville College and received a Master of International Affairs (MIA) fr om Columbia University’s School of
International and Public Affairs. Ms. Farley holds her Series 7 and Series 63 Securities licenses.
Quadratic Capital and Krane Funds Leadership
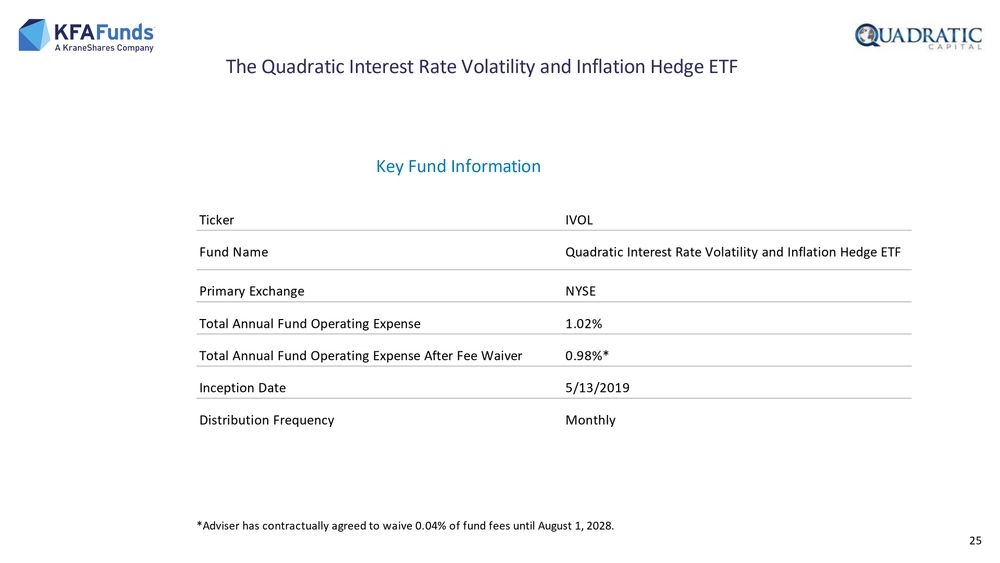
25Ticker IVOL Fund Name Quadratic Interest Rate Volatility and Inflation Hedge ETF Primary Exchange NYSE Total Annual Fund Operating Expense 1.02% Total Annual Fund Operating Expense After Fee Waiver 0.98%* Inception Date 5/13/2019 Distribution Frequency MonthlyKey Fund InformationThe Quadratic Interest Rate Volatility and Inflation Hedge ETF *Adviser has contractually agreed to waive 0.04% of fund fees until August 1, 2028.
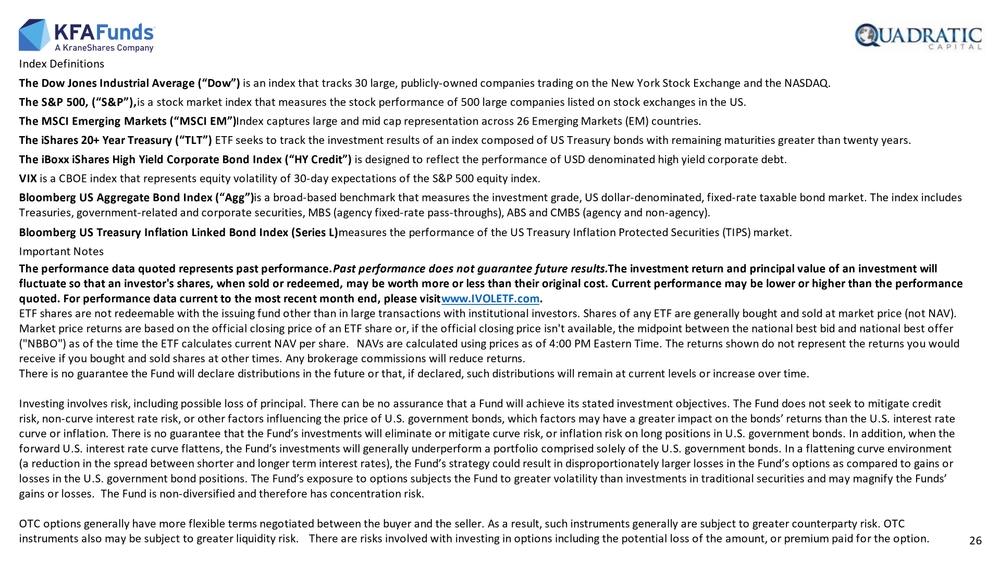
Index Definitions The Dow Jones Industrial Average (“Dow”) is an index that tracks 30 large, publicly -owned companies trading on the New York Stock Exchange and the NASDAQ. The S&P 500, (“S&P”), is a stock market index that measures the stock performance of 500 large companies listed on stock exchanges in the US. The MSCI Emerging Markets (“MSCI EM”) Index captures large and mid cap representation across 26 Emerging Markets (EM) countries. The iShares 20+ Year Treasury (“TLT”) ETF seeks to track the investment results of an index composed of US Treasury bonds with remaining maturities greater than tw enty years. The iBoxx iShares High Yield Corporate Bond Index (“HY Credit”) is designed to reflect the performance of USD denominated high yield corporate debt. VIX is a CBOE index that represents equity volatility of 30 -day expectations of the S&P 500 equity index. Bloomberg US Aggregate Bond Index (“ Agg”) is a broad -based benchmark that measures the investment grade, US dollar -denominated, fixed -rate taxable bond market. The index includes Treasuries, government -related and corporate securities, MBS (agency fixed -rate pass -throughs), ABS and CMBS (agency and non -agency). Bloomberg US Treasury Inflation Linked Bond Index (Series L) measures the performance of the US Treasury Inflation Protected Securities (TIPS) market. 26Important Notes The performance data quoted represents past performance. Past performance does not guarantee future results. The investment return and principal value of an investment will fluctuate so that an investor's shares, when sold or redeemed, may be worth more or less than their original cost. Current pe rformance may be lower or higher than the performance quoted. For performance data current to the most recent month end, please visit www.IVOLETF.com . ETF shares are not redeemable with the issuing fund other than in large transactions with institutional investors. Shares of any ETF are generally bought and sold at market price (not NAV). Market price returns are based on the official closing price of an ETF share or, if the official closing price isn't availabl e, the midpoint between the national best bid and national best offer ("NBBO") as of the time the ETF calculates current NAV per share. NAVs are calculated using prices as of 4:00 PM Eastern Tim e. The returns shown do not represent the returns you would receive if you bought and sold shares at other times. Any brokerage commissions will reduce returns. There is no guarantee the Fund will declare distributions in the future or that, if declared, such distributions will remain at current levels or increase over time. Investing involves risk, including possible loss of principal. There can be no assurance that a Fund will achieve its stated investment objectives. The Fund does not seek to mitigate credit risk, non -curve interest rate risk, or other factors influencing the price of U.S. government bonds, which factors may have a gr eater impact on the bonds’ returns than the U.S. interest rate curve or inflation. There is no guarantee that the Fund’s investments will eliminate or mitigate curve risk, or inflation ris k on long positions in U.S. government bonds. In addition, when the forward U.S. interest rate curve flattens, the Fund’s investments will generally underperform a portfolio comprised solely of the U.S. government bonds. In a flattening curve environment (a reduction in the spread between shorter and longer term interest rates), the Fund’s strategy could result in disproportion ately larger losses in the Fund’s options as compared to gains or losses in the U.S. government bond positions. The Fund’s exposure to options subjects the Fund to greater volatility than inv estments in traditional securities and may magnify the Funds’ gains or losses. The Fund is non -diversified and therefore has concentration risk. OTC options generally have more flexible terms negotiated between the buyer and the seller. As a result, such instruments gen erally are subject to greater counterparty risk. OTC instruments also may be subject to greater liquidity risk. There are risks involved with investing in options including the potential loss of the amount, or premium paid for the option.
This material must be preceded or accompanied by a current prospectus . Investors should read it carefully before investing or sending money . IVOL is distributed by SEI Investments Distribution Co. (SIDCO), 1 Freedom Valley Drive, Oaks, PA 19456. The Fund's sub -adviser is Quadratic Capital Management LLC (Quadratic). The Fund’s advisor is Krane Fund Advisors LLC (Krane). SIDCO is not affiliated with Quadratic or Krane. Neither Quadratic, Krane nor SI DCO or their affiliates provide tax advice. Please note that ( i) any discussion of U.S. tax matters contained in this communication cannot be used by you for the purpose of avoiding tax penaltie s; (ii) this communication was written to support the promotion or marketing of the matters addressed herein; and (iii) you should seek advice based on your particular circumstances from an independent tax advisor. 27