Hedged Equity ETF | KSPY | KraneShares
by Kraneshares
A Risk-Managed Approach to US Equities
Overview of the KraneShares Hedgeye Hedged Equity Index ETF (Ticker: KSPY)
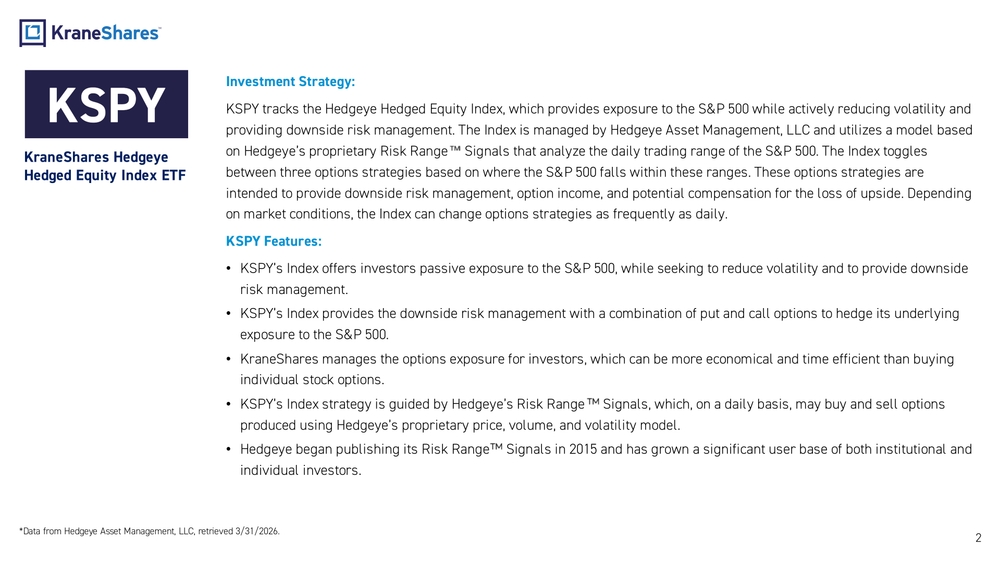
Investment Strategy:
KSPY tracks the Hedgeye Hedged Equity Index, which provides exposure to the S&P 500 while actively reducing volatility and providing downside risk management. The Index is managed by Hedgeye Asset Management, LLC and utilizes a model based on Hedgeye's proprietary Risk Range Signals that analyze the daily trading range of the S&P 500. The Index toggles between three options strategies based on where the S&P 500 falls within these ranges. These options strategies are intended to provide downside risk management, option income, and potential compensation for the loss of upside. Depending on market conditions, the Index can change options strategies as frequently as daily.
KSPY Features:
- KSPY's Index offers investors passive exposure to the S&P 500, while seeking to reduce volatility and to provide downside risk management.
- KSPY's Index provides the downside risk management with a combination of put and call options to hedge its underlying exposure to the S&P 500.
- KraneShares manages the options exposure for investors, which can be more economical and time efficient than buying individual stock options.
- KSPY's Index strategy is guided by Hedgeye's Risk Range Signals, which, on a daily basis, may buy and sell options produced using Hedgeye's proprietary price, volume, and volatility model.
- Hedgeye began publishing its Risk Range Signals in 2015 and has grown a significant user base of both institutional and individual investors.
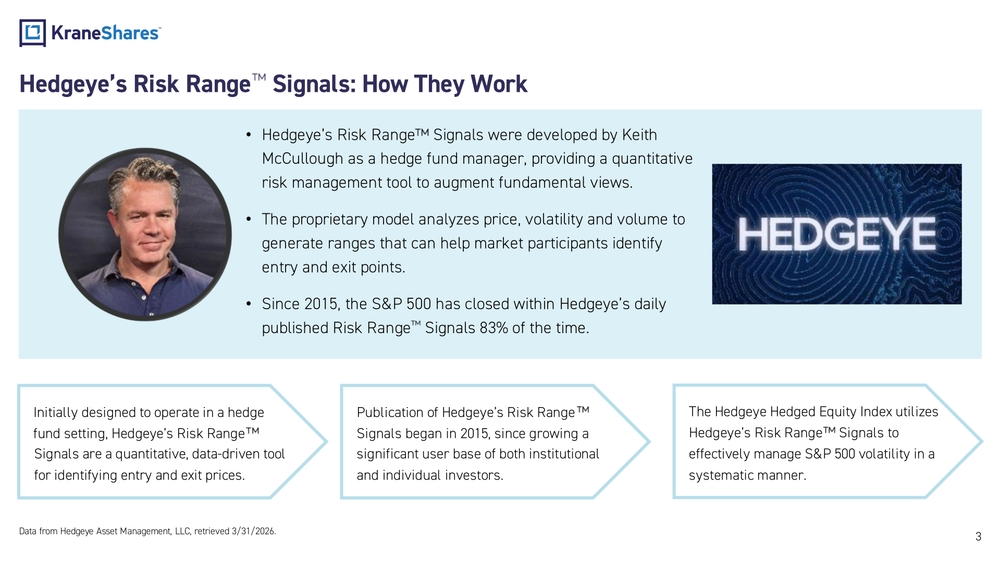
Hedgeye's Risk Range Signals: How They Work
- Hedgeye's Risk Range Signals were developed by Keith McCullough as a hedge fund manager, providing a quantitative risk management tool to augment fundamental views.
- The proprietary model analyzes price, volatility and volume to generate ranges that can help market participants identify entry and exit points.
- Since 2015, the S&P 500 has closed within Hedgeye's daily published Risk Range Signals 83% of the time.
Initially designed to operate in a hedge fund setting, Hedgeye's Risk Range Signals are a quantitative, data-driven tool for identifying entry and exit prices.
Publication of Hedgeye's Risk Range Signals began in 2015, since growing a significant user base of both institutional and individual investors.
The Hedgeye Hedged Equity Index utilizes Hedgeye's Risk Range Signals to effectively manage S&P 500 volatility in a systematic manner.
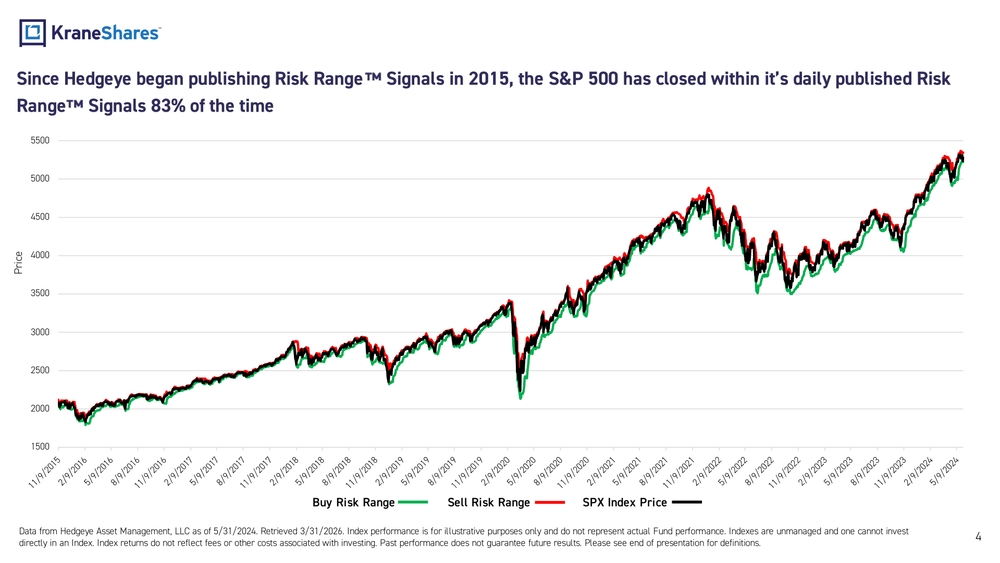
Since Hedgeye began publishing Risk Range Signals in 2015, the S&P 500 has closed within its daily published Risk Range Signals 83% of the time
S&P 500 Index Price chart from 11/9/2015 to 5/9/2024 showing Buy Risk Range (green), Sell Risk Range (red), and SPX Index Price (black).
Price range shown: 1500 to 5500
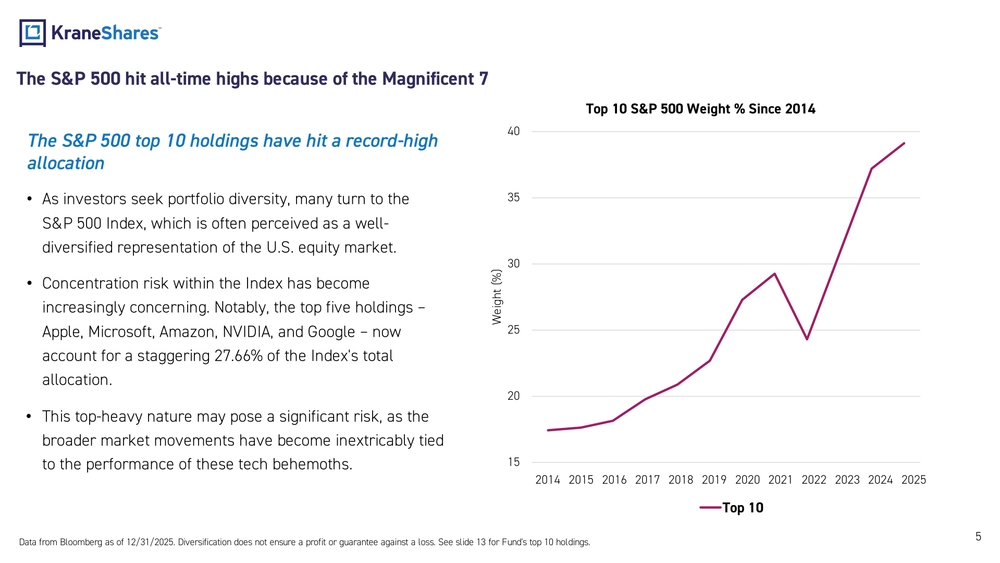
The S&P 500 hit all-time highs because of the Magnificent 7
The S&P 500 top 10 holdings have hit a record-high allocation
- As investors seek portfolio diversity, many turn to the S&P 500 Index, which is often perceived as a well-diversified representation of the U.S. equity market.
- Concentration risk within the Index has become increasingly concerning. Notably, the top five holdings – Apple, Microsoft, Amazon, NVIDIA, and Google – now account for a staggering 27.66% of the Index's total allocation.
- This top-heavy nature may pose a significant risk, as the broader market movements have become inextricably tied to the performance of these tech behemoths.
Top 10 S&P 500 Weight % Since 2014 — Chart showing weight (%) rising from ~18% in 2014 to ~39% in 2025.
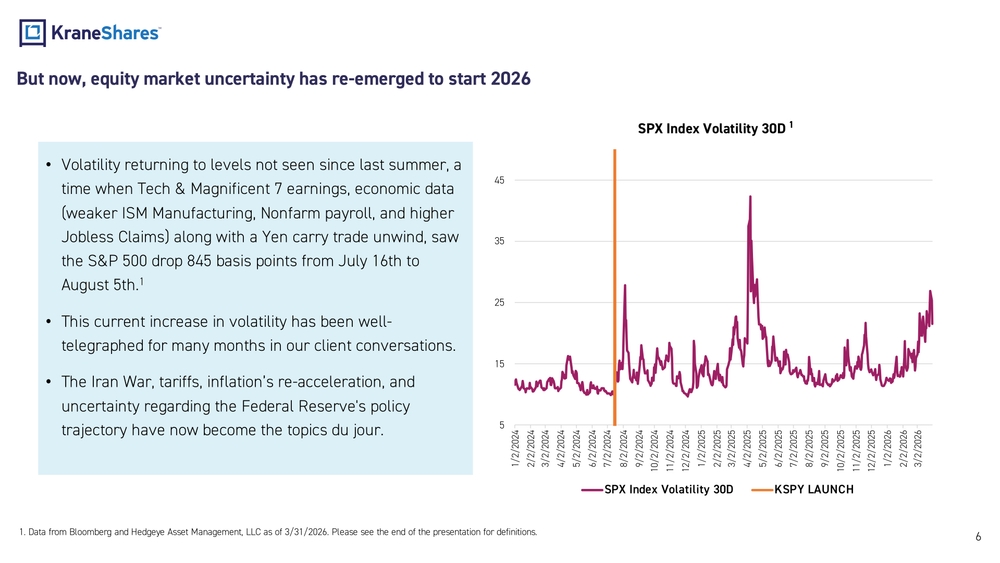
But now, equity market uncertainty has re-emerged to start 2026
- Volatility returning to levels not seen since last summer, a time when Tech & Magnificent 7 earnings, economic data (weaker ISM Manufacturing, Nonfarm payroll, and higher Jobless Claims) along with a Yen carry trade unwind, saw the S&P 500 drop 845 basis points from July 16th to August 5th.
- This current increase in volatility has been well-telegraphed for many months in our client conversations.
- The Iran War, tariffs, inflation's re-acceleration, and uncertainty regarding the Federal Reserve's policy trajectory have now become the topics du jour.
SPX Index Volatility 30D chart from 1/2/2024 to 3/2/2026, with KSPY LAUNCH marker.
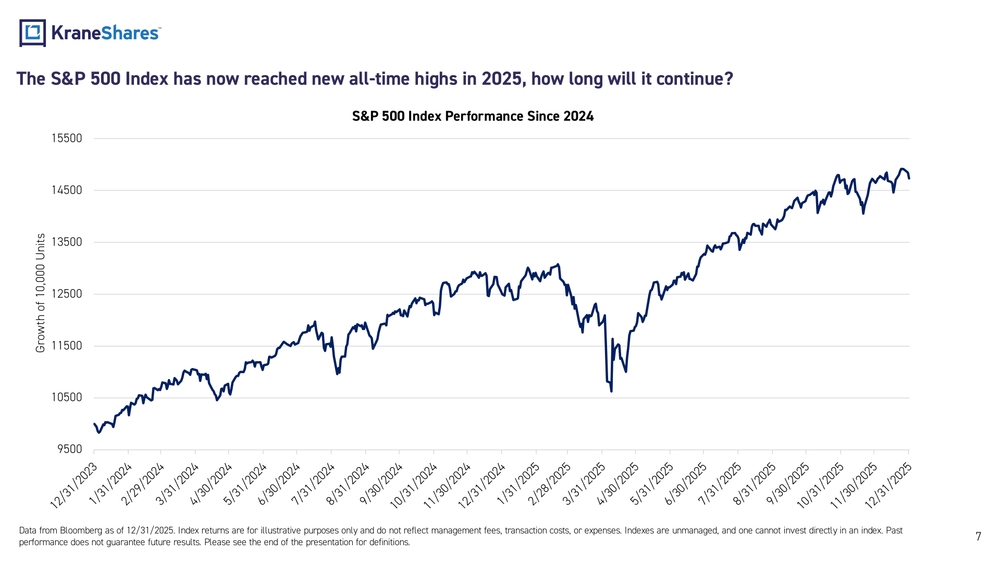
The S&P 500 Index has now reached new all-time highs in 2025, how long will it continue?
S&P 500 Index Performance Since 2024 — Chart showing Growth of 10,000 Units from 12/31/2023 to 12/31/2025, ranging from approximately 9,500 to 15,500.
KSPY: How It Works
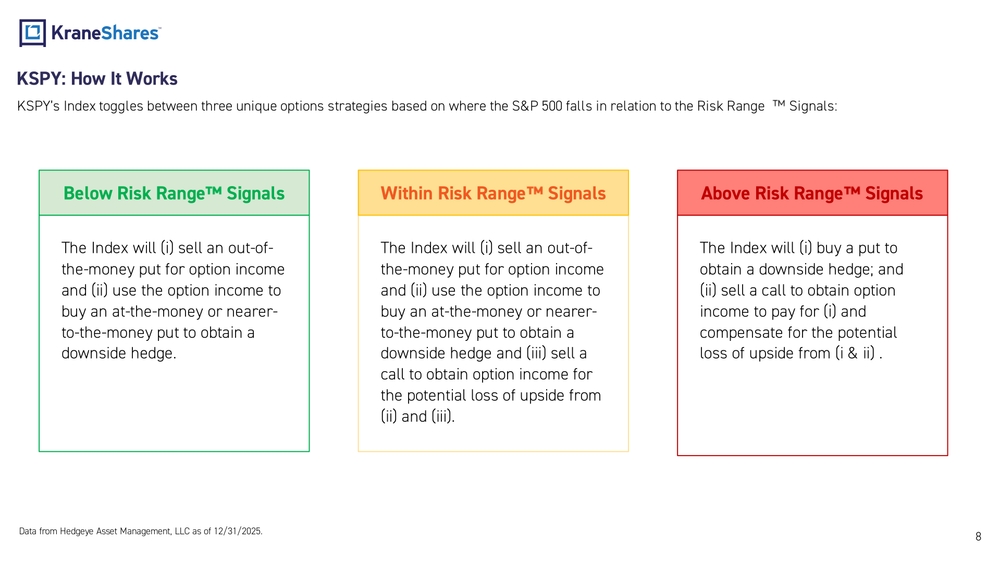
KSPY's Index toggles between three unique options strategies based on where the S&P 500 falls in relation to the Risk Range Signals:
Below Risk Range Signals
The Index will (i) sell an out-of-the-money put for option income and (ii) use the option income to buy an at-the-money or nearer-to-the-money put to obtain a downside hedge.
Within Risk Range Signals
The Index will (i) sell an out-of-the-money put for option income and (ii) use the option income to buy an at-the-money or nearer-to-the-money put to obtain a downside hedge and (iii) sell a call to obtain option income for the potential loss of upside from (ii) and (iii).
Above Risk Range Signals
The Index will (i) buy a put to obtain a downside hedge; and (ii) sell a call to obtain option income to pay for (i) and compensate for the potential loss of upside from (i & ii).
KSPY: How It Works
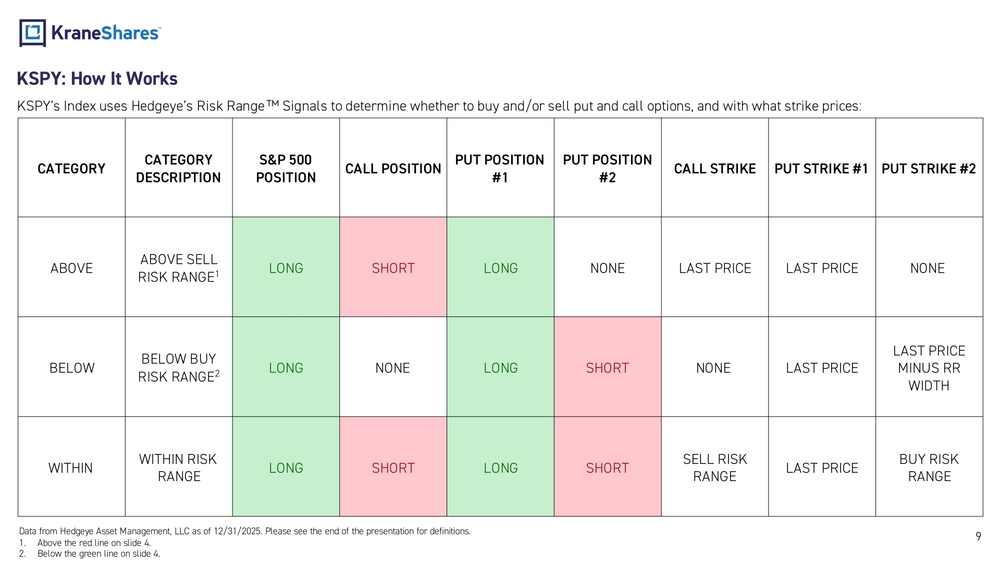
KSPY's Index uses Hedgeye's Risk Range Signals to determine whether to buy and/or sell put and call options, and with what strike prices:
| CATEGORY | CATEGORY DESCRIPTION | S&P 500 POSITION | CALL POSITION | PUT POSITION #1 | PUT POSITION #2 | CALL STRIKE | PUT STRIKE #1 | PUT STRIKE #2 |
|---|---|---|---|---|---|---|---|---|
| ABOVE | ABOVE SELL RISK RANGE | LONG | SHORT | LONG | NONE | LAST PRICE | LAST PRICE | NONE |
| BELOW | BELOW BUY RISK RANGE | LONG | NONE | LONG | SHORT | NONE | LAST PRICE | LAST PRICE MINUS RR WIDTH |
| WITHIN | WITHIN RISK RANGE | LONG | SHORT | LONG | SHORT | SELL RISK RANGE | LAST PRICE | BUY RISK RANGE |
KSPY: How It Works
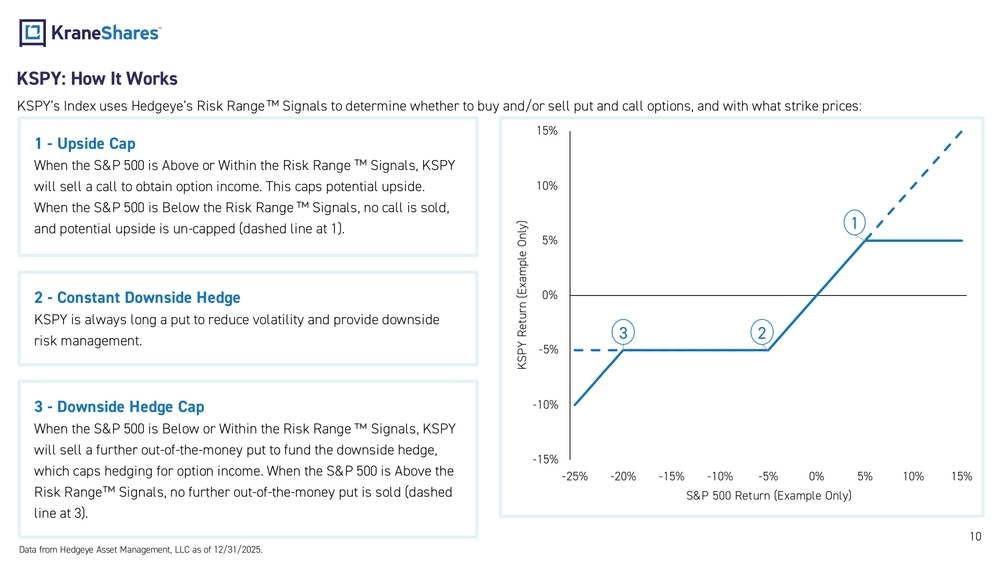
KSPY's Index uses Hedgeye's Risk Range Signals to determine whether to buy and/or sell put and call options, and with what strike prices:
1 - Upside Cap
When the S&P 500 is Above or Within the Risk Range Signals, KSPY will sell a call to obtain option income. This caps potential upside. When the S&P 500 is Below the Risk Range Signals, no call is sold, and potential upside is un-capped (dashed line at 1).
2 - Constant Downside Hedge
KSPY is always long a put to reduce volatility and provide downside risk management.
3 - Downside Hedge Cap
When the S&P 500 is Below or Within the Risk Range Signals, KSPY will sell a further out-of-the-money put to fund the downside hedge, which caps hedging for option income. When the S&P 500 is Above the Risk Range Signals, no further out-of-the-money put is sold (dashed line at 3).
KSPY: How It Works
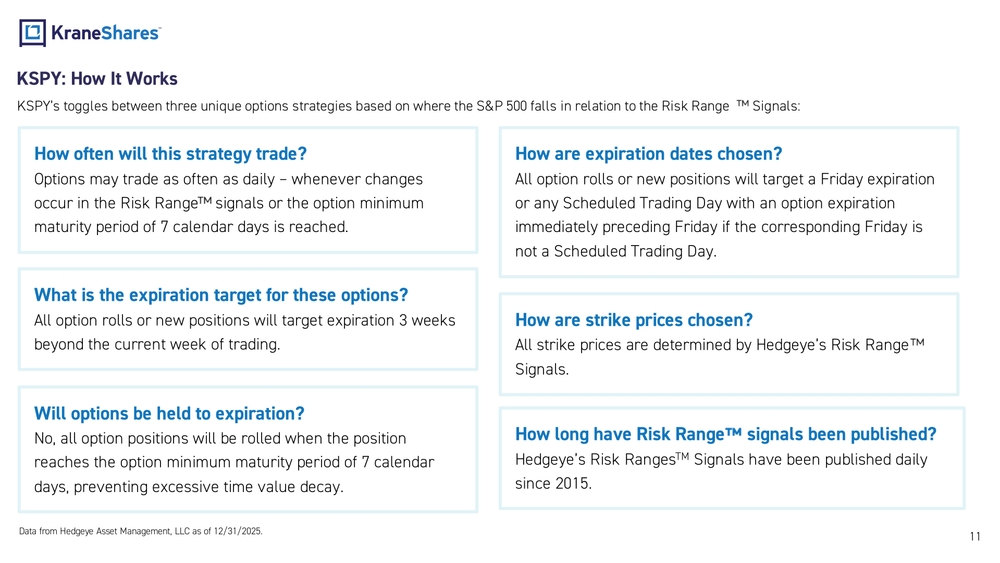
KSPY's toggles between three unique options strategies based on where the S&P 500 falls in relation to the Risk Range™ Signals:
How often will this strategy trade?
Options may trade as often as daily – whenever changes occur in the Risk Range™ signals or the option minimum maturity period of 7 calendar days is reached.
How are expiration dates chosen?
All option rolls or new positions will target a Friday expiration or any Scheduled Trading Day with an option expiration immediately preceding Friday if the corresponding Friday is not a Scheduled Trading Day.
What is the expiration target for these options?
All option rolls or new positions will target expiration 3 weeks beyond the current week of trading.
How are strike prices chosen?
All strike prices are determined by Hedgeye's Risk Range™ Signals.
Will options be held to expiration?
No, all option positions will be rolled when the position reaches the option minimum maturity period of 7 calendar days, preventing excessive time value decay.
How long have Risk Range™ signals been published?
Hedgeye's Risk Ranges™ Signals have been published daily since 2015.
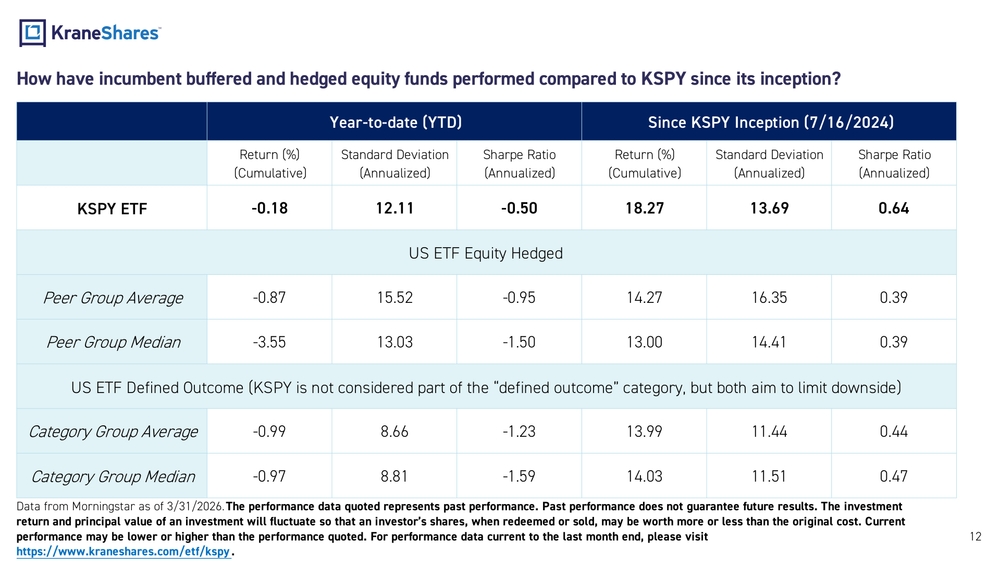
How have incumbent buffered and hedged equity funds performed compared to KSPY since its inception?
Year-to-date (YTD)
| Return (%) (Cumulative) | Standard Deviation (Annualized) | Sharpe Ratio (Annualized) | |
|---|---|---|---|
| KSPY ETF | -0.18 | 12.11 | -0.50 |
| US ETF Equity Hedged Peer Group Average | -0.87 | 15.52 | -0.95 |
| US ETF Equity Hedged Peer Group Median | -3.55 | 13.03 | -1.50 |
| US ETF Defined Outcome Category Group Average | -0.99 | 8.66 | -1.23 |
| US ETF Defined Outcome Category Group Median | -0.97 | 8.81 | -1.59 |
Since KSPY Inception (7/16/2024)
| Return (%) (Cumulative) | Standard Deviation (Annualized) | Sharpe Ratio (Annualized) | |
|---|---|---|---|
| KSPY ETF | 18.27 | 13.69 | 0.64 |
| US ETF Equity Hedged Peer Group Average | 14.27 | 16.35 | 0.39 |
| US ETF Equity Hedged Peer Group Median | 13.00 | 14.41 | 0.39 |
| US ETF Defined Outcome Category Group Average | 13.99 | 11.44 | 0.44 |
| US ETF Defined Outcome Category Group Median | 14.03 | 11.51 | 0.47 |
US ETF Defined Outcome (KSPY is not considered part of the "defined outcome" category, but both aim to limit downside)
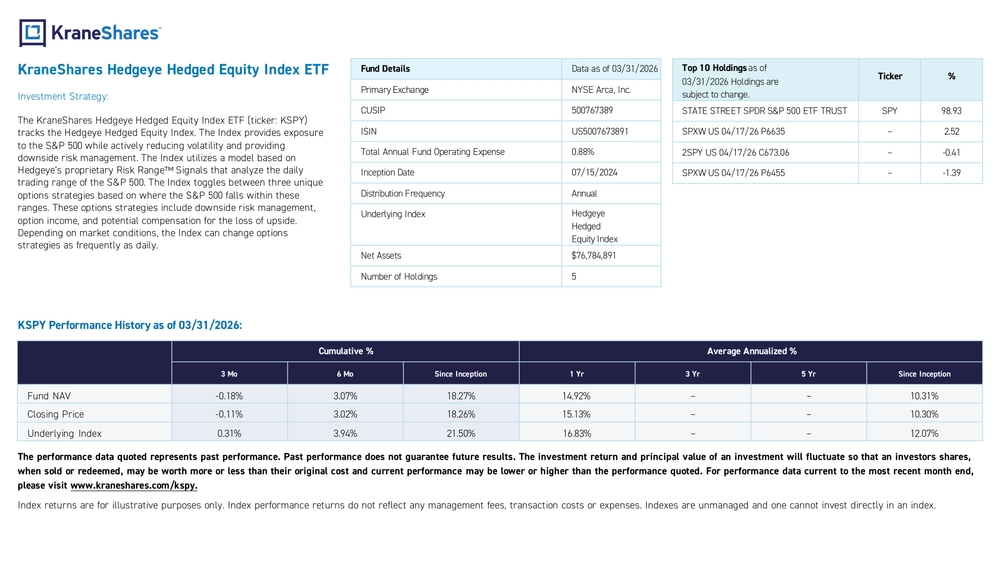
KraneShares Hedgeye Hedged Equity Index ETF
Investment Strategy:
The KraneShares Hedgeye Hedged Equity Index ETF (ticker: KSPY) tracks the Hedgeye Hedged Equity Index. The Index provides exposure to the S&P 500 while actively reducing volatility and providing downside risk management. The Index utilizes a model based on Hedgeye's proprietary Risk Range™ Signals that analyze the daily trading range of the S&P 500. The Index toggles between three unique options strategies based on where the S&P 500 falls within these ranges. These options strategies include downside risk management, option income, and potential compensation for the loss of upside. Depending on market conditions, the Index can change options strategies as frequently as daily.
Fund Details (Data as of 03/31/2026)
| Detail | Value |
|---|---|
| Primary Exchange | NYSE Arca, Inc. |
| CUSIP | 500767389 |
| ISIN | US5007673891 |
| Total Annual Fund Operating Expense | 0.88% |
| Inception Date | 07/15/2024 |
| Distribution Frequency | Annual |
| Underlying Index | Hedgeye Hedged Equity Index |
| Net Assets | $76,784,891 |
| Number of Holdings | 5 |
Top 10 Holdings as of 03/31/2026
| Ticker | % |
|---|---|
| STATE STREET SPDR S&P 500 ETF TRUST (SPY) | 98.93 |
| SPXW US 04/17/26 P6635 | 2.52 |
| 2SPY US 04/17/26 C673.06 | -0.41 |
| SPXW US 04/17/26 P6455 | -1.39 |
KSPY Performance History as of 03/31/2026
| 3 Mo | 6 Mo | Since Inception | 1 Yr | 3 Yr | 5 Yr | Since Inception (Ann.) | |
|---|---|---|---|---|---|---|---|
| Fund NAV | -0.18% | 3.07% | 18.27% | 14.92% | – | – | 10.31% |
| Closing Price | -0.11% | 3.02% | 18.26% | 15.13% | – | – | 10.30% |
| Underlying Index | 0.31% | 3.94% | 21.50% | 16.83% | – | – | 12.07% |
KraneShares
Empowering investors with access to the world's most powerful growth themes through ETFs, private strategies, and innovative investment solutions.
Introduction to Hedgeye Asset Management
Hedgeye Asset Management, LLC ("HAM") is a subsidiary of Hedgeye Risk Management, LLC ("Hedgeye" or "HRM") that develops and provides indices and model portfolios based on the intellectual property of Hedgeye, for use in investment products and portfolio services offered by registered investment advisers, investment funds (including exchange traded funds) and other trading systems. Hedgeye distinguishes itself by democratizing access to investment research typically reserved for institutional investors. Their team of over 40 analysts leverages a proven macro research process to discern key market trends and make decisive directional calls. Hedgeye prioritizes transparency and fosters a client-centric approach, empowering investors with the tools to navigate market volatility and prioritize risk management strategies.
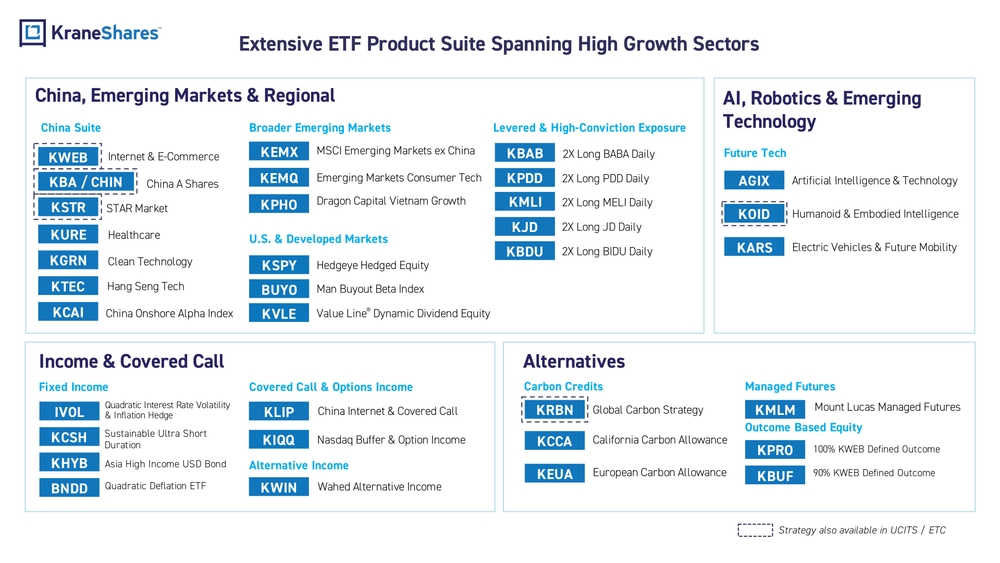
Extensive ETF Product Suite Spanning High Growth Sectors
China, Emerging Markets & Regional
China Suite
- KWEB – Internet & E-Commerce
- KBA / CHIN – China A Shares
- KSTR – STAR Market
- KURE – Healthcare
- KGRN – Clean Technology
- KTEC – Hang Seng Tech
- KCAI – China Onshore Alpha Index
Broader Emerging Markets
- KEMX – MSCI Emerging Markets ex China
- KEMQ – Emerging Markets Consumer Tech
- KPHO – Dragon Capital Vietnam Growth
Levered & High-Conviction Exposure
- KBAB – 2X Long BABA Daily
- KPDD – 2X Long PDD Daily
- KMLI – 2X Long MELI Daily
- KJD – 2X Long JD Daily
- KBDU – 2X Long BIDU Daily
U.S. & Developed Markets
- KSPY – Hedgeye Hedged Equity
- BUYO – Man Buyout Beta Index
- KVLE – Value Line® Dynamic Dividend Equity
AI, Robotics & Emerging Technology
Future Tech
- AGIX – Artificial Intelligence & Technology
- KOID – Humanoid & Embodied Intelligence
- KARS – Electric Vehicles & Future Mobility
Income & Covered Call
Fixed Income
- IVOL – Quadratic Interest Rate Volatility & Inflation Hedge
- KCSH – Sustainable Ultra Short Duration
- KHYB – Asia High Income USD Bond
- BNDD – Quadratic Deflation ETF
Covered Call & Options Income
- KLIP – China Internet & Covered Call
- KIQQ – Nasdaq Buffer & Option Income
Alternative Income
- KWIN – Wahed Alternative Income
Alternatives
Carbon Credits
- KRBN – Global Carbon Strategy
- KCCA – California Carbon Allowance
- KEUA – European Carbon Allowance
Managed Futures
- KMLM – Mount Lucas Managed Futures
Outcome Based Equity
- KPRO – 100% KWEB Defined Outcome
- KBUF – 90% KWEB Defined Outcome
Strategy also available in UCITS / ETC
Definitions
Long: A long option is a financial contract that gives the holder the right to buy or sell an underlying asset by a specific date, but not the obligation. The holder can pay a premium to be long, which means they own the contract. The opposite of a long position is a short position, where the holder receives a premium to be short.
Short: A short option, also known as shorting an option, is a trading strategy that involves selling an option contract. The trader who sells the option is obligated to buy or sell the underlying security by the time the option expires or is bought back. Short options can be used to make directional bets on price movement or to mitigate risks associated with specific events.
Last Price Minus RR Width: The last price of the S&P 500 Index minus the numerical value of the width of the risk ranges, which is found by subtracting the price of the top risk range from the bottom risk range.
Sell Risk Range: The target sell price level for option strike selection.
Last Price: In the stock market, the last price is the most recent price for a security, usually the price of the last trade or the previous close price. It can also be an estimate. The last price is one of several factors to consider when buying or selling shares.
Buy Risk Range: The target buy price level for option strike selection.
Within Risk Range: The target price level for option strike selection when the S&P 500 Index price is within Hedgeye's Risk Range™ Signals.
S&P 500 Index: The S&P 500 Index is widely regarded as the best single gauge of large-cap U.S. equities. There is over USD 9.9 trillion indexed or benchmarked to the index, with indexed assets comprising approximately USD 3.4 trillion of this total. The index includes 500 leading companies and covers approximately 80% of available market capitalization. The index was launched on March 4, 1957.
Definitions
SPX Index Volatility 30d: The 30-day volatility of the S&P 500 Index (SPX), often measured as the annualized standard deviation of daily returns over the past 30 days.
Standard deviation: Standard deviation is a statistical measure of the dispersion or variability of a set of values relative to their mean. In finance, it is commonly used to quantify the risk or volatility of an asset or portfolio—higher standard deviation indicates greater variability in returns, while lower standard deviation means returns are more consistent.
Sharpe ratio: The Sharpe ratio is a measure of risk-adjusted return. It compares the excess return of an investment (the return above a risk-free rate) to its standard deviation (volatility).
US ETF Equity Hedged: A US ETF equity hedged strategy involves an exchange-traded fund (ETF) that invests in US equities (stocks) while also employing hedging techniques to reduce downside risk.
US ETF Defined Outcome: A US ETF defined outcome is an ETF structured to provide investors with a predetermined range of potential returns (both upside and downside) over a specific period, such as one year.
Important Notes
Carefully consider the Funds' investment objectives, risk factors, charges and expenses before investing. This and additional information can be found in the Funds' full and summary prospectus, which may be obtained by visiting https://www.kraneshares.com/kspy. Read the prospectus carefully before investing.
Risk Disclosures:
Investing involves risk, including possible loss of principal. There can be no assurance that a Fund will achieve its stated objectives. Indices are unmanaged and do not include the effect of fees. One cannot invest directly in an index.
This information should not be relied upon as research, investment advice, or a recommendation regarding any products, strategies, or any security in particular. This material is strictly for illustrative, educational, or informational purposes and is subject to change.
KSPY may invest in derivatives, which are often more volatile than other investments and may magnify KSPY's gains or losses. A derivative (i.e., futures/forward contracts, swaps, and options) is a contract that derives its value from the performance of an underlying asset. The primary risk of derivatives is that changes in the asset's market value and the derivative may not be proportionate, and some derivatives can have the potential for unlimited losses. Derivatives are also subject to liquidity and counterparty risk.
KSPY is subject to liquidity risk, meaning that certain investments may become difficult to purchase or sell at a reasonable time and price. Counterparty risk is the risk of loss in the event that the counterparty to an agreement fails to make required payments or otherwise comply with the terms of the derivative. Hedges may have imperfect matching between the derivative and the underlying security; there is no assurance that hedging will be effective.
The Fund will use FLEX options from the Options Clearing Corporation (OCC). There's a risk of the OCC failing to meet its obligations. The Fund may face challenges in less liquid FLEX options markets and have difficulty closing positions at desired times and prices.
Hedgeye Risk Management, LLC's ("HRM") ability to publish daily Risk Range™ signals is heavily dependent on the manual activities of a single individual, HRM's CEO and founder ("Key Man"). In Key Man's absence, the Risk Range™ signals will be published by another individual ("Secondary Calculator"). If the Key Man were to leave HRM or is unable to calculate the Risk Range™ signals, the Risk Range™ signals and the Underlying Index may not function as designed and adversely impact KSPY.
Risk Disclosures Continued:
KSPY is new and does not yet have a significant number of shares outstanding. If KSPY does not grow in size, it will be at greater risk than larger funds of wider bid-ask spreads for its shares, trading at a greater premium or discount to NAV, liquidation and/or a trading halt. Narrowly focused investments typically exhibit higher volatility. KSPY's assets are expected to be concentrated in a sector, industry, market, or group of concentrations to the extent that the Underlying Index has such concentrations. The securities or futures in that concentration could react similarly to market developments. Thus, KSPY is subject to loss due to adverse occurrences that affect that concentration.
Large capitalization companies may struggle to adapt fast, impacting their growth compared to smaller firms, especially in expansive times. This could result in lower stock returns than investing in smaller and mid-sized companies. KSPY is non-diversified.
ETF shares are bought and sold on an exchange at market price (not NAV) and are not individually redeemed from the Fund. However, shares may be redeemed at NAV directly by certain authorized broker-dealers (Authorized Participants) in very large creation/redemption units. The returns shown do not represent the returns you would receive if you traded shares at other times. Shares may trade at a premium or discount to their NAV in the secondary market. Brokerage commissions will reduce returns. Beginning 12/23/2020, market price returns are based on the official closing price of an ETF share or, if the official closing price isn't available, the midpoint between the national best bid and national best offer ("NBBO") as of the time the ETF calculates the current NAV per share. Prior to that date, market price returns were based on the midpoint between the Bid and Ask price. NAVs are calculated using prices as of 4:00 PM Eastern Time.
The KraneShares ETFs and KFA Funds ETFs are distributed by SEI Investments Distribution Company (SIDCO), 1 Freedom Valley Drive, Oaks, PA 19456, which is not affiliated with Krane Funds Advisors, LLC, the Investment Adviser for the Funds, or any sub-advisers for the Fund.
Index Provider Disclaimers:
The Hedgeye® Hedged Equity Index (the "Index") is a product of HAM which has contracted with S&P Opco, LLC (a subsidiary of S&P Dow Jones Indices LLC) ("SPDJI") to license the S&P 500 Index in connection with the Index. The S&P 500 Index, S&P®, S&P 500®, the 500, US 500 are the property of SPDJI and/or its affiliates ("S&P Dow Jones Indices") and/or their third party licensors. S&P®, S&P 500®, the 500, US 500 are registered trademarks of S&P Global Inc. and/or its affiliates, Dow Jones® is a registered trademark of Dow Jones Trademark Holdings LLC ("Dow Jones"); and these trademarks have been licensed to S&P Dow Jones Indices and have been sublicensed for use for certain purposes by HAM. S&P Dow Jones Indices and its third party licensors shall have no liability for any errors or omissions in the S&P 500 Index and the Index is not owned, endorsed, or approved by or associated with S&P Dow Jones Indices.
The Fund is based on the Index and is not sponsored, endorsed, sold or promoted by S&P Dow Jones Indices or its third party licensors. Neither S&P Dow Jones Indices nor its third party licensors make any representation or warranty, express or implied, to the owners of the Fund or any member of the public regarding the advisability of investing in securities generally or in the Fund particularly or the ability of the Index and/or the S&P 500 Index to track general market performance. S&P Dow Jones Indices' only relationship to Hedgeye Asset Management, LLC with respect to the Index is the licensing of the S&P 500 Index and certain trademarks, service marks and trade names of S&P Dow Jones Indices or its third party licensors. S&P Dow Jones Indices and its third party licensors are not responsible for and have not participated in the determination of the prices and amount of the Fund or the timing of the issuance or sale of the Fund or in the determination or calculation of the equation by which the Fund may convert into cash or other redemption mechanics. S&P Dow Jones Indices and its third party licensors have no obligation or liability in connection with the administration, marketing or trading of the Fund. There is no assurance that investment products based on the Index will accurately track index performance or provide positive investment returns. S&P Dow Jones Indices LLC is not an investment adviser, commodity trading advisory, commodity pool operator, broker dealer, fiduciary, "promoter" (as defined in the Investment Company Act of 1940, as amended), "expert" as enumerated within 15 U.S.C. § 77k(a) or tax advisor. Inclusion of a security, commodity, crypto currency or other asset within an index is not a recommendation by S&P Dow Jones Indices to buy, sell, or hold such security, commodity, crypto currency or other asset, nor is it considered to be investment advice or commodity trading advice.
Index Provider Disclaimers Continued:
NONE OF S&P DOW JONES INDICES, ITS THIRD PARTY LICENSORS, HEDGEYE OR KRANE GUARANTEES THE ADEQUACY, ACCURACY, TIMELINESS AND/OR THE COMPLETENESS OF THE S&P 500 INDEX, THE INDEX OR ANY DATA RELATED THERETO OR ANY COMMUNICATION, INCLUDING BUT NOT LIMITED TO, ORAL OR WRITTEN COMMUNICATION (INCLUDING ELECTRONIC COMMUNICATIONS) WITH RESPECT THERETO. S&P DOW JONES INDICES AND ITS THIRD PARTY LICENSORS SHALL NOT BE SUBJECT TO ANY DAMAGES OR LIABILITY FOR ANY ERRORS, OMISSIONS, OR DELAYS THEREIN. S&P DOW JONES INDICES AND ITS THIRD PARTY LICENSORS MAKES NO EXPRESS OR IMPLIED WARRANTIES, AND EXPRESSLY DISCLAIMS ALL WARRANTIES, OF MERCHANTABILITY OR FITNESS FOR A PARTICULAR PURPOSE OR USE OR AS TO RESULTS TO BE OBTAINED BY HEDGEYE, OWNERS OF THE HEDGEYE HEDGED EQUITY ETF, OR ANY OTHER PERSON OR ENTITY FROM THE USE OF THE S&P 500 INDEX, INDEX OR WITH RESPECT TO ANY DATA RELATED THERETO. WITHOUT LIMITING ANY OF THE FOREGOING, IN NO EVENT WHATSOEVER SHALL S&P DOW JONES INDICES OR ITS THIRD PARTY LICENSORS BE LIABLE FOR ANY INDIRECT, SPECIAL, INCIDENTAL, PUNITIVE, OR CONSEQUENTIAL DAMAGES INCLUDING BUT NOT LIMITED TO, LOSS OF PROFITS, TRADING LOSSES, LOST TIME OR GOODWILL, EVEN IF THEY HAVE BEEN ADVISED OF THE POSSIBILITY OF SUCH DAMAGES, WHETHER IN CONTRACT, TORT, STRICT LIABILITY, OR OTHERWISE. S&P DOW JONES INDICES HAS NOT REVIEWED, PREPARED AND/OR CERTIFIED ANY PORTION OF, NOR DOES S&P DOW JONES INDICES HAVE ANY CONTROL OVER, THE LICENSEE PRODUCT REGISTRATION STATEMENT, PROSPECTUS OR OTHER OFFERING MATERIALS. THERE ARE NO THIRD-PARTY BENEFICIARIES OF ANY AGREEMENTS OR ARRANGEMENTS BETWEEN S&P DOW JONES INDICES AND HEDGEYE, OTHER THAN THE LICENSORS OF S&P DOW JONES INDICES."
Hedgeye Asset Management, LLC ("HAM") is not affiliated with the Trust, Krane, the Trust's administrator, custodian, transfer agent or Distributor, or any of their respective affiliates. Krane and HAM have entered into an index provider agreement (the "Agreement") pursuant to which HAM has licensed the exclusive use of the Index and certain related marks to Krane for a fee, and Krane is permitted to sublicense such rights to the Fund and uses the marks for the purpose of promoting and marketing the Fund. Under the Agreement, HAM is compensated, in part, on the asset size of the Fund and therefore benefits directly from investments in the Fund. HAM is a subsidiary of HRM. HRM provides Hedgeye Risk Range™ signals to HAM under a licensing agreement. As such, HRM benefits directly from investments in the Fund.
The Fund is not in any way advised, managed, sponsored, endorsed, sold or promoted by HAM or HRM, and neither HAM nor HRM make any claim, prediction, warranty or representation whatsoever, expressly or impliedly, either as to (i) the results to be obtained from the use of the Index, (ii) the performance or price of the Index at any particular time on any particular day or otherwise, or (iii) the merchantability, fitness or suitability of the Index for the particular purpose to which it is being put in connection with the Fund. Neither HAM nor HRM has provided, nor do they provide, any financial or investment advice or recommendation in relation to the Index to Krane or its affiliates, including the Fund. All rights in the Index vest in HAM other than those licensed to Krane under the Agreement.
Index Provider Disclaimers Continued:
Neither HAM nor HRM makes any warranty, express or implied, as to results to be obtained by Krane or its affiliates, owners of shares of the Fund or any other person or entity from the use of the Index or any data included therein. Without limiting any of the foregoing, in no event shall HAM or HRM have any liability for any special, punitive, indirect or consequential damages (including lost profits) resulting from the use of the Index or any data included therein, even if notified of the possibility of such damages.
HRM sells financial research to financial institutions and investors, including the Hedgeye Risk Range™ signals which are a critical input of the Index provided to the Fund by HRM subsidiary, HAM. HRM publishes Hedgeye Risk Range™ signals direct to its subscribers who will receive the Risk Range™ signals before the Fund due to processing time between publication and receipt of the Risk Range™ signals by the Fund.
Solactive AG ("Solactive") is the calculation agent of the Index. The financial instrument that is referencing the Index is not sponsored, endorsed, promoted, sold or supported by Solactive in any way and Solactive makes no express or implied representation, guarantee or assurance with regard to: (a) the advisability in investing in the financial instruments; (b) the quality, accuracy and/or completeness of the Index; and/or (c) the results obtained or to be obtained by any person or entity from the use of the Index. Solactive does not guarantee the accuracy and/or the completeness of the Index and shall not have any liability for any errors or omissions with respect thereto."