2026_Q2_krbn_report
by Kraneshares
KRBN SUMMER REPORT Carbon’s Next Wave: Policy Tailwinds & AI Data Center Demand Drive a Broad Market Resurgence
2 info@kraneshares.com +1 (212) 933 0393 www.kraneshares.com Back to top ↑ Table of Contents
Carbon Investment Thesis & Performance Tables 3-4 Introduction & Global Carbon Market Highlights 5 EUAs Move Through Geopolitical Shocks, Market Reform on the Horizon 6-9 CCAs Up 14% in Q2 As Reform Package is Set for implementation September 9-13 RGAs Returned 52% in Q2 Driven by Virginia’s Re -entry 13-15 UKAs Up 18% in Q2 with Linkage Trade Still the Key Driver 15-18 WCAs Were Down 16% in Q2 as Linking with WCI Now in Prospect for 2028 18-19 Compliance Market Modeling & Correlations 19-23 Definitions & Disclosures 25-27
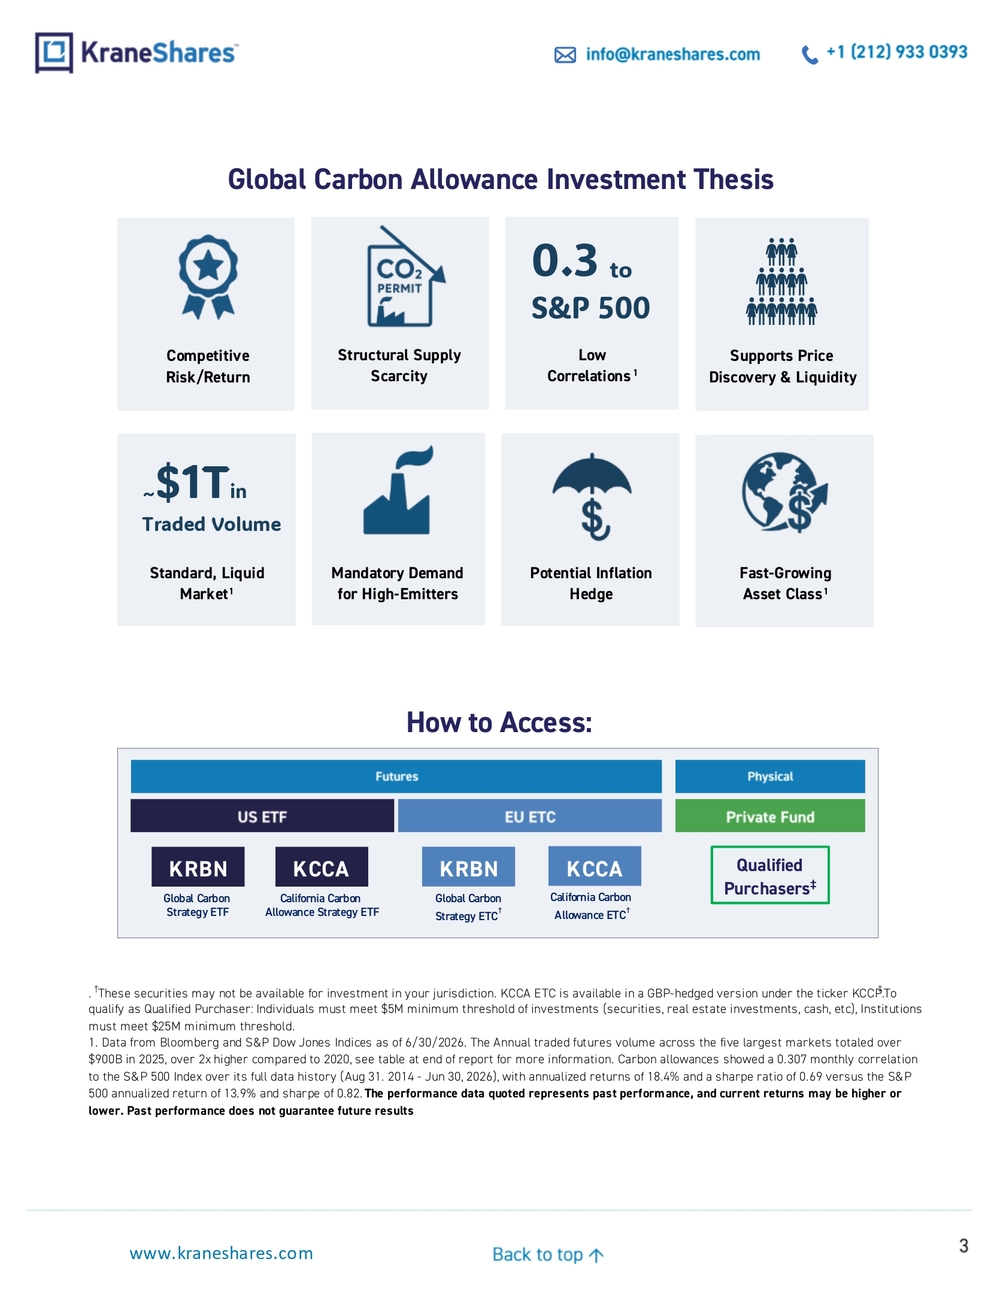
3 info@kraneshares.com +1 (212) 933 0393 www.kraneshares.com Back to top ↑ Global Carbon Allowance Investment Thesis . †These securities may not be available for investment in your jurisdiction. KCCA ETC is av ailable in a GBP-hedged version under the ticker KCCP. ‡ To qualify as Qualified Purchaser: Individuals must meet $5M minimum threshold of investments (securities, real estate inves tments, cash, etc), Institutions must meet $25M minimum threshold.
- Data from Bloomberg and S&P Dow Jones Indices as of 6/30/2026. The Annual traded futures volume across the five largest markets totaled over $900B in 2025 , over 2x higher compared to 2020 , see table at end of report for more information. Carbon allowances showed a 0.307 monthly correlation to the S&P 500 Index over its full data history (Aug 31. 2014 - Jun 30 , 2026) , with annualized returns of 18.4% and a sharpe ratio of 0.69 versus the S &P 500 annualized return of 1 3.9% and sharpe of 0.82. The performance data quoted represents past performance, and current returns may be higher or lower. Past performance does not guarantee future results How to Access : Competitive Risk/Return Structural Supply Scarcity Low Correlations1 0.3 to S&P 500 Mandatory Demand for High -Emitters Supports Price Discovery & Liquidity Fast-Growing Asset Class1 Standard, Liquid Market1 ~$1T in Traded Volume Potential Inflation Hedge KRBN Global C arbon Strategy ETF California Carbon Allowance Strategy ETF Global Carbon Strategy ETC† KCCA KRBN KCCA California Carbon Allowance ETC† Futures Physical US ETF EU ETC Private Fund Qualified Purchasers‡
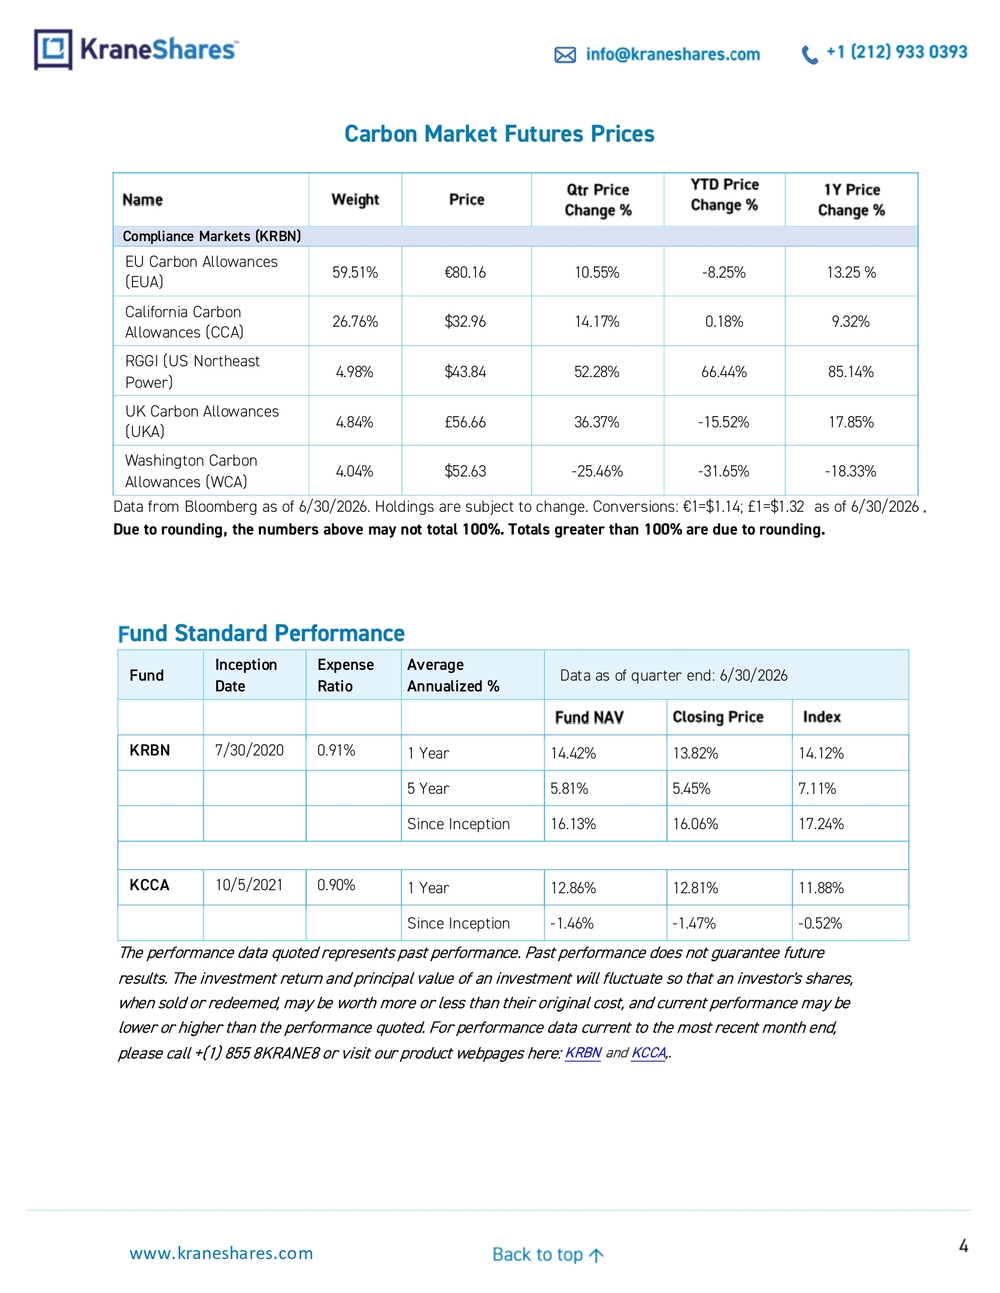
4 info@kranesh ares.com +1 (212) 933 0393 www.kraneshares.com Back to top ↑ Carbon Market Futures Prices
Fund Standard Performance Fund Inception Date Expense Ratio Average Annualized % Data as of quarter end: 6/30/202 6
Fund NAV Closing Price Index KRBN 7/30/2020 0.91% 1 Year 14.42 % 13.82% 14.12 % 5 Year 5.81% 5.45% 7.11% Since Inception 16.13% 16.06% 17.24%
KCCA 10/5/2021 0.90% 1 Year 12.86% 12.81 % 11.88 % Since Inception -1.46% -1.47% -0.52% The performance data quoted represents past performance. Past performance does not guarantee future results. The investment return and principal value of an investment will fluctuate so that an investor 's shares, when sold or redeemed, may be worth more or less than their original cost, and current performance may be lower or higher than the performance quoted. For performance data current to the most recent month end, please call +(1) 855 8KRANE8 or visit our product webpages here: KRBN and KCCA ,. Name Weight Price Q tr Price Change % YTD Price Change % 1Y Price Change % Compliance Markets (KRBN) EU Carbon Allowances (EUA) 59.51% €80.16 10.55 % -8.25% 13.25 % California Carbon Allowances (CCA) 26.76% $32.96 14.17 % 0.18% 9.32% RGGI (U S Northeast Power) 4.98% $43.84 52.28% 66.44% 85.14% UK Carbon Allowances (UKA) 4.84% £56.66 36.37% -15.52% 17.85% Washington Carbon Allowances (WCA) 4.04% $52.63 -25.46% -31.65 % -18.33% Data from Bloomberg as of 6/30/202 6. Holdings are subject to chang e. Conversions: €1=$1.14; £1=$ 1.32 as of 6/30/202 6 . Due to rounding, the numbers above may not total 100%. Totals greater than 100% are due to rounding.
5 info@kraneshares.com +1 (212) 933 0393 www.kraneshares.com Back to top ↑ KRBN: KraneShares Global Carbon Strategy ETF The AI -driven data -center boom emerged as a major theme for carbon markets in Q2, with the Northeastern US carbon market (RGGI) emerging as the standout performer. RGGI surged on news that Virginia, a major global data-center hub, would reenter the program on July 1, bringing rapidly growi ng power demand and emissions into the market. European allowances recovered most of their Q1 losses ahead of the European Commission’s long -awaited EU Emission Trading System ( ETS) Review, published July 17, while UK allowances tracked Europe higher as momentum toward UK -EU linking continued to build. In California, the regulator's approval of its cap -and-invest reform package removed a major overhang that had weighed on the market for nearly two years, clearing the way for implementation as soon as Septem ber 1. Overall, KRBN returned 12.5% in Q2, with four of its five underlying markets posting gains. In this Summer 2026 Carbon Quarterly Commentary, we examine the key market dynamics, policy developments, and structural trends driving performance across the five carbon ma rkets represented in the KraneShares Global Carbon Strategy ETF (KRBN) .
Global Carbon Highlights:
• European Union carbon allowances (EUAs) hit six -month high after EU Commission published its EU -ETS Review package on July 17 • Califor nia carbon allowances (CCAs) rallied on the Board approval of its cap -and-invest reform package in late May with implementation expected in September • Washington state carbon allowances (WCA) officially signed off on the linkage agreement with the California -Quebec joint Western Climate Initiative • UK carbon allowances (UKAs) tracked EUAs higher, with linking momentum reinforced by the UK’s decision to scrap its Carbon Price Support mechanisms from 2028 • Regional Greenhouse Gas Initiative (RGGI) surged on Virg inia’s formal readmission into the program, bringing rapidly growing power demand and emissions into the market
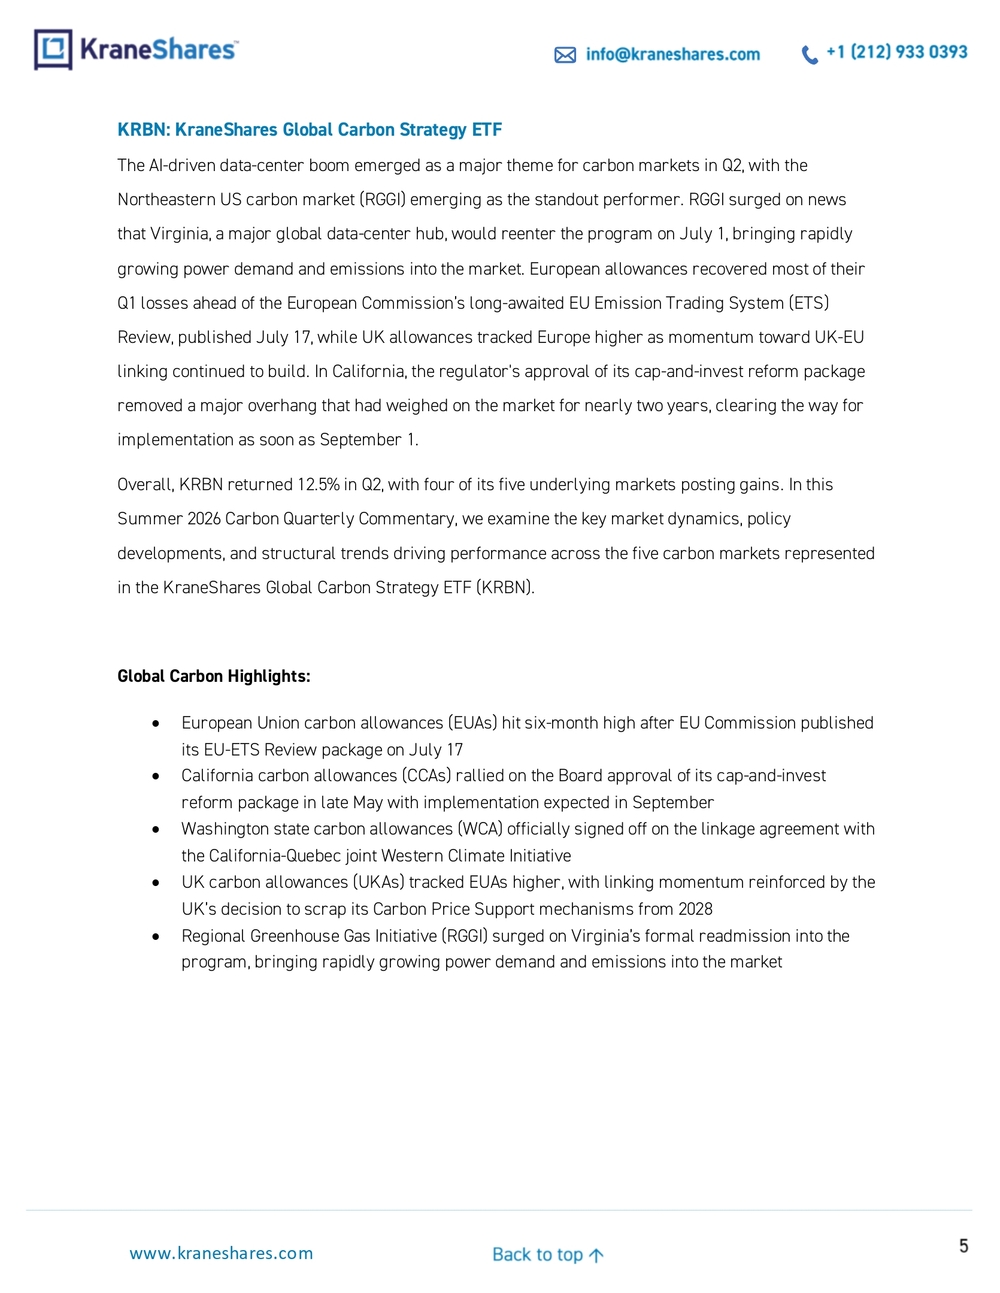
6 info@kraneshares.com +1 (212) 933 0393 www.kraneshares.com Back to top ↑ KraneShares Carbon Sui te Quarterly Commentary EUAs Move Through Geopolitical Shocks, Market Reform on the Horizon European Union allowances (E UA) futures , (59.51 % of KRBN ) settled on 30 June at €80.2/t, up 11 % from the €72.5/t level at which it closed on March 31. With the USD ending Q2 slightly up against the Euro, EUAs were up 9% in USD terms over the course of the second quarter . Figure 1 shows the price evolution of the Front -Dec EUA cont ract in H1 and through the end of July. For the first half as a whole, EUAs were down 8% (11% in USD terms), and as of the end of July on a year-to-date ( YTD) basis EUAs were down 7% (9% in USD terms). Figure 1: EUA Dec -26 contract, January 1 - July 31 , 202 6 (€/t)
Source: Bloomberg EUAs staged a robust rebound in Q2, recovering from the volatility driven by geopolitical and policy uncertainty earlier in the year. The turning point in fact was the EU Council meeting on March 19 , which ended with a more pos itive outcome than the market had feared regarding the signposts for the EU -ETS Review that was to be published in July. After hitting its YTD settlement low of €63.7/t on March 19, the Dec -26 EUA contract rebounded sharply on March 20, as the outcome of t he Council meeting was viewed as more €87.4 €92.2 €63.7 €72.5 €80.16 €81.26 € 60 € 65 € 70 € 75 € 80 € 85 € 90 € 95 Jan-26 Feb-26 Mar-26 Apr-26 May-26 Jun-26 Jul-26
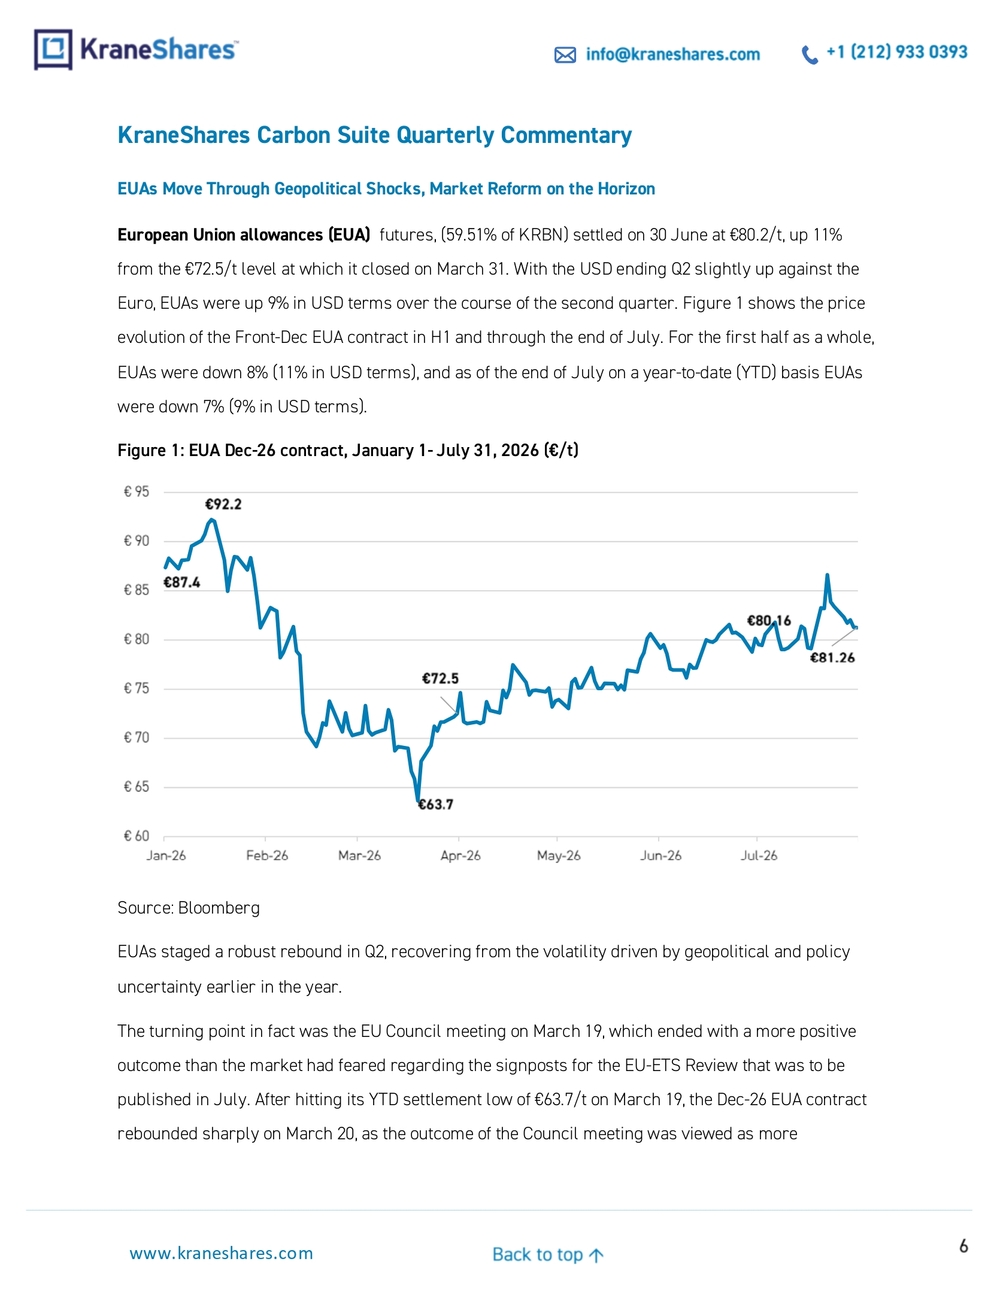
7 info@kraneshares.com +1 (212) 933 0393 www.kraneshares.com Back to top ↑ consistent with the recommendations of EU policymakers and officials than with the more populist positions advocated by leaders of certain EU member states in the days and weeks leading up to the summit. Concerns over the impact of the US/Iran conflict were also at their peak in mid -March owing to the impact on EU natural -gas prices of shipping disruptions through the Strait of Hormuz and damage to Quatari Liquefied natural gas (LNG) facilities. The benchmark front -month EU natural -gas price at the Title Transfer facility (TTF) hub in the Netherlands closed at €32/MWh on Friday , February 27 before hostilities began, but then rose 70% over the next two trading days (March 2-3) as the market digested the war’s implicatio ns for the supply of natural gas out of the Strait of Hormuz and hence the impact on the EU’s large volumes of imported LNG (Figure 2). Figure 2: Dec -26 EUAs (€/t, LHS) versus front -month TTF (€/MWh, RHS), 1 January -31 July 2026
Source: ICE EUAs and T TF have been inversely correlated all the way back from the beginning of 2025, reflecting the decline of the so -called fuel -switching price as a proxy for EUAs (a function of lower hedging volumes in the power sector), and the emergence of TTF prices as a barometer for the degree of political pressure that is brought to bear on the EU -ETS whenever TTF prices go above €50/MWh. This inverse correlation between EUAs and TTF is particularly visible in Figure 2. € 25 € 30 € 35 € 40 € 45 € 50 € 55 € 60 € 65 € 70 € 60 € 65 € 70 € 75 € 80 € 85 € 90 € 95 Jan-26 Feb-26 Mar-26 Apr-26 May-26 Jun-26 Jul-26 Front Month TTF Gas Front
Dec EUA Price Front-Dec EUA Front Month TTF Gas
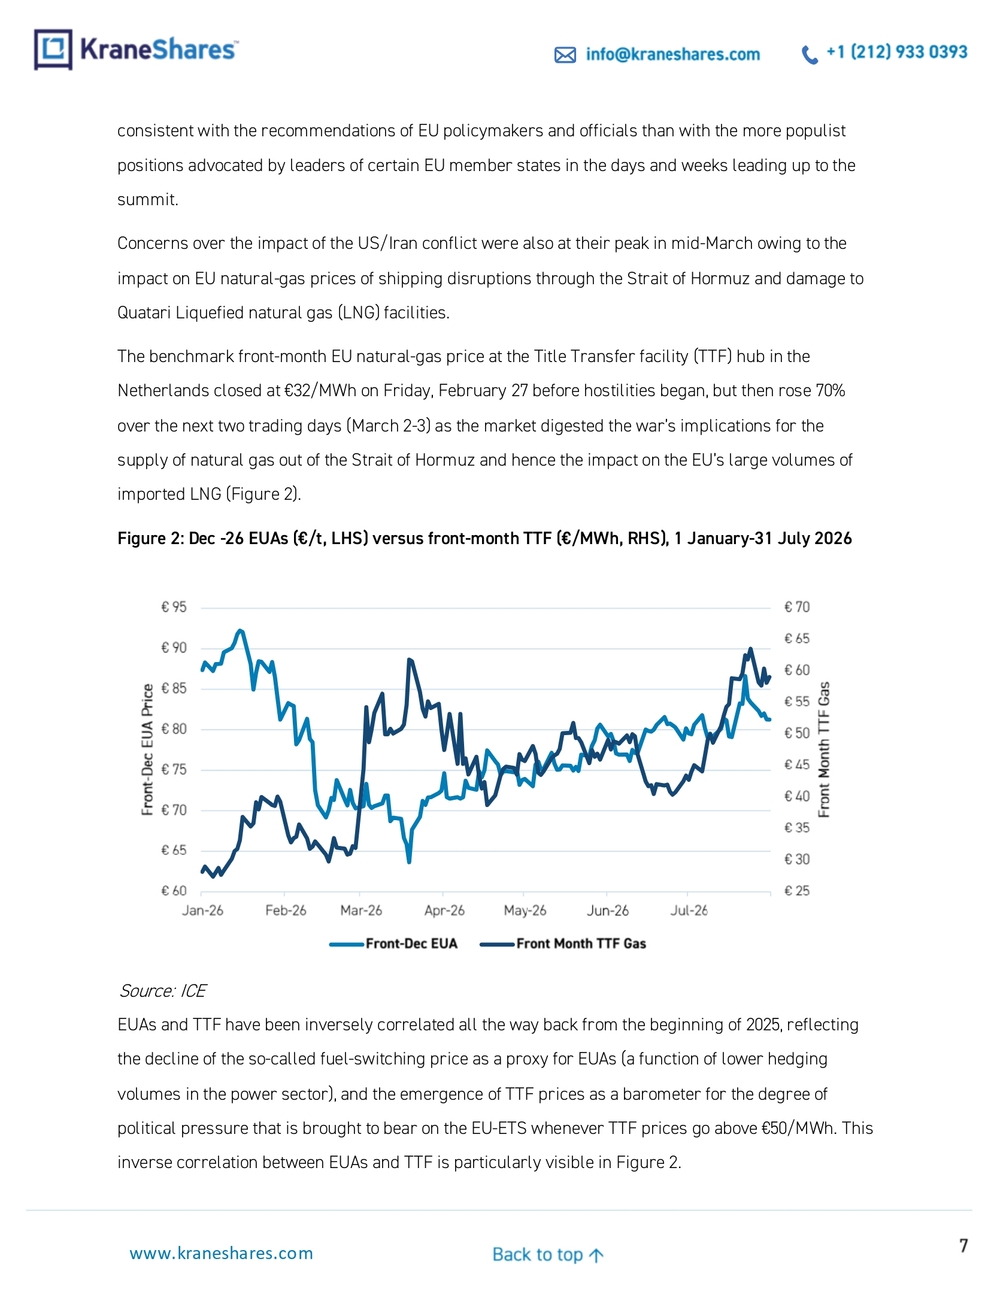
8 info@kraneshares.com +1 (212) 933 0393 www.kraneshares.com Back to top ↑ With the war between the US and Iran in a state o f fragile ceasefire since April 8 and hopes for a return to some kind of normality regarding the passage of seaborne energy supplies therefore raised, TTF fell from its highs of mid -March and traded in a €40 -50/MWh range for most of Q2, just below the political pain threshold. This helped EUAs recover through Q2, although with the breakdown of the ceasefire and resumption of kinetic hostilities in early July TTF rose sharply over the rest of the month, posting a YTD settlement high of €63.6/MWh on July 24 a nd bringing EUAs off their six -month high of €86.6/t posted on July 22. Speculative positioning in EUAs recovered in Q2 after falling spectacularly in Q1 (Figure 3). Net speculative length fell by 50% from the 126Mt all-time-high ( ATH) of the week ending J anuary 16 to bottom out at its YTD low of 32Mt for the week ending March 27. Positioning then increased steadily again over Q2 as the market took encouragement from the outcome of the EU Council meeting and the (albeit fragile) ceasefire in the conflict wi th Iran. Positioning in Q2 peaked at 62Mt for the week ending June 26 when investors started trimming their holdings ahead of the EU -ETS Review. Figure 3: Net Positioning of Investment Funds in EUAs, January 1 2026 —July 24 2026 (Kt)
Source: ICE The Euro pean Commission’s EU -ETS Review package itself was released on July 17, with EUAs rising by as much as 10% in the days that followed to settle at a six -month high of €86.6/t on July 22 (the highest close since January 27) before trending back down to close out July at €81.3/t. We think the positive reaction was in response to the conditionality attached to much of the supply in the Commission’s package. 0 20,000 40,000 60,000 80,000 100,000 120,000 140,000 160,000 January-26 February-26 March-26 April-26 May-26 June-26 July-26 Funds Total Long Funds Total Short Funds Net Position
9 info@kraneshares.com +1 (212) 933 0393 www.kraneshares.com Back to top ↑ As explained in our two recent blog posts on the Commission’s package (see here for our detailed analysis of the Review’s implications for the balances over 2026 -30, and here for our analysis of the implications over 2031 -40), the conditionality relates to commitments from EU industry to make investments in decarbonization. As we argued in these blog posts, this conditionality is constructive for EUA prices through 2030 and be yond, as it means a significant chunk of supply will be withheld until new investments are made and emissions reductions from these new investments have been demonstrated. With the EU now entering the peak summer -holiday period and Brussels essentially shutting down for the whole of August, we do not expect any further policy developments until September, when the EU Council (the body that represents EU member -state governments) and the EU Parliame nt will start formalizing their responses to the Commission’s package. We would then expect greater volatility in September and into Q4 as the trilogue negotiations on the EU -ETS review between the Commission, Council, and Parliament get serious.
CCAs up 14% in Q2 as Reform Package is Set for implementation in September California Carbon Allowances (CCAs) (26.76% of KRBN) settled on June 30 at 32.96/t, up 14% from the €28.9/t level at which it closed on March 31. Figure 4 shows the price evolution of the Front -Dec CCA contract in H1 and through July 31. For both the first half as a whole and YTD as of July 31, CCAs were flat against the 32.96/t level at which they ended 2025.
10 info@kraneshares.com +1 (212) 933 0393 www.kraneshares.com Back to top ↑ Figure 4: CCA Dec -26 contract, January 1, 202 5 - July 31 2026 ($/t)
Source: Bloomberg CCAs rebounded strongly in Q2 on improved regulatory clarity, with the key catalyst being the market regulator, the California Air Resource Board (CARB)'s approval of its revised rulemaking, known as the Initial Statement of Reasons (ISOR), on May 28, which clears the path for implementation of the reform package as soon as September 1. The amended ISOR did not pr opose any changes to the California cap trajectory presented in the original version, with the updated ISOR accelerating the cap decline by an 11% rate out to 2030 (removing 118 million allowances ) and 7% out to 2035, materially faster than the current 4% trajectory. The main change in the modified ISOR was the introduction of the “Build Up California Reserve” account for the Manufacturing Decarbonization Initiative (MDI). This first of its kind mechanism is intended to minimize carbon -leakage risk and the reby support the decarbonization of California’s manufacturing industry through a reserve of credits that can be awarded to eligible compliance entities that invest in qualified on -site Greenhouse Gas ( GHG) emission reduction projects. While refiners were not eligible for the MDI in the original ISOR, they were subsequently included in it in response to the public comments received. Wildfires start, Pres. Trump takes office Rajinder: release of ISOR not imminent Q1 auction sub
$30, lowest in 2 years CARB delays timing of ISOR EO targeting state climate policy Newsom joint PR to extend program Q2 auction clears at the reserve price EO review period ends, no action taken Q3 auction clears 11% higher CA legislature passes long
awaited extension to 2045 bill Newsom signs bill Oct 29 CARB workshop Weaker Q4 auction, muted response Alpha Inception rumor ISOR released, starts 45
day comment period Q1 Auction results, clears at reserve price Modified 15
day ISOR released CARB approves rulemaking at 2
day Board meeting 20 22 24 26 28 30 32 34 36 38 40 Price (USD) CCA Dec Futures Auction Reserve Price Auction Settlement
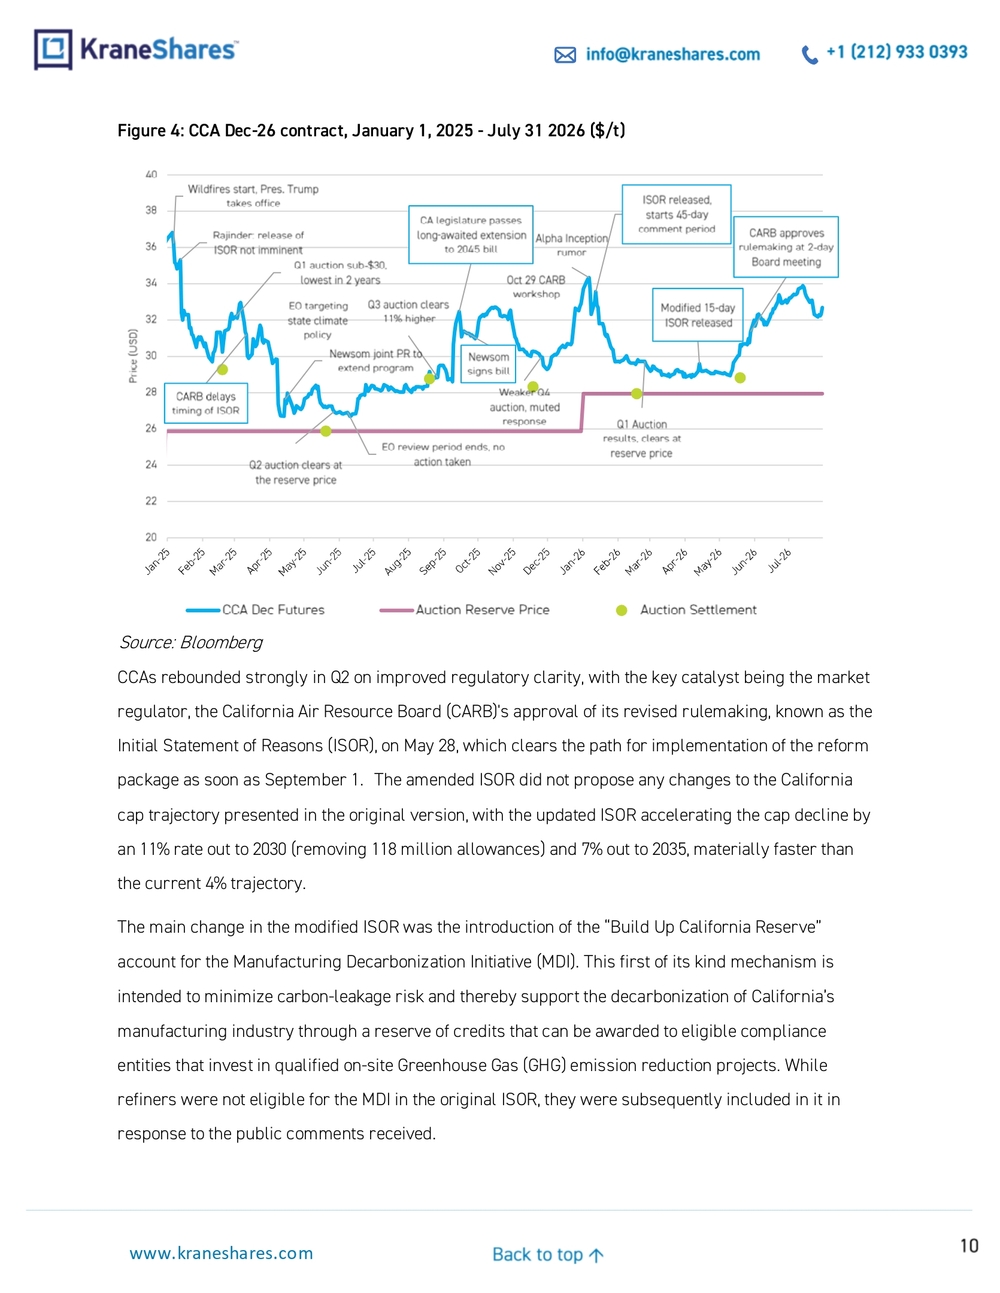
11 info@kraneshares.com +1 (212) 933 0393 www.kraneshares.com Back to top ↑ The other main change in the amended ISOR was that CARB proposed a material increase in the number of free allowances to be a llocated to industry, especially refiners. However, this will not have any bearing on overall supply and should therefore be price neutral. On the one hand it will mean less hedging by industry, which might be considered bearish, but on the other it will r educe liquidity, which could squeeze prices higher and might therefore be considered bullish. Following the release of the amended ISOR, CCAs remained near the floor -price support level through mid-May, likely reflecting initial concern over how many of t he 118m allowances to be removed might ultimately come back to market, and concerns over potential further changes to the ISOR pending the conclusion of the 15 -day comment period for the updated ISOR on April 29. However, once it became clear that CARB was not going to make any further revisions to the ISOR, prices then started rallying from May 12 on increasing optimism that the reform package would be approved at the CARB board meeting at the end of the month, se tting the market up for a bullish Q2 aucti on, which was held on May 20 with the results announced on May 27. The current auction was fully subscribed, with all 49.6m V26 allowances sold at $28.81/t, up 87 cents on the Q1 auction, and the highest auction settlement since Q1 -2025. The cover ratio in creased slightly to 1.11 from 1.04 in Q1, with demand exceeding supply by 5.5m allowances, the highest number for unfulfilled bids since the Q3-2025 auction. Compliance entities purchased 81.3% of the volumes offered (40.4m), and financials 18.7% (9.3m). This represented a near 40% increase in the volume of allowances purchased by financials compared with the Q1 auction, a clear sign of improving sentiment amongst speculative investors. The advance auction also saw strong interest, with all V29 allowances selling at $28.76/t, up 82 cents on the Q1 outcome, and another healthy sign after the Q1 advance auction was under -subscribed. With the CARB Board then approving the reform package on May 29 with a decisive 10 -3 vote, CCAs closed on May 31 at $32.29/t, up 11% over the month. Under the terms of the adoption, CARB is now required to develop further guidance concerning the Manufacturing Decarbonization Initiative (MDI), such as providing full transparency on MDI applications, the tracking of MDI allowances, and annual updates on MDI issuances and retirements. CARB will also have to reveal the progress of MDI -funded projects towards their projected emissions
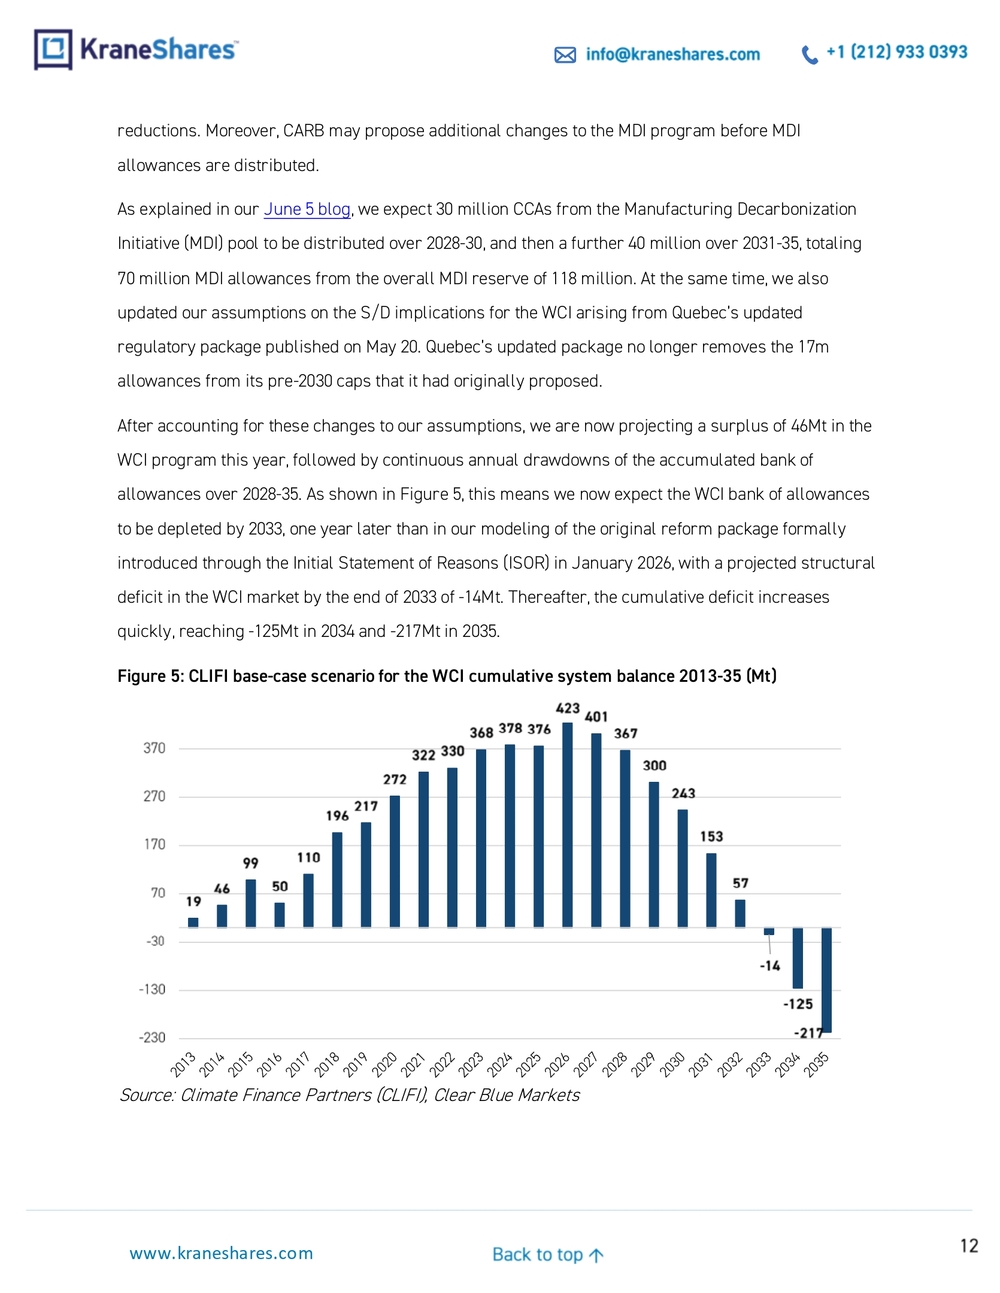
12 info@kraneshares.com +1 (212) 933 0393 www.kraneshares.com Back to top ↑ reductions. Moreover, CARB may propose additional changes to the MDI program before MDI allowances are d istributed. As explained in our June 5 blog , we expect 30 million CCAs from the Manufacturing Decarbonization Initiative (MDI) pool to be distributed over 2028 -30, and then a further 40 million over 2031 -35, totaling 70 million MDI allowances from the overall MDI reserve of 118 million. At the same time, we also updated our assumptions on the S/D implications for the WCI ar ising from Quebec’s updated regulatory package published on May 20. Quebec’s updated package no longer removes the 17m allowances from its pre -2030 caps that it had originally proposed. After accounting for these changes to our assumptions, we are now projecting a surplus of 46Mt in the WCI program this year, followed by continuous annual drawdowns of the accumulated bank of allowances over 2028 -35. As shown in Figure 5, this means we now expect the WCI bank of allowances to be depleted by 2033, one year la ter than in our modeling of the original reform package formally introduced through the Initial Statement of Reasons (ISOR) in January 2026, with a projected structural deficit in the WCI market by the end of 2033 of -14Mt. Thereafter, the cumulative defic it increases quickly, reaching -125Mt in 2034 and -217Mt in 2035. Figure 5: CLIFI base -case scenario for the WCI cumulative system balance 2013 -35 (Mt)
Source: C limate Finance Partners (C LIFI), Clear Blue Markets
19 46 99 50 110 196 217 272 322 330 368 378 376 423 401 367 300 243 153 57
14
125
217 -230 -130 -30 70 170 270 370
13 info@kraneshares.com +1 (212) 933 0393 www.kraneshares.com Back to top ↑ The Board's adoption of the reform pack age is a very significant moment in the evolution of California’s ETS and removes most of the risk that has been hanging over CCAs for the last two years. The market is now awaiting the approval of the Final Statement of Reasons (FSOR) by California’s Office of Administrative Law, and while a pending lawsuit by CBE seeking an injunction against the FSOR’s implementation could exert strong bearish pressure if granted, we do not expect the suit to be successful and expect a formal response form CARB shortly, which should provide greater clarity on the potential legal outcome. We therefore expect California to be able to proceed with implementation of the reform package from September 1. RGAs Returned 52% in Q2 Driven by Virginia 's Re -entry The Regional Greenhouse Gas Initiative (RGGI) , the Northeastern US power market, futures contract (4.98% of KRBN) settled on June 30 at $43.84/ short ton (st), up 52% from the €28.79/st level at which it closed on 31 March 2025. As in the first quarter, this made RGAs the best performing market in the KRBN universe. For both the first half and YTD as of July 31, RGAs were up 66% and 46% respectively against the $26.34/st lev el at which they ended 2025 . Figure 6 shows the price evolution of the Front -Dec RGA contract in Q1 and through April 17. Figure 6: RGA Dec -26 contract, January 1 —July 31 2026 ($/short ton)
Source: Bloomberg After returning 9% in Q1, RGAs had a stellar Q2, with the benchmark Dec -26 contract appreciating 66% over the period, largely on constructive sentiment over Virginia’s imminent return to the RGGI $20.00 $25.00 $30.00 $35.00 $40.00 $45.00 $50.00 $55.00 Jan-26 Feb-26 Mar-26 Apr-26 May-26 Jun-26 Jul-26
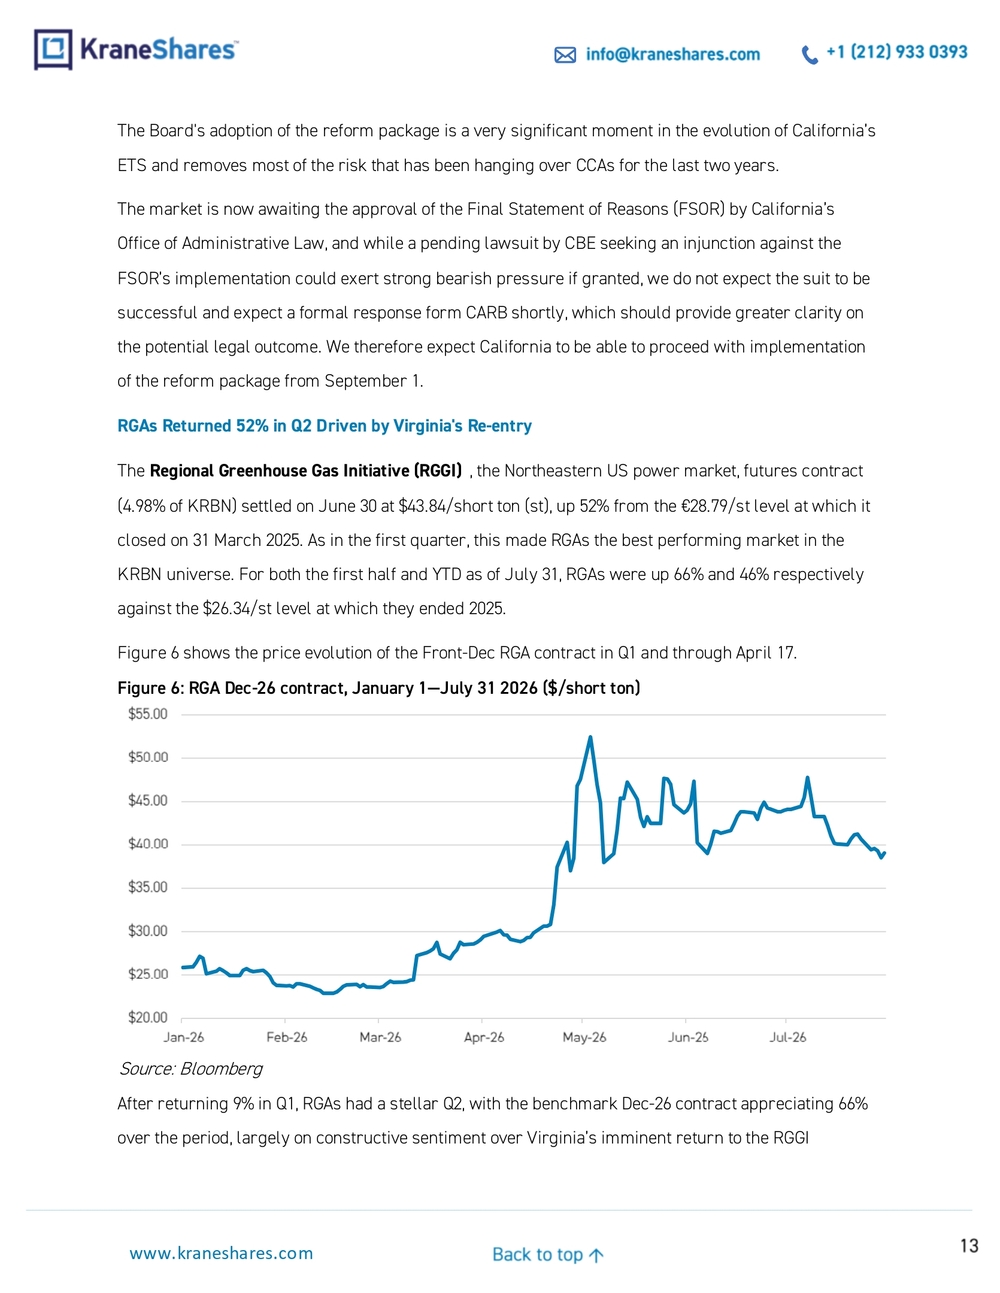
14 info@kraneshares.com +1 (212) 933 0393 www.kraneshares.com Back to top ↑ program. Virginia had announced on February 20 that it would seek to rejoin RGGI after having left in 2023, two years after originally joining. Then, on March 31, Virginia’s Department of Environmental Quality announced that it would seek to rejoin the pro gram as of July 1 and hence participate in the September and December auctions in the second half of the year. The market took this news as a very supportive signal, as Virginia’s emissions have risen sharply over the last couple of years on the back of surging power demand from data centers and increased gas -fired power generation. But Q2 saw a much greater price boost than the initial move in February, with prices rising 80% over the four weeks from April 10 to hit their YTD closing high of $52.47/st in May on speculation that Virginia would in fact be re -admitted already from the beginning of H2. This spec ulation was vindicated on April 29, when RGGI issued an official statement re -admitting Virginia to the scheme from July 1. The RGGI statement read as follows: “With the approval by Governor Spanberger of Virginia’s regulation reinstating their CO2 budget trading program, the RGGI participating states are pleased to welcome Virginia as a returning RGGI participant. Virginia’s participation, alo ng with their compliance requirements, will resume July 1, 2026. Virginia’s allowance budget for the second half of 2026 will be 11.48 million allowances, and they will participate in the September 9 and December 2, 2026 auctions. This will be in addition to allowance offerings from the other ten RGGI participating states in those auctions. Virginia will also originate 1.148 million Cost Containment Reserve (CCR) allowances for the remainder of 2026. Later this year, Virginia will undertake regulatory actio n to align the state’s program with the outcomes of the Third Program Review and the updated Model Rule by January 1, 2027.” Virginia's inclusion is influential because the state is dominating the data -center boom, which is driving outsized energy demand at a rate much faster than in other RGGI states. According to Veyt, Virginia alone could double power demand within RGGI by 20 40. Currently, New York is the highest -emitting state, but Virginia comes in as a close second and could easily overtake the top sp ot depending on where its growing energy uptake is sourced. The Q2 RGGI auction settled at a new all-time-high ( ATH) of $35/st, representing a 40% premium versus the Q1 auction settlement of $24.99, but a 21% discount to the spot price on auction day of $44.51, with the auction's cover ratio falling to 2.4 from 3.3 in Q1. As we noted in our June 5 blog , this
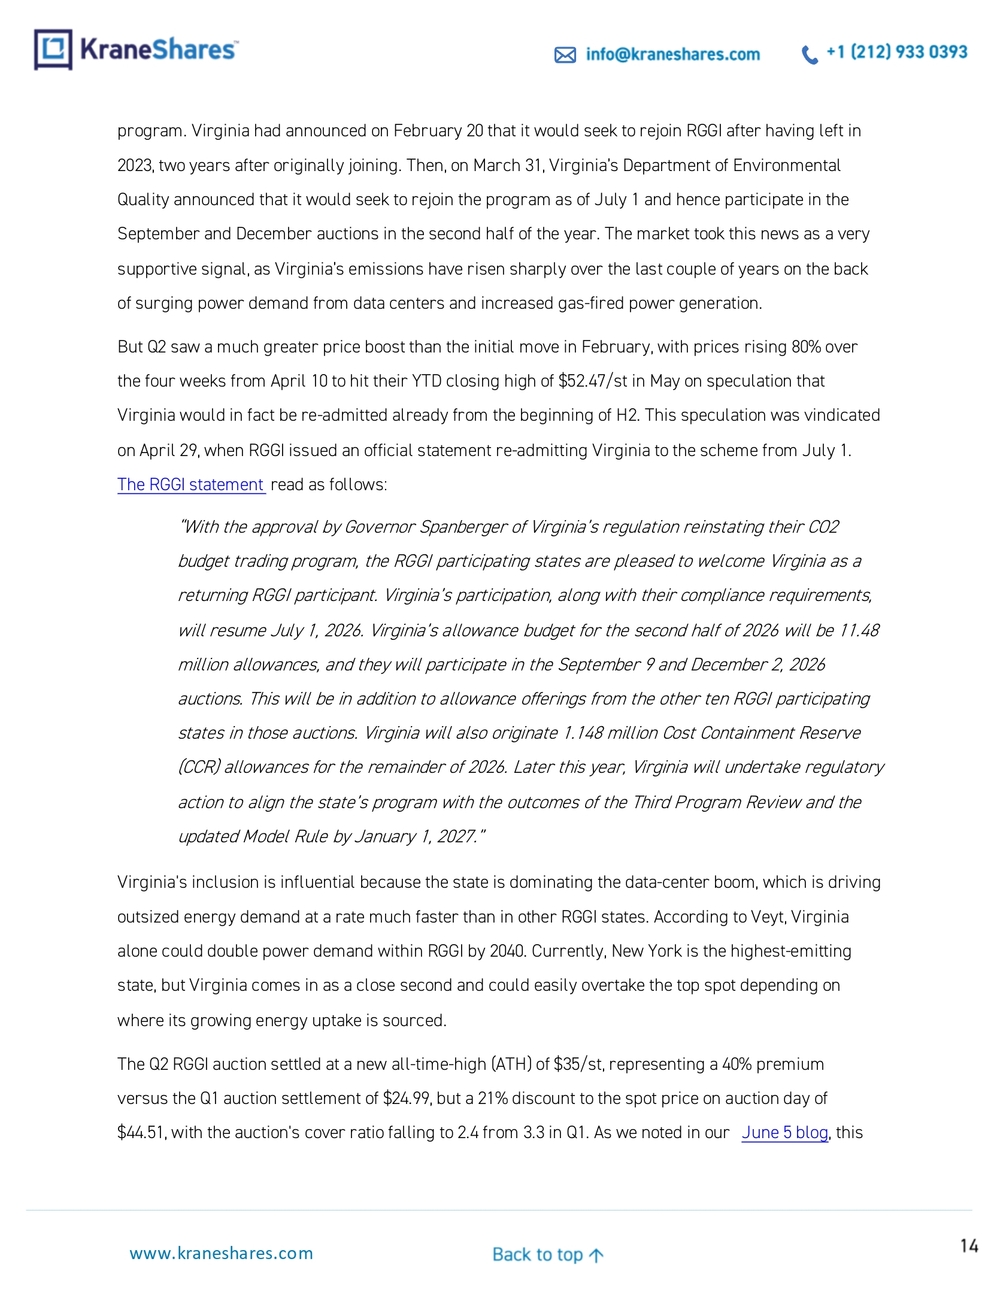
15 info@kraneshares.com +1 (212) 933 0393 www.kraneshares.com Back to top ↑ suggested that prices were running out of steam after such a spectacular run and that a correction was therefore probably due in the secondary market. Prices remained in a $40 -45/st range over the rest of June following the auction, but in July have slipped below $40 and closed on July 31 at $38.58/st. We think this recent sentiment reflects concern over possible regulatory policy to curb prices via new allowance injections. We expect RGAs to continue trading around the $40/st level until greater clarity emerges regarding regulatory intentions. UKAs up 19% in Q2 with Linkage Trade Still the Key Driver United Kingdom allowances (UKA) futures (4.84% of KRBN) settled on 30 June at £56.7/t, up 36 % from the £ 41.5/t level at which it closed Q1. With the USD ending Q2 marginally down against the GBP, UKAs were up 37 % in USD terms over the course of the second quarter . Figure 1 shows the price evolution of the Front -Dec UKA contract in H1 and through end-July. For the first half as a whole, UKAs were down 16% ( 17% in USD terms), an d, as of end -July on a YTD basis , UKAs were down 12% in both GBP and USD terms . Figure 7: UKA Dec -26 contract, January 1 - July 31 , 2026 (£/t)
Source: Bloomberg Figure 8 then shows UKAs plotted against EUAs YTD through July 31 (with UKAs converted into Euros), and Figure 9 the discount of UKAs to EUAs (again in Euros).
£67.1 £72.9 £34.7 £41.6 £56.7 £59.1 £32 £37 £42 £47 £52 £57 £62 £67 £72 Jan-26 Feb-26 Mar-26 Apr-26 May-26 Jun-26 Jul-26
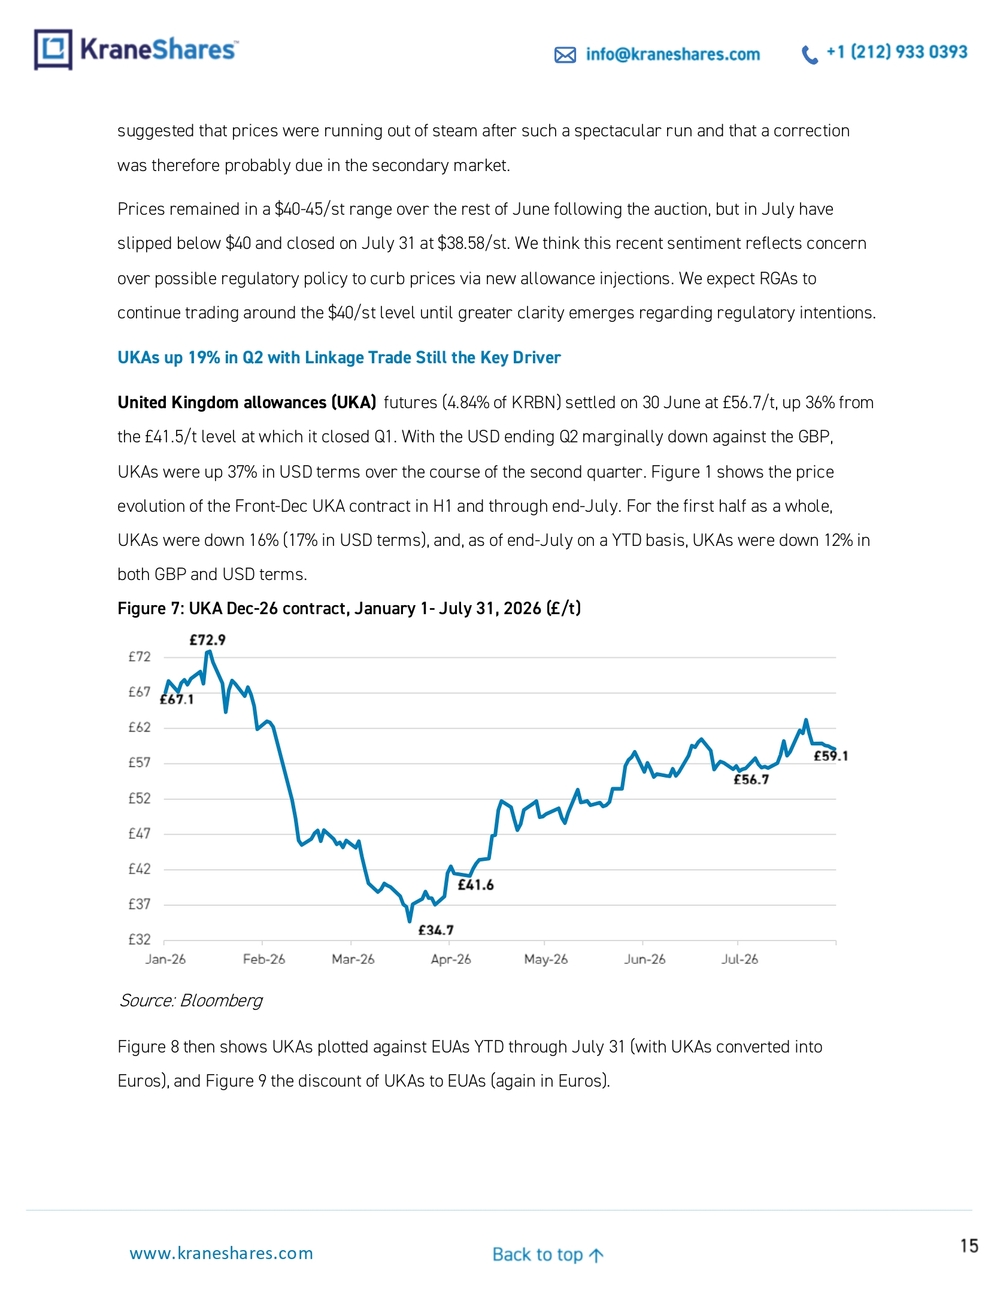
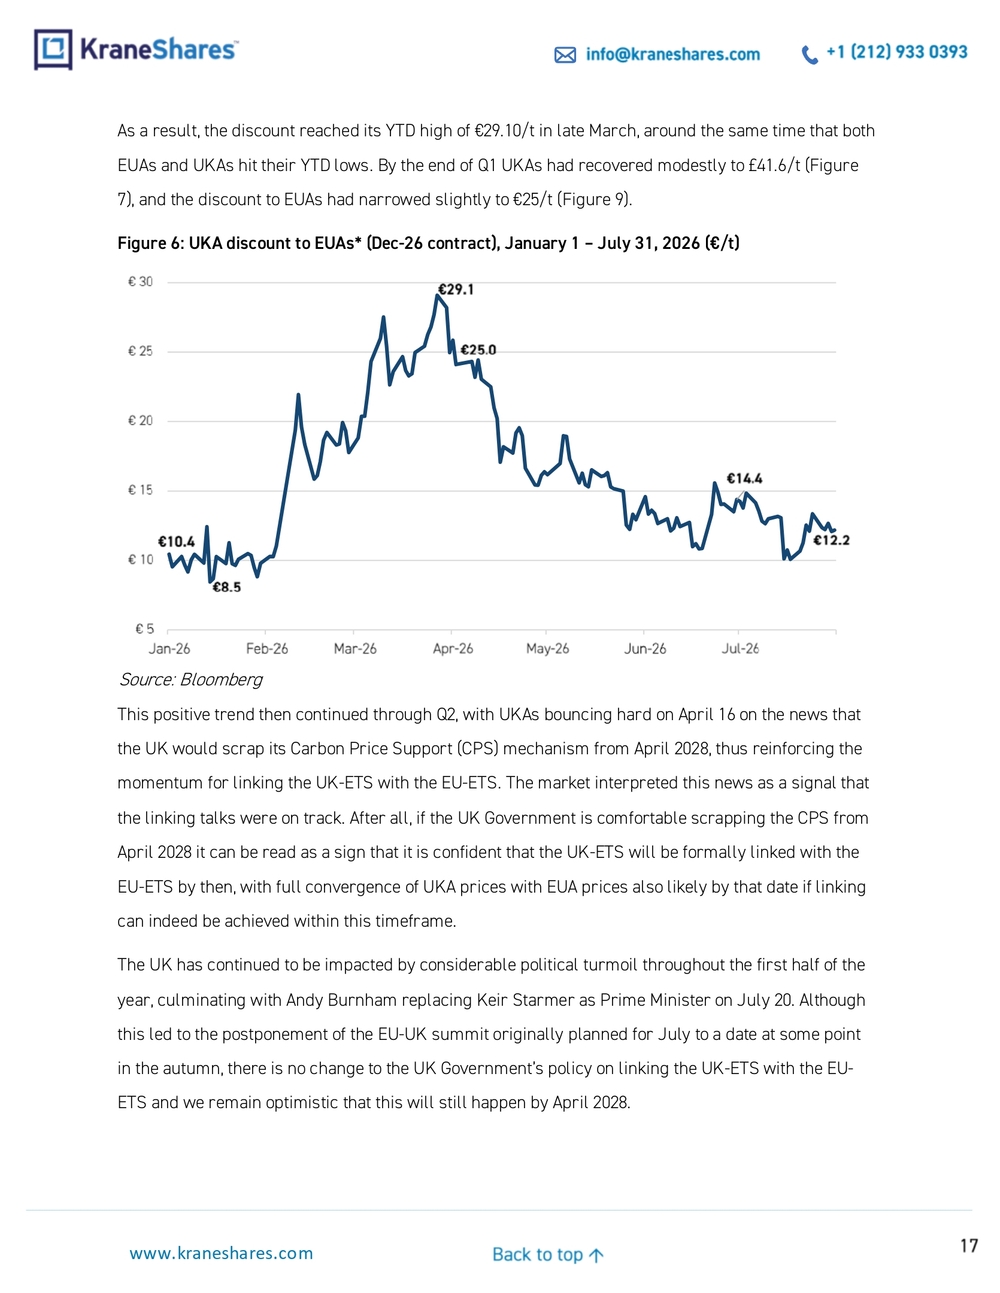
16 info@kraneshares.com +1 (212) 933 0393 www.kraneshares.com Back to top ↑ Figure 8: UKAs v EUAs ° (Dec-26 contract ), January 1 – July 31 , 2026 (£/t) Source: Bloomberg As can be seen by comparing Figure 7 with Figure 1 above, the price pattern of UKAs and EUAs i n Q2 and indeed for the whole of the year so far closely mirror each other , the only difference being that the moves in UKAs have been more exaggerated. This reflects the fact that ever since early 2025 – when the news that the UK and the EU were interested in linking their carbon markets came out – UKAs have not been trading on their own fundamentals but rather in tandem with EUAs, albeit with a varying d iscount depending on the perceived strength of the political messaging on linking at any given time. The logic for UKAs to track EUAs in this fashion is that if and when linking happens, UKAs and EUAs will effectively be fungible instruments that can be used for compliance in either system, and the market is now betting on this happening. As shown in Figu re 9, the discount started the year at €10.4/t and reached a low of €8.5/t on January 14, with UKAs posting their YTD the next day of £72.9/t (Figure 7), or €83.6/t in Euros (Figure 8). However, the discount widened in the absence of news flow around linki ng, as both the political pressure on the EU -ETS and the impact of the Iran war on energy markets put downward pressure on EUAs, squeezing the less liquid UKAs even harder. €87.4 €92.0 €63.7 €71.7 €80.6 €81.3 €76.9 €83.6 €40.2 €47.5 €67.7 €69.1 €33.0 €43.0 €53.0 €63.0 €73.0 €83.0 €93.0 EUA( €/tonne) UKA ( €/tonne)
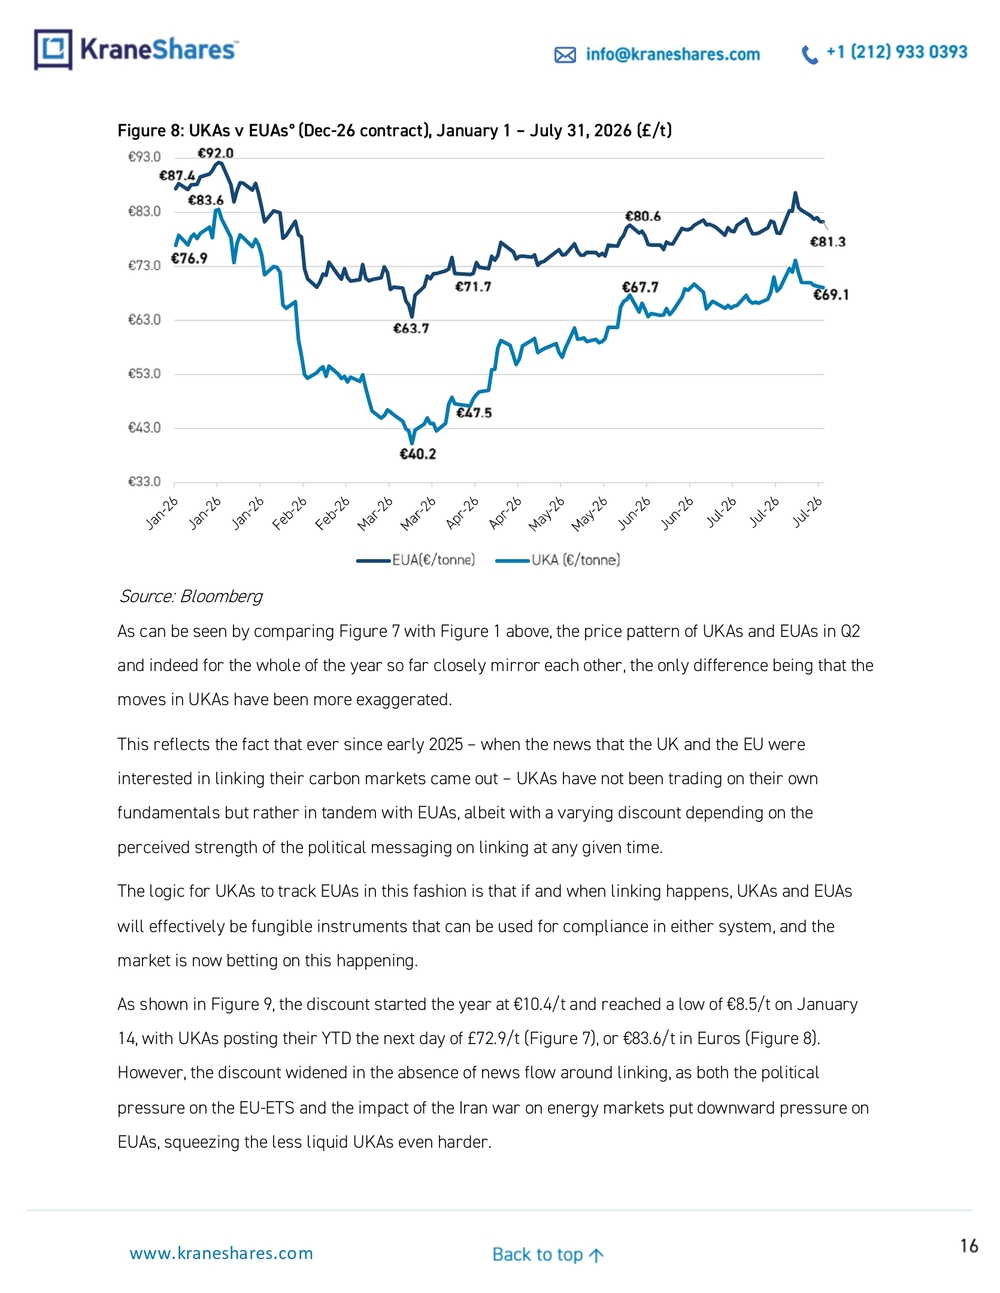
17 info@kraneshares.com +1 (212) 933 0393 www.kraneshares.com Back to top ↑ As a result, the discount reached its YTD high of €29.10/t in late March, around the same time that both EUAs and UKAs hit their YTD lows. By the end of Q1 UKAs had recovered modestly to £41. 6/t (Figure 7), and the discount to EUAs had narrowed slightly to €25 /t (Figure 9). Figure 6: UKA discount to EUAs * (Dec-26 contract ), January 1 – July 31 , 2026 (€/t)
Source: Bloomberg This positive trend then continued through Q2, with UKAs bouncing hard on April 16 on the news that the UK would scrap its Carbon Price Support (CPS) mechanism from April 2028, thus reinforcing the momentum for lin king the UK -ETS with the EU -ETS. The market interpreted this news as a signal that the linking talks were on track. After all, if the UK Government is comfortable scrapping the CPS from April 2028 it can be read as a sign that it is confident that the UK -ETS will be formally linked with the EU-ETS by then, with full convergence of UKA prices with EUA prices also likely by that date if linking can indeed be achieved within this timeframe. The UK has continued to be impacted by c onsiderable political turmoil throughout the first half of the year, culminating with Andy Burnham replacing Keir Starmer as Prime Minister on July 20. Although this led to the postponement of the EU -UK summit originally planned for July to a date at some point in the autumn, there is no change to the UK Government’s policy on linking the UK -ETS with the EU - ETS and we remain optimistic that this will still happen by April 2028. €10.4 €8.5 €29.1 €25.0 €14.4 €12.2 € 5 € 10 € 15 € 20 € 25 € 30 Jan-26 Feb-26 Mar-26 Apr-26 May-26 Jun-26 Jul-26
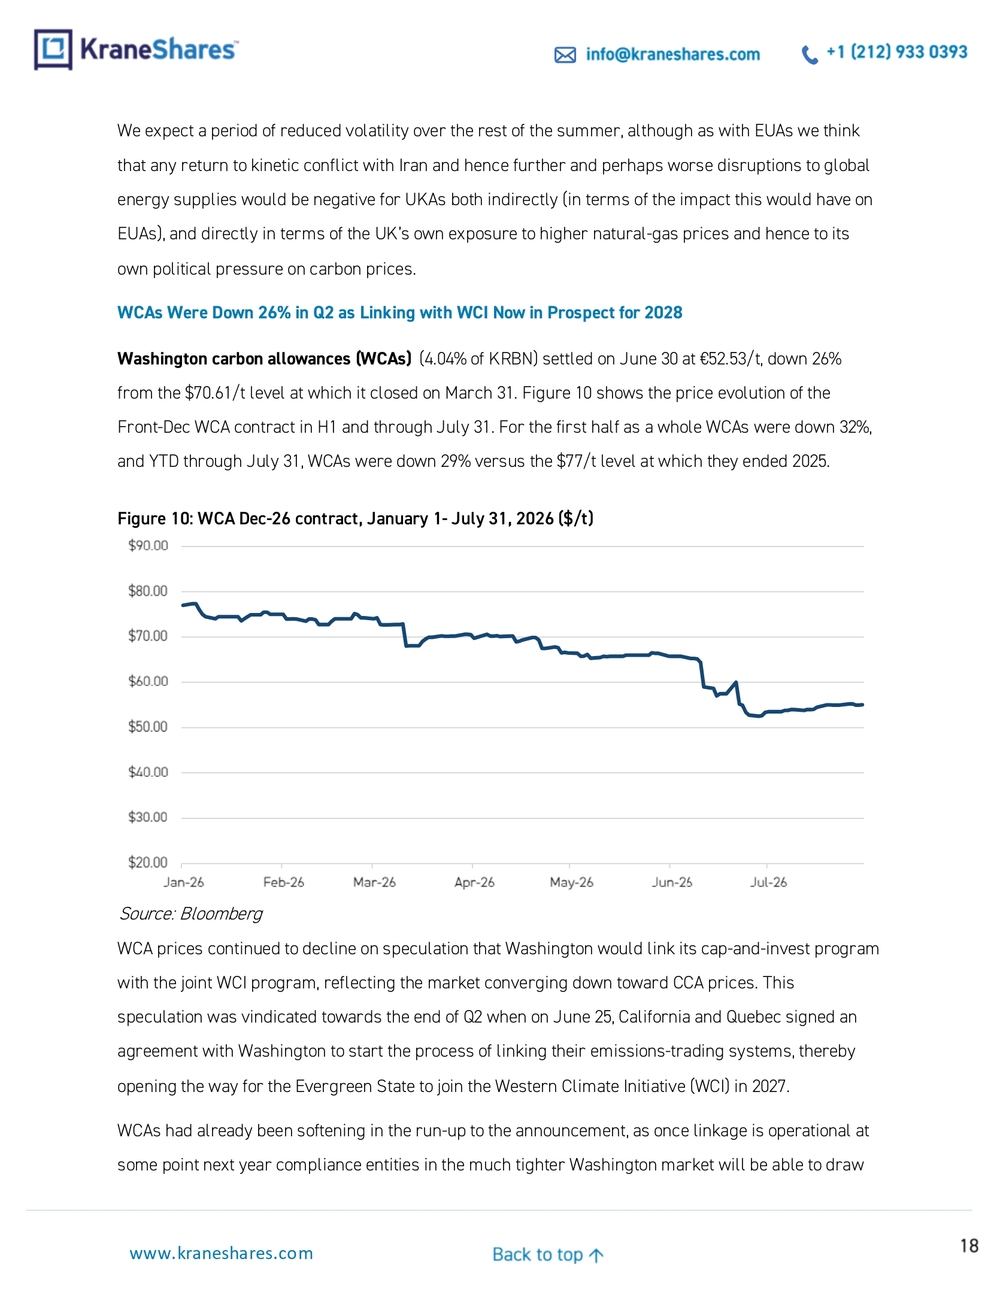
18 info@kraneshares.com +1 (212) 933 0393 www.kraneshares.com Back to top ↑ We expect a period of reduced volatility over the rest of the summer, although as with EUAs we think that any return to kinetic conflict with Iran and hence further and perhaps worse disruptions to global energy supplies would be negative for UKAs both indirectly (in terms of the impact this would have on EUAs ), and directly in terms of the UK’s own exposure to hi gher natural -gas prices and hence to its own political pressure on carbon prices. WCAs Were Down 26% in Q2 as Linking with WCI Now in Prospect for 2028 Washington carbon allowances (WCAs) (4.04% of KRBN) settled on June 30 at €52.53/t, down 26% from the $70.61/t level at which it closed on March 31. Figure 10 shows the price evolution of the Front -Dec WCA contract in H1 and through July 31. For the first half as a whole WCAs were down 32%, and YTD through July 31, WCAs were down 29% versus the $77/t level at which they ended 2025.
Figure 10: WCA Dec -26 contract, January 1 - July 31 , 2026 ($/t)
Source: Bloomberg WCA prices continued to decline on speculation that Washington would link its cap -and-invest program with the joint WCI program , reflecting the market converging down toward CCA prices . This speculation was vindicated towards the end of Q2 when on June 25 , California and Quebec signed an agreement with Washington to start the process of linking thei r emissions -trading systems, thereby opening the way for the Evergreen State to join the Western Climate Initiative (WCI) in 2027 . WCAs had already been softening in the run -up to the announcement, as once linkage is operational at some point next year compliance entities in the much tighter Washington market will be able to draw $20.00 $30.00 $40.00 $50.00 $60.00 $70.00 $80.00 $90.00 Jan-26 Feb-26 Mar-26 Apr-26 May-26 Jun-26 Jul-26
19 info@kraneshares.com +1 (212) 933 0393 www.kraneshares.com Back to top ↑ on CCAs and Quebec carbon allowances to meet their obligations. By the same token, of course, adding Washington’s tighter balances to the WCI is structurally supportive for CCAs a t the margin going forward. With Washington having already amended its Cap -and-Invest regulations to prepare for linkage, the timeframe for formally enabling Washington to join the WCI will depend on the speed with which California and Quebec can make the necessary regulatory accommo dations on their side. The press release published by Washington states that the plan is to have the three markets linked at some point in 2027: “While completing a linkage agreement is a major milestone, it is just one part of each jurisdiction’s linkage process. In Washington, the Climate Commitment Act establishes that the linkage agreement is the step that authorizes Washington’s Cap -and-Invest Program to accept allowances and offset credits from California and Québec, completing the linkage process. California and Québec must complete additional steps, including adopting regulations to accept compliance instruments from Washington, before a linked market can take effect. Officials expect to operate a linked market in 2027.” If the link is operationally formalized before November 2027, Washington compliance entities will be able to use CCAs and Quebec -issued allowances for compliance against the state's first compliance period (CP1) obligations (the deadline for CP1 is Novembe r 1, 2027), thereby reducing the need to rely on Washington’s Allowance Price Containment Reserve (APCR). With the current price differential between CCAs and Washington’s APCR Tier -1 still over $20/t wide despite the sharp fall in WCAs already experienced, linking Washington to the WCI should bring WCAs down towards CCA and Quebec price levels while also raising CCAs and Quebec prices somewhat, owing to the extra demand that Washington compliance entities will bring to the WCI Program. WCA prices currently sit around the $55/t level, and without any immediate catalysts to drive decisive price action the market appears content for now to await the finalization of the linkage process.
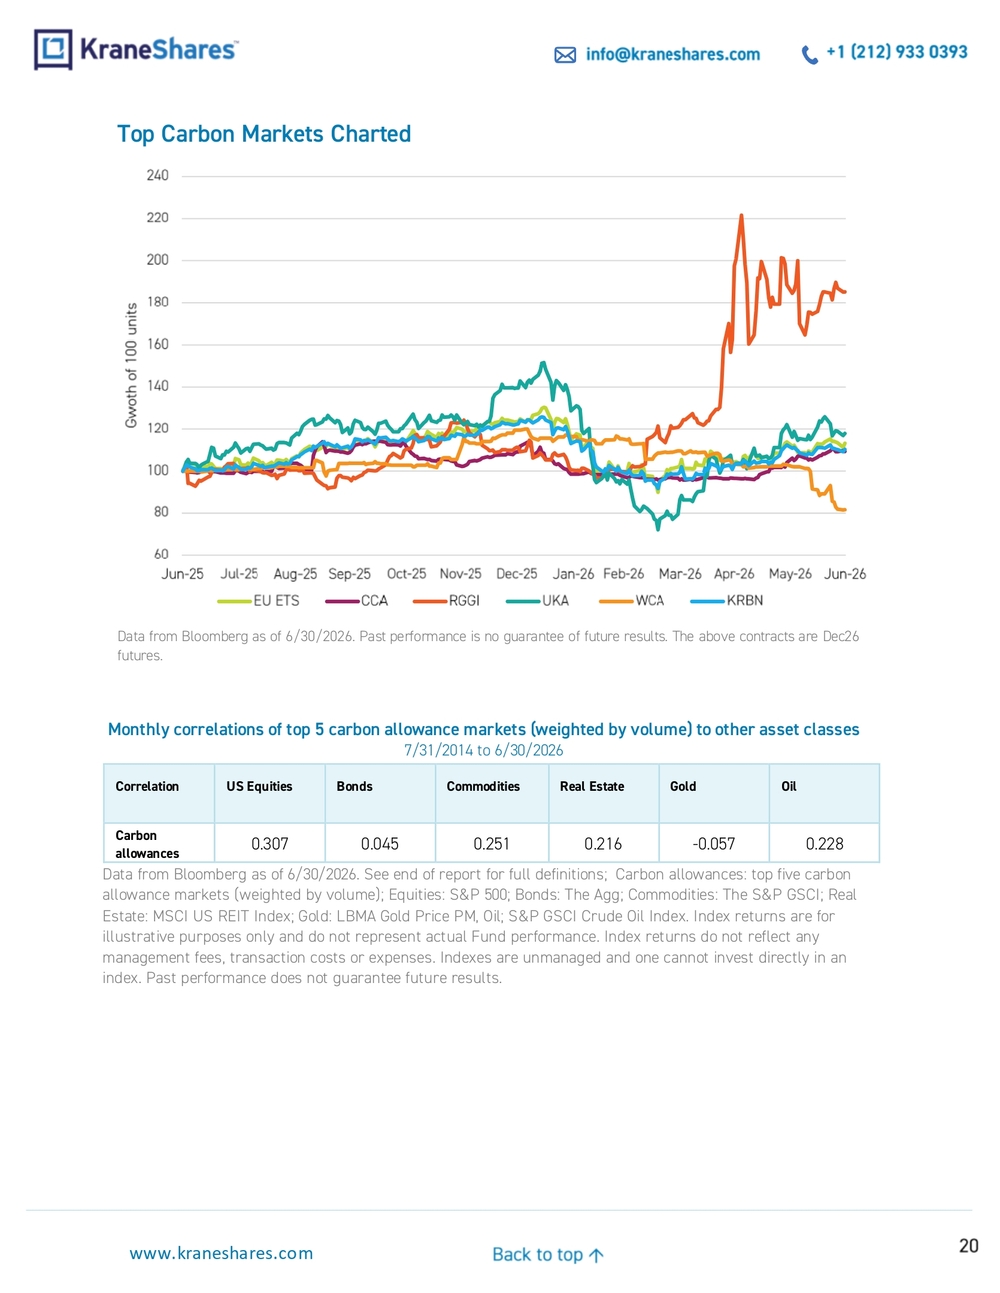
20 info@kraneshares.com +1 (212) 933 0393 www.kraneshares.com Back to top ↑ Top Carbon Market s Charted
Data from Bloomberg as of 6/30/2026. Past performance is no guarantee of future results. The above contracts are Dec2 6 futures.
60 80 100 120 140 160 180 200 220 240 Jun-25 Jul-25 Aug-25 Sep-25 Oct-25 Nov-25 Dec-25 Jan-26 Feb-26 Mar-26 Apr-26 May-26 Jun-26 Gwoth of 100 units EU ETS CCA RGGI UKA WCA KRBN Monthly correlations of top 5 carbon allowance markets (weighted by volume) to other asset classes 7/31/2014 to 6/30/2026 Correlation US Equities Bonds Commodities Real Estate Gold Oil Carbon allowances 0.307 0.045 0.251 0.216 -0.057 0.228 Data from Bloomberg as of 6/30/202 6. See end of report for full definitions; Carbon allowances: top five carbon allowance markets (weighted by volume) ; Equities: S&P 500; Bonds: The Agg; Commodities: The S&P GSCI; Real Estate: MSCI US REIT Index ; Gold: LBMA Gold Price PM , Oil; S&P GSCI Crude Oil Index . Index returns are for illustrative purposes only and do not represent actual Fund p erformance. Index returns do not reflect any management fees, transaction costs or expenses. Indexes are unmanaged and one cannot invest directly in an index. Past performance does not guarantee future results.
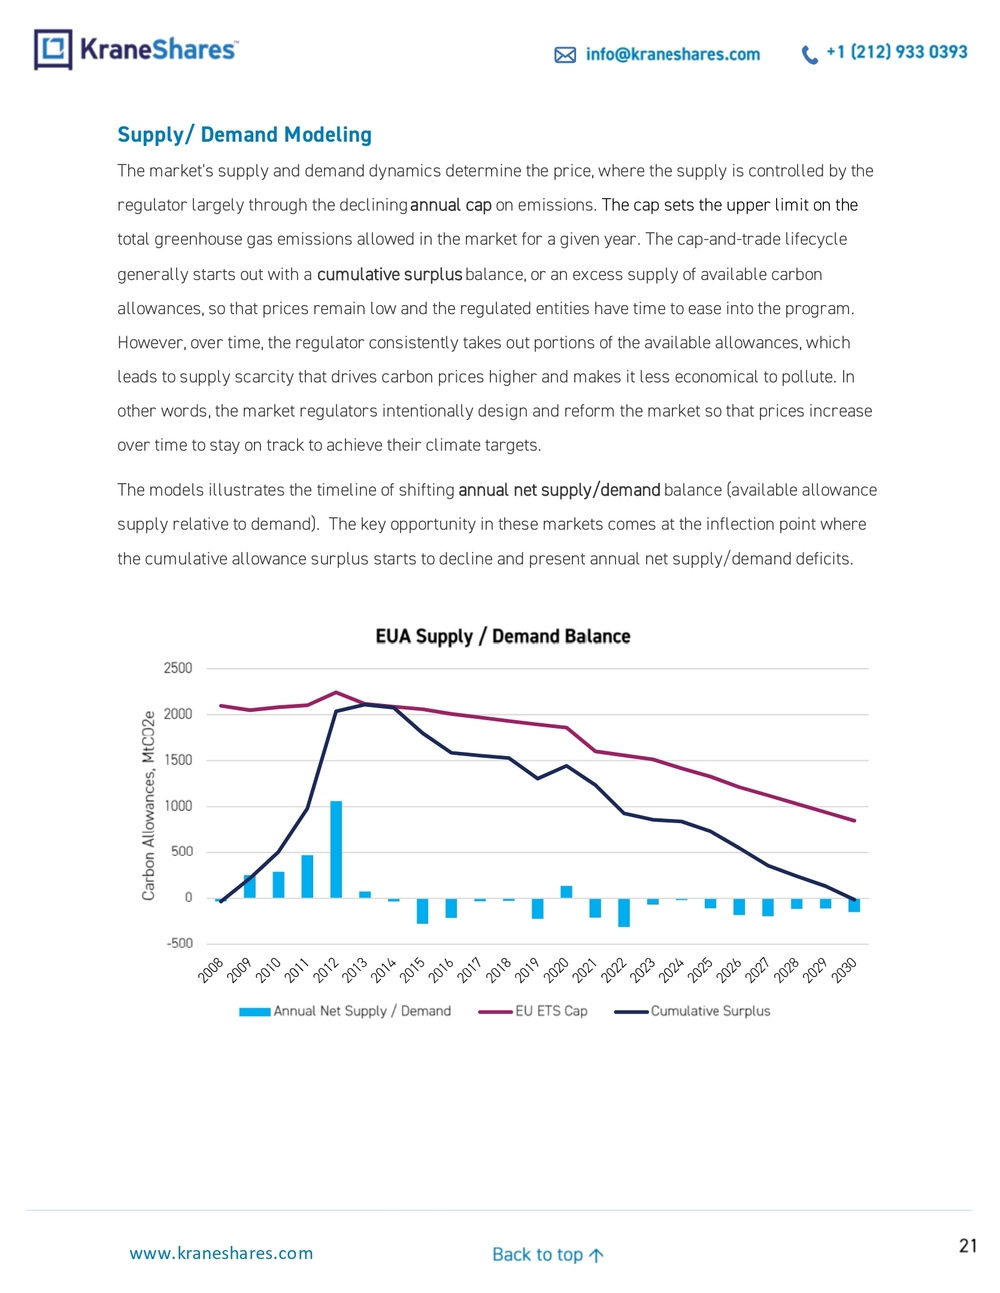
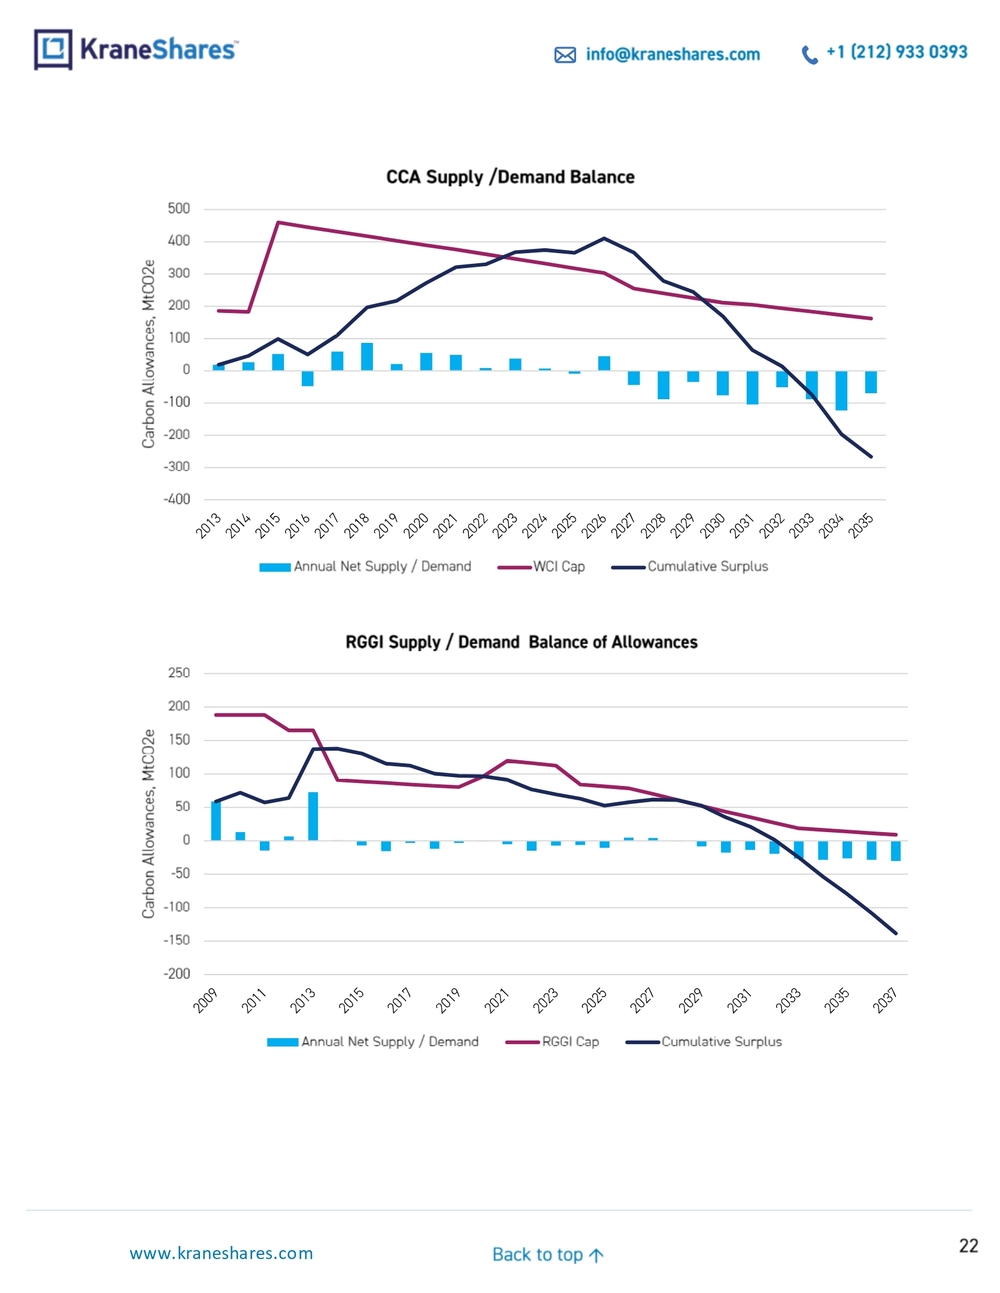
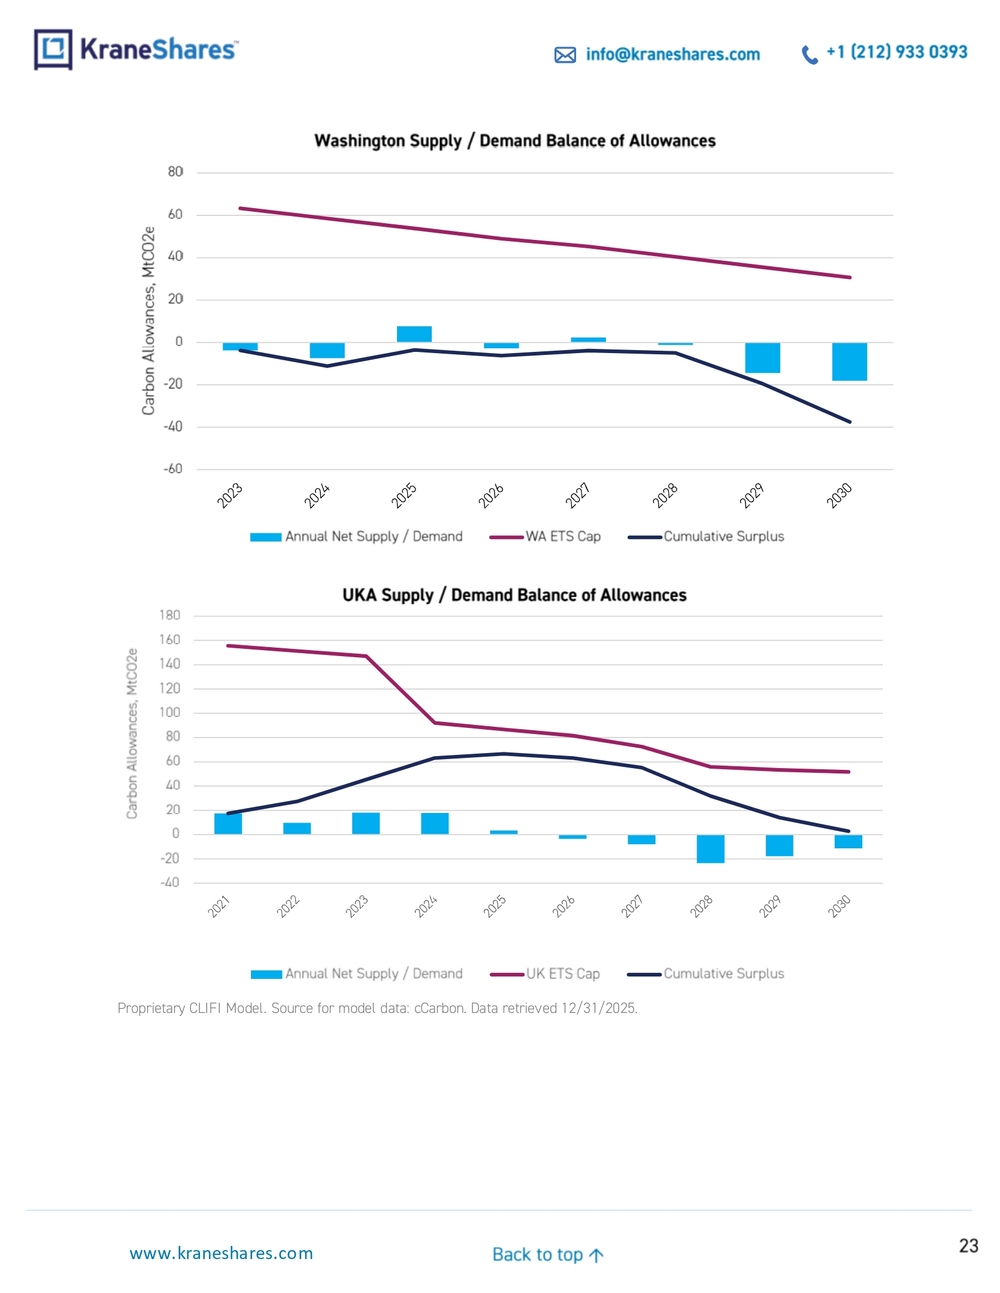
21 info@kraneshares.com +1 (212) 933 0393 www.kraneshares.com Back to top ↑ Supply/ Demand Modeling The market's supply and demand dynamics determine the price, where the supply is controlled by the regulator largely through the declining annual cap on emissions . The cap sets the upper limit on the total greenhouse gas emissions allowed in the market f or a given year. The cap -and-trade lifecycle generally starts out with a cumulative surplus balance, or an excess supply of available carbon allowances, so that prices remain low and the regulated entities have time to ease into the program. However, over time, the regulator consistently takes out portions of the available allowances, which leads to supply scarcity that drives carbon prices higher and makes it less economical to pollute. In other words, the market regulators intentionally design and reform the market so that prices increase over time to stay on track to achieve their climate targets. The models illustrates the timeline of shift ing annual net supply/demand balance (available allowance supply relative to demand) . The key opportunity in these markets comes at the inflection point where the cumulative allowance surplus starts to decline and present annual net supply/demand deficits.
-500 0 500 1000 1500 2000 2500 Carbon Allowances, MtCO2e EUA Supply / Demand Balance Annual Net Supply / Demand EU ETS Cap Cumulative Surplus
22 info@kraneshares.com +1 (212) 933 0393 www.kraneshares.com Back to top ↑
-400 -300 -200 -100 0 100 200 300 400 500 Carbon Allowances, MtCO2e CCA Supply /Demand Balance Annual Net Supply / Demand WCI Cap Cumulative Surplus -200 -150 -100 -50 0 50 100 150 200 250 Carbon Allowances, MtCO2e RGGI Supply / Demand Balance of Allowances Annual Net Supply / Demand RGGI Cap Cumulative Surplus
23 info@kraneshares.com +1 (212) 933 0393 www.kraneshares.com Back to top ↑
Proprietary CLIFI Model. Source for model data: cCarbon. Data retrieved 12/31/202 5. -60 -40 -20 0 20 40 60 80 Carbon Allowances, MtCO2e Washington Supply / Demand Balance of Allowances Annual Net Supply / Demand WA ETS Cap Cumulative Surplus -40 -20 0 20 40 60 80 100 120 140 160 180 Carbon Allowances, MtCO2e UKA Supply / Demand Balance of Allowances Annual Net Supply / Demand UK ETS Cap Cumulative Surplus
24 info@kraneshares.com +1 (212) 933 0393 www.kraneshares.com Back to top ↑ Data from Blo omberg as of 12/31/2025. Index Definitions S&P 500: Standard & Poor's Index is a capitalization -weighted index of 500 stocks. Bloomberg Barclays US Aggregate Bond Index (”The Agg”): A broad base, market capitalization - weighted bond market index representing intermediate term investment grade bonds traded in the United States. Inception date: January 1, 1986 S&P GSCI: A composite index of commodities that measures the performance of the commodity market. Inception date: May 7, 2007 MSCI US REIT Index (daily price return USD): A free float -adjusted market capitalization weighted index that is comprised of equity Real Estate Investment Trusts (REITs). Inception date: June 20, 2005 MSCI All Country World Index (Gross USD): The MSCI All Country World Index is a market capitalization weighted index designed to provide a broad measure of equity -market performance throughout the world. Inception date: May 31, 1990 LBMA Gold Price PM: The global benchmark price for unallocated gold delivered, IBA operates electronic a uctions for spot, unallocated loco London gold S&P GSCI Crude Oil Index: Provides a publicly available benchmark for investment performance in the crude oil market. Inception date: May 1, 1991 S&P Global Clean Energy Index: Designed to measure the performance of 30 companies from around the world that are involved in clean energy -related businesses. Inception Date: February 22, 2007
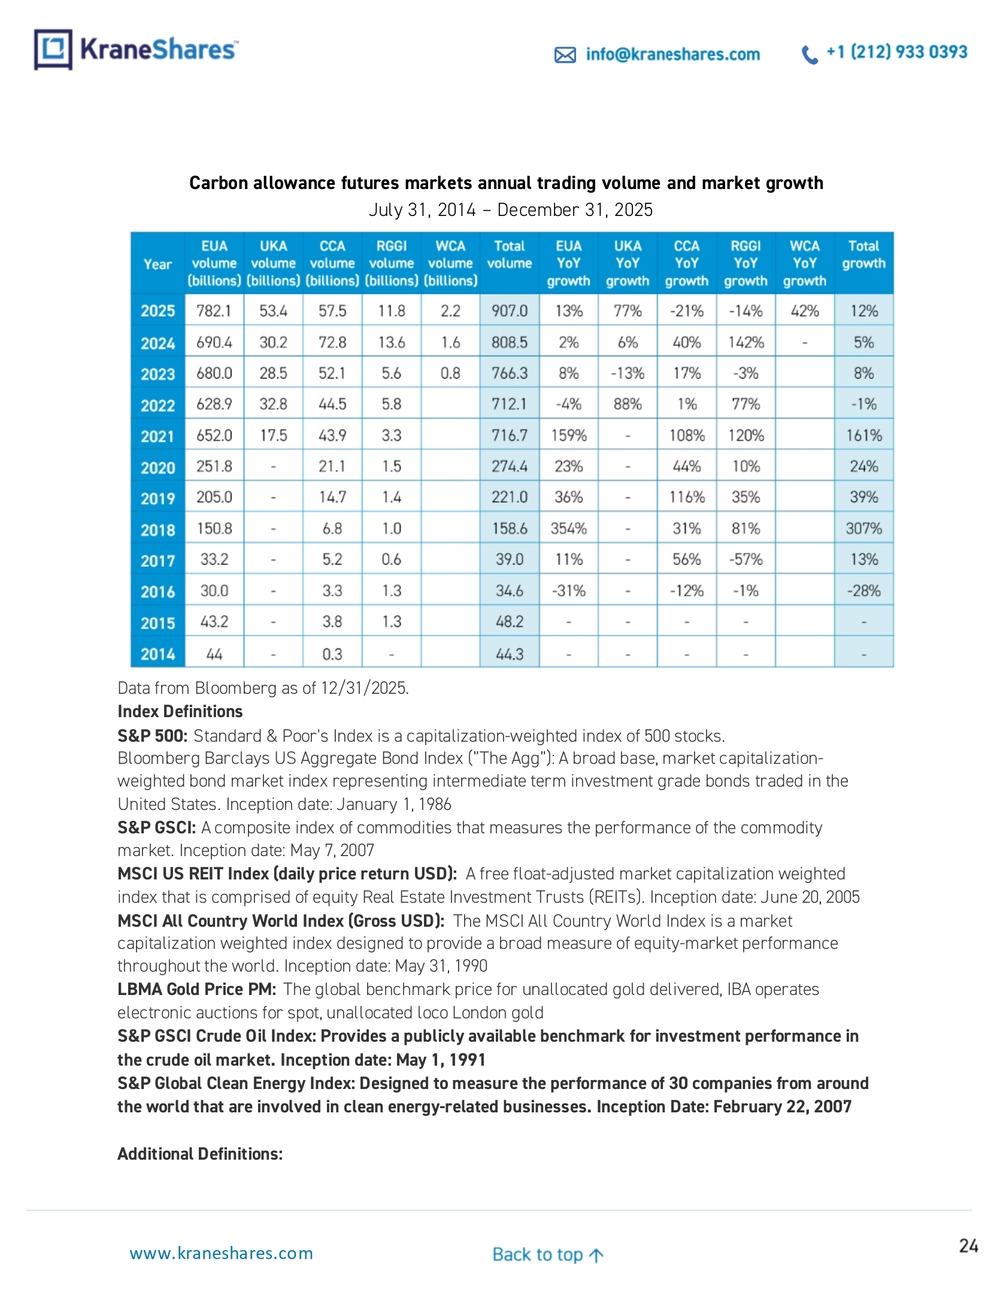
Additional Definition s: Carbon allowance futures markets annual trading volume and market growth July 31, 2014 – December 31, 2025
25 info@kraneshares.com +1 (212) 933 0393 www.kraneshares.com Back to top ↑ Inflation : the rate at which prices for goods and services rise over time, reducing the purchasing power of money. It can result from changes in supply and demand, production costs, or monetary and fiscal policies. Cost Containment Reserve (CCR): reserves of allowances that help provide market stability if the cost of reducing emissions is higher or lower than expected. Correlations: a statistical measure that describes the size and direction of a relationship between two or more variables, where a higher number indicates a higher correlation . Flows: movement of cash into/out of companies, financial assets , sectors, or other market categories. Carbon allowances: Top 5 carbon allowance markets by constituent trade volume. The Index is used since the index start date July 25, 2019. From 11/30/2016 to prior to the index start date, 60% and 5% were respectively assigned to EUA futures prices (current year and next ye ar December vintages) using Intercontinental Exchange daily published settlement prices, 20% and 5% were respectively assigned to CCA futures (current year and next year December vintages) using IHS Markit OPIS’s daily Carbon Market Report published prices, and 10% was assigned to RGGI (current year December vintage) using IHS Markit OPIS’s daily Carbon Market Report published prices. Prior to 11/30/2016, 60% and 5% respectively were assigned to EUA f utures prices (current year and next year December vintages) using Intercontinental Exchange daily published settlement prices and 35% was respectively assigned to CCA futures (current year December vintage) using IHS Markit OPIS’s daily Carbon Market Repo rt published prices. For the two ranges developed prior to the index start date, Intercontinental Exchange and IHS Markit OPIS’s Daily Carbon Market Report publish daily pricing for each contract vintage for all relevant days when the futures trade.
Past performance does not guarantee future results.
Carefully consider the Funds ' investment objectives, risk factors, charges and expenses before investing. This and additional information can be found in the Funds ' full and summary prospectus, which may be obtained by visiting: KRBN and KCCA . Read the prospectus carefully before investing. Risk Disclosures: Investing involves risk, including possible loss of principal. There can be no assurance that a Fund will achieve its stated objectives. Indices are unmanaged and do not include the effect of fees. One cannot invest directly in an index. This information should not be relied upon as research, investment advice , or a recommendation regarding any products, strategies, or any security in particular. This material is strictly for illustrative, educational, or informational purposes and is subject to change. Certain content represents an assessment of the market env ironment at a specific time and is not intended to be a forecast of future events or a guarantee of future results; material is as of the dates noted and is subject to change without notice. KCCA and KRBN may invest in derivatives, which are often more vol atile than other investments and may magnify KCCA and KRBN's gains or losses. A derivative (i.e., futures/forward contracts, swaps, and options) is a contract that derives its value from the performance of an underlying asset. The primary risk of derivativ es is that changes in the asset’s market value and the derivative may not be proportionate, and some derivatives can have the potential for unlimited losses. Derivatives are also subject to liquidity and counterparty risk. KCCA and KRBN are subject to liqu idity risk, meaning that certain investments may become difficult to purchase or sell at a reasonable time and price. If a
26 info@kraneshares.com +1 (212) 933 0393 www.kraneshares.com Back to top ↑ transaction for these securities is large, it may not be possible to initiate, which may cause KCCA and KRBN to suffer losses. Counterparty risk is the risk of loss in the event that the counterparty to an agreement fails to make required payments or other wise comply with the terms of the derivative. KCCA and KRBN rely on the existence of cap and trade regimes. There is no assurance tha t cap and trade regimes will continue to exist, or that they will prove to be an effective method of reduction in GHG emissions. Changes in U.S. law and related regulations may impact the way KCCA and KRBN operate, increase Fund costs and/or change the com petitive landscape. New technologies may arise that may diminish or eliminate the need for cap and trade markets. Ultimately, the cost of emissions credits is determined by the cost of actually reducing emissions levels. If the price of credits becomes too high, it will be more economical for companies to develop or invest in green technologies, thereby suppressing the demand for credits. Fluctuations in currency of foreign countries may have an adverse effect to domestic currency values. The use of futures contracts is subject to special risk considerations. The primary risks associated with the use of futures contracts include: (a) an imperfect correlation between the change in market value of the reference asset and the price of the futures contract; (b) possible lack of a liquid secondary market for a futures contract and the resulting inability to close a futures contract when desired; (c) losses caused by unanticipated market movements, which are potentially unlimited; (d) the inability to predict corre ctly the direction of market prices, interest rates, currency exchange rates and other economic factors; and (e) if KCCA and KRBN have insufficient cash, it may have to sell securities or financial instruments from its portfolio to meet daily variation margin requirements, which may lead to KCCA and KRBN selling securities or financial instruments at a loss. KCCA and KRBN invest through a subsidiary, and is indirectly exposed to the risks associated with the Subsidiary’s investments. Since the Subsidiary is organized under the law of the Cayman Islands and is not registered with the SEC under the Investment Co mpany Act of 1940, as such KCCA and KRBN will not receive all of the protections offered to shareholders of registered investment companies. KCCA and K RBN and the Subsidiary will be considered commodity pools upon commencement of operations, and each will be subject to regulation under the Commodity Exchange Act and CFTC rules. Commodity pools are subject to additional laws, regulations and enforcement p olicies, which may increase compliance costs and may affect the operations and performance of KCCA and KRBN and the Subsidiary. Futures and other contracts may have to be liquidated at disadvantageous times or prices to prevent KCCA and KRBN from exceeding any applicable position limits established by the CFTC. The value of a commodity -linked derivative investment typically is based upon the price movements of a physical commodity and may be affected by changes in overall market movements, volatility of the Index, changes in interest rates, or factors affecting a particular industry or commodity. KCCA and KRBN are subject to interest rate risk, which is the chance that bonds will decline in value as interest rates rise. Narrowly focused investments typically exhibit higher volatility. KCCA and KRBN’s assets are expected to be concentrated in a sect or, industry, market, or group of concentrations to the extent that the Underlying Index has such concentrations. The securities or futures in that concentration could react similarly to market developments. Thus, KCCA and KRBN are subject to loss due to a dverse occurrences that affect that concentration. KCCA and KRBN are non - diversified. ETF shares are bought and sold on an exchange at market price (not NAV) and are not individually redeemed from the Fund. However, shares may be redeemed at NAV directly by certain authorized broker -dealers (Authorized Participants) in very large creation/r edemption units. The returns shown do not represent the returns you would receive if you traded shares at other times. Shares may trade
27 info@kraneshares.com +1 (212) 933 0393 www.kraneshares.com Back to top ↑ at a premium or discount to their NAV in the secondary market. Brokerage commissions will reduce returns. Beginning 12/23/2020, market price returns are based on the official closing price of an ETF share or, if the official closing price isn't available, the midpoint between the national best bid and national best offer ("NBBO") as of the time the ETF calculates the current NAV per share. Prior to that date, market price returns were based on the midpoint between the Bid and Ask price. NAVs are calculated using prices as of 4:00 PM Eastern Time. The KraneShares ETFs and KFA Funds ETFs are distributed by SEI Investments Distribution Company (SIDCO), 1 Freedom Valley Drive, Oaks, PA 19456, which is not affiliated with Krane Funds Advisors, LLC, the Investment Adviser for the Funds, or any sub -advise rs for the Funds. [R_US_KS_SEI]
28 info@kraneshares.com +1 (212) 933 0393 www.kraneshares.com Back to top ↑
ABOUT KRANESHARES Krane Funds Advisors, LLC is the investment manager for KraneShares ETFs. KraneShares delivers research -driven, high -conviction strategies connecting investors to the world’s most powerful growth themes. From China’s dynamic capital markets to emerging technologies, alternatives, carbon credits, covered calls and fixed income, we aim to hel p investors position portfolios for the future. By combining innovative products, deep expertise, and trusted global partnerships, KraneShares helps investors position portfolios to capture the megatrends reshaping the global economy. Together, we focus on delivering exceptional client experiences and innovative solutions.