Electric Vehicle ETF | KARS | KraneShares
by Kraneshares
Driving The Future:
Opportunities From The Electric Vehicle & Future Mobility Ecosystem
KARS
3/31/2026
KraneShares Electric Vehicles & Future Mobility ETF
KARS
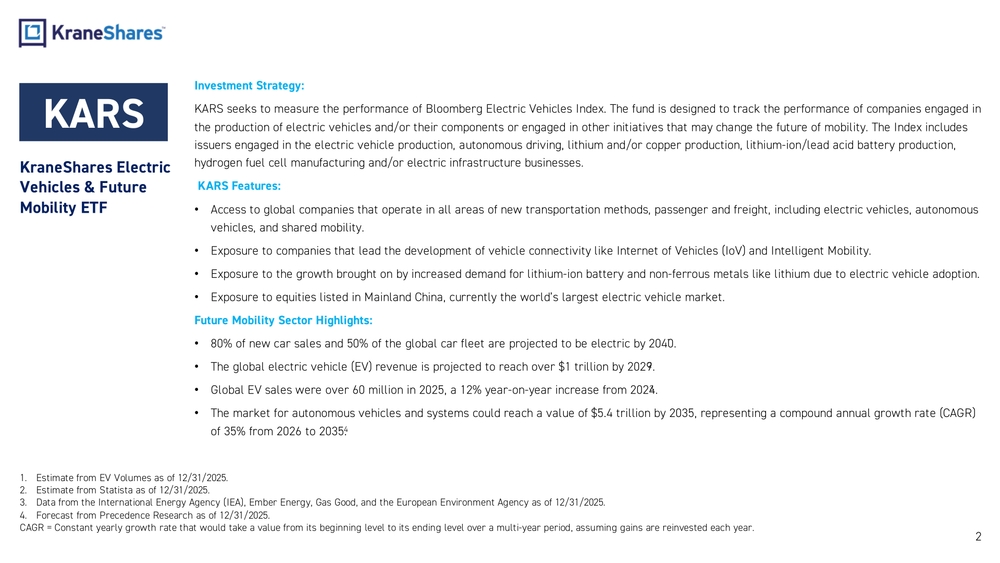
Investment Strategy:
KARS seeks to measure the performance of Bloomberg Electric Vehicles Index. The fund is designed to track the performance of companies engaged in the production of electric vehicles and/or their components or engaged in other initiatives that may change the future of mobility. The Index includes issuers engaged in the electric vehicle production, autonomous driving, lithium and/or copper production, lithium-ion/lead acid battery production, hydrogen fuel cell manufacturing and/or electric infrastructure businesses.
KARS Features:
- Access to global companies that operate in all areas of new transportation methods, passenger and freight, including electric vehicles, autonomous vehicles, and shared mobility.
- Exposure to companies that lead the development of vehicle connectivity like Internet of Vehicles (IoV) and Intelligent Mobility.
- Exposure to the growth brought on by increased demand for lithium-ion battery and non-ferrous metals like lithium due to electric vehicle adoption.
- Exposure to equities listed in Mainland China, currently the world's largest electric vehicle market.
Future Mobility Sector Highlights:
- 80% of new car sales and 50% of the global car fleet are projected to be electric by 2040.
- The global electric vehicle (EV) revenue is projected to reach over $1 trillion by 2029.
- Global EV sales were over 60 million in 2025, a 12% year-on-year increase from 2024.
- The market for autonomous vehicles and systems could reach a value of $5.4 trillion by 2035, representing a compound annual growth rate (CAGR) of 35% from 2026 to 2035.
The Electric Vehicle (EV) & Future Mobility Ecosystem
| Category | Definition |
|---|---|
| Vehicles | Electric vehicles (EV) manufacturers are the brands that consumers know and are the largest group in the ecosystem. |
| Components | EVs often require complex components, especially for sensors if they are at all self-driving, that are made by specialized firms. |
| Batteries | Adoption of electric vehicles and other new energy vehicles dramatically increases demand for lithium-ion and other types of batteries. |
| Charging | Electric vehicle adoption requires robust, widespread, and efficient charging stations and infrastructure. |
| Raw Materials | Adoption of electric vehicles and other new energy vehicles may drive demand for raw materials such as lithium. |
| Autonomous Driving | Autonomous driving is the new frontier of mobility, improving outcomes and experience. |

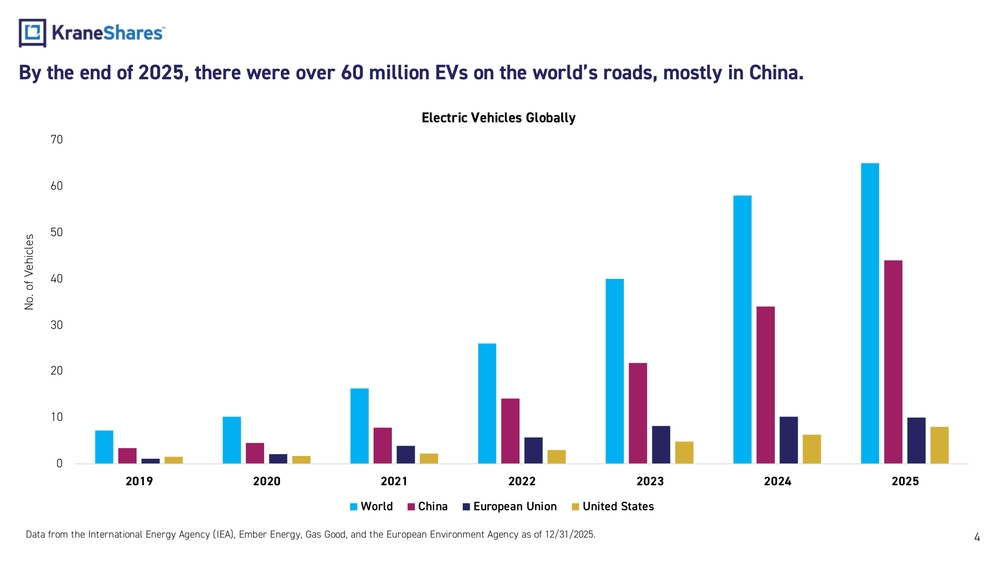
By the end of 2025, there were over 60 million EVs on the world's roads, mostly in China.
Electric Vehicles Globally
Bar chart showing the number of electric vehicles globally from 2019 to 2025, broken down by World, China, European Union, and United States.
- By 2025, the world total exceeded 60 million EVs.
- China leads all regions in EV adoption throughout the period.
- The European Union and United States show steady but smaller growth compared to China.
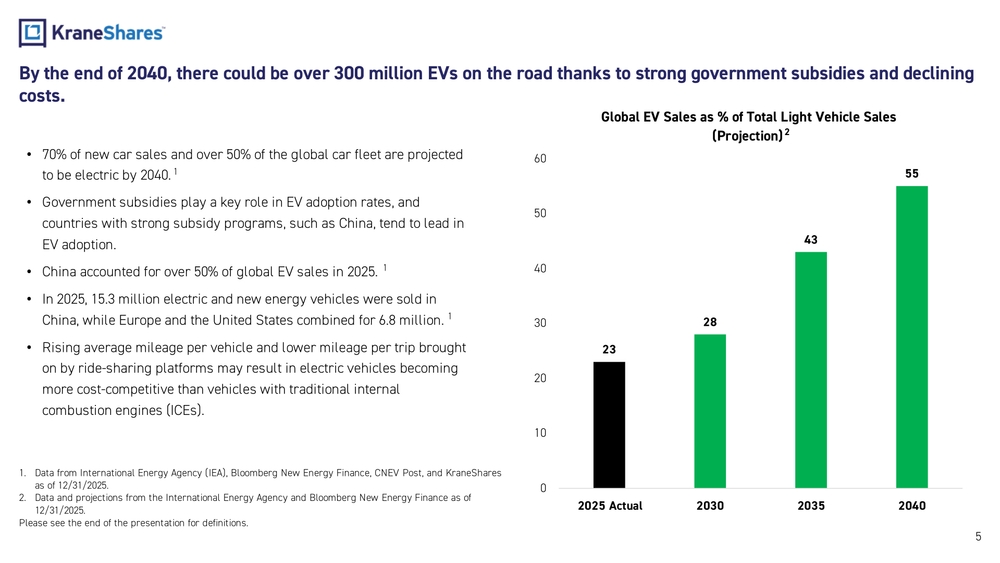
By the end of 2040, there could be over 300 million EVs on the road thanks to strong government subsidies and declining costs.
- 70% of new car sales and over 50% of the global car fleet are projected to be electric by 2040.
- Government subsidies play a key role in EV adoption rates, and countries with strong subsidy programs, such as China, tend to lead in EV adoption.
- China accounted for over 50% of global EV sales in 2025.
- In 2025, 15.3 million electric and new energy vehicles were sold in China, while Europe and the United States combined for 6.8 million.
- Rising average mileage per vehicle and lower mileage per trip brought on by ride-sharing platforms may result in electric vehicles becoming more cost-competitive than vehicles with traditional internal combustion engines (ICEs).
Global EV Sales as % of Total Light Vehicle Sales (Projection)
| Year | % of Total Light Vehicle Sales |
|---|---|
| 2025 Actual | 23% |
| 2030 | 28% |
| 2035 | 43% |
| 2040 | 55% |
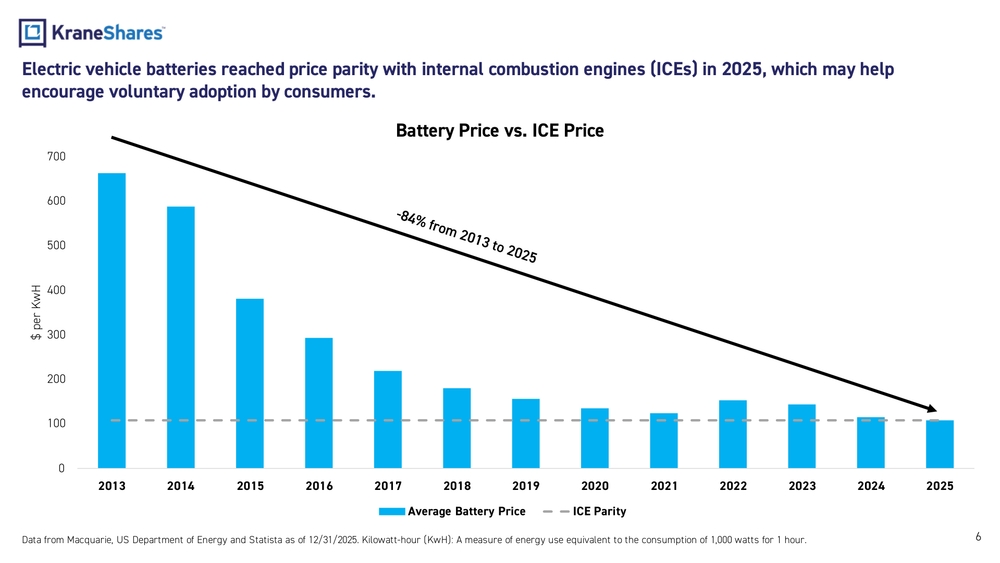
Electric vehicle batteries reached price parity with internal combustion engines (ICEs) in 2025, which may help encourage voluntary adoption by consumers.
Battery Price vs. ICE Price
Bar chart showing average battery price ($ per KwH) from 2013 to 2025 compared to ICE parity line.
- Battery prices declined by 84% from 2013 to 2025.
- In 2025, average battery prices reached the ICE parity threshold of approximately $100/KwH.
- This price parity milestone may encourage voluntary consumer adoption of EVs without reliance on government mandates.
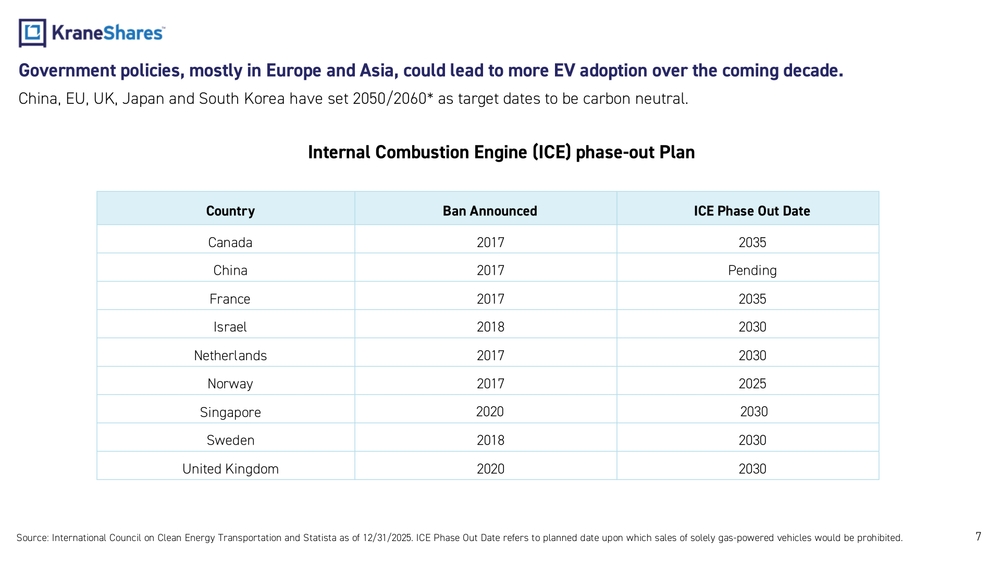
Government policies, mostly in Europe and Asia, could lead to more EV adoption over the coming decade.
China, EU, UK, Japan and South Korea have set 2050/2060 as target dates to be carbon neutral.
Internal Combustion Engine (ICE) phase-out Plan
| Country | Ban Announced | ICE Phase Out Date |
|---|---|---|
| Canada | 2017 | 2035 |
| China | 2017 | Pending |
| France | 2017 | 2035 |
| Israel | 2018 | 2030 |
| Netherlands | 2017 | 2030 |
| Norway | 2017 | 2025 |
| Singapore | 2020 | 2030 |
| Sweden | 2018 | 2030 |
| United Kingdom | 2020 | 2030 |
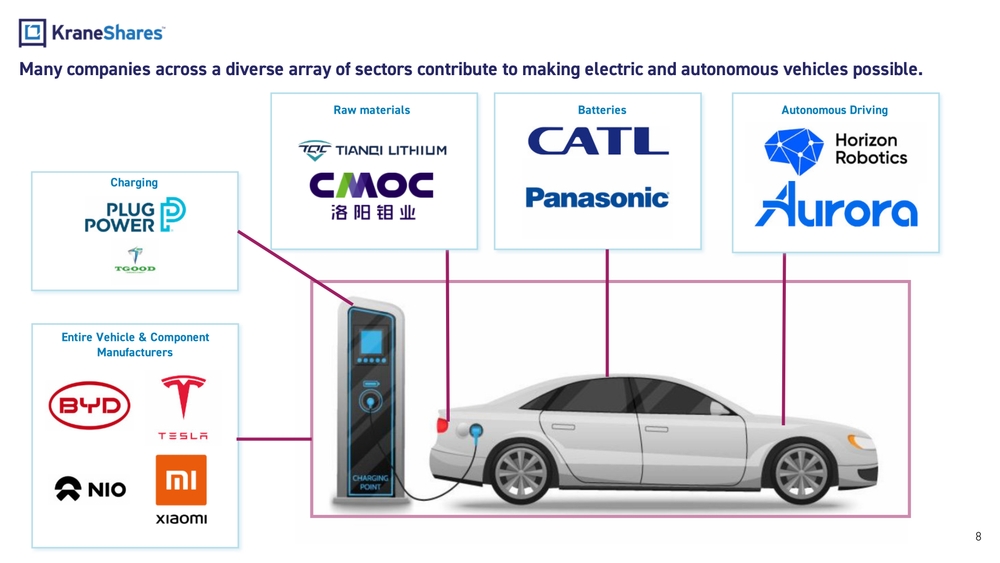
Many companies across a diverse array of sectors contribute to making electric and autonomous vehicles possible.
Charging
- Plug Power
- TGOOD
Raw Materials
- Tianqi Lithium
- CMOC
Batteries
- CATL
- Panasonic
Autonomous Driving
- Horizon Robotics
- Aurora
Entire Vehicle & Component Manufacturers
- BYD
- Tesla
- NIO
- Xiaomi
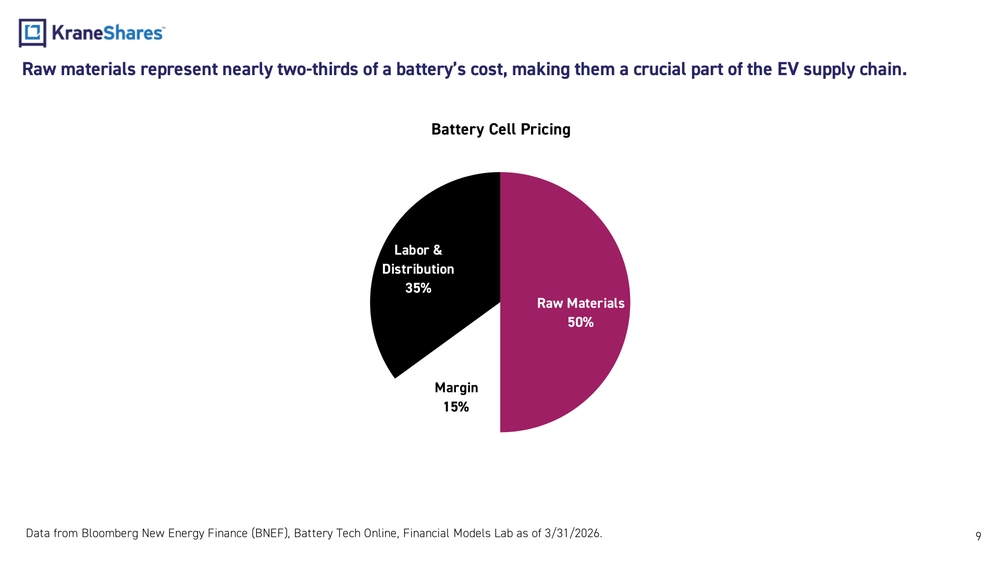
Raw materials represent nearly two-thirds of a battery's cost, making them a crucial part of the EV supply chain.
Battery Cell Pricing
| Component | Share of Battery Cell Cost |
|---|---|
| Raw Materials | 50% |
| Labor & Distribution | 35% |
| Margin | 15% |
Raw materials account for 50% of battery cell pricing, while labor & distribution account for 35%, and margin accounts for 15%.
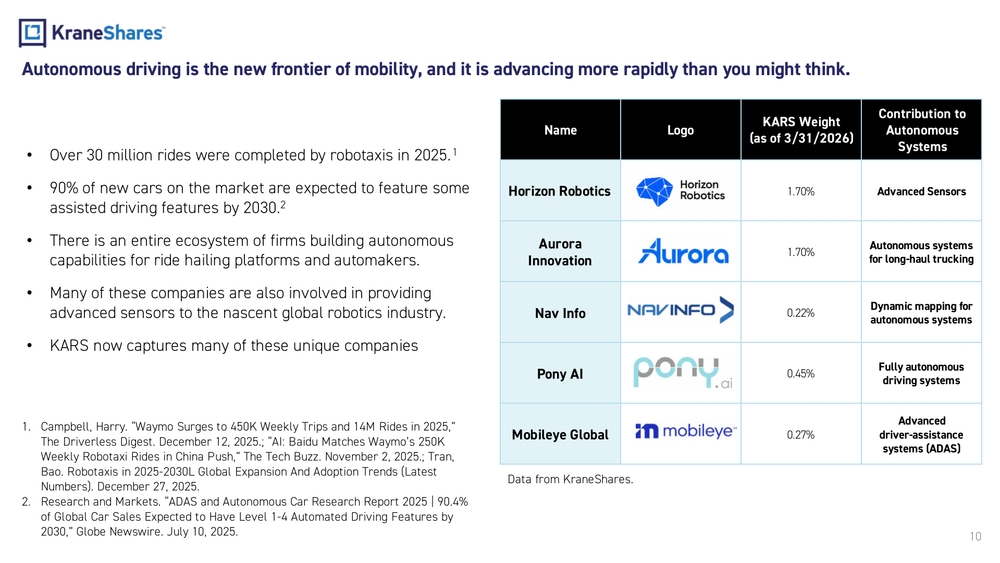
Autonomous driving is the new frontier of mobility, and it is advancing more rapidly than you might think.
- Over 30 million rides were completed by robotaxis in 2025.
- 90% of new cars on the market are expected to feature some assisted driving features by 2030.
- There is an entire ecosystem of firms building autonomous capabilities for ride hailing platforms and automakers.
- Many of these companies are also involved in providing advanced sensors to the nascent global robotics industry.
- KARS now captures many of these unique companies.
Key Autonomous Driving Holdings in KARS (as of 3/31/2026)
| Name | KARS Weight | Contribution to Autonomous Systems |
|---|---|---|
| Horizon Robotics | 1.70% | Advanced Sensors |
| Aurora Innovation | 1.70% | Autonomous systems for long-haul trucking |
| Nav Info | 0.22% | Dynamic mapping for autonomous systems |
| Pony AI | 0.45% | Fully autonomous driving systems |
| Mobileye Global | 0.27% | Advanced driver-assistance systems (ADAS) |
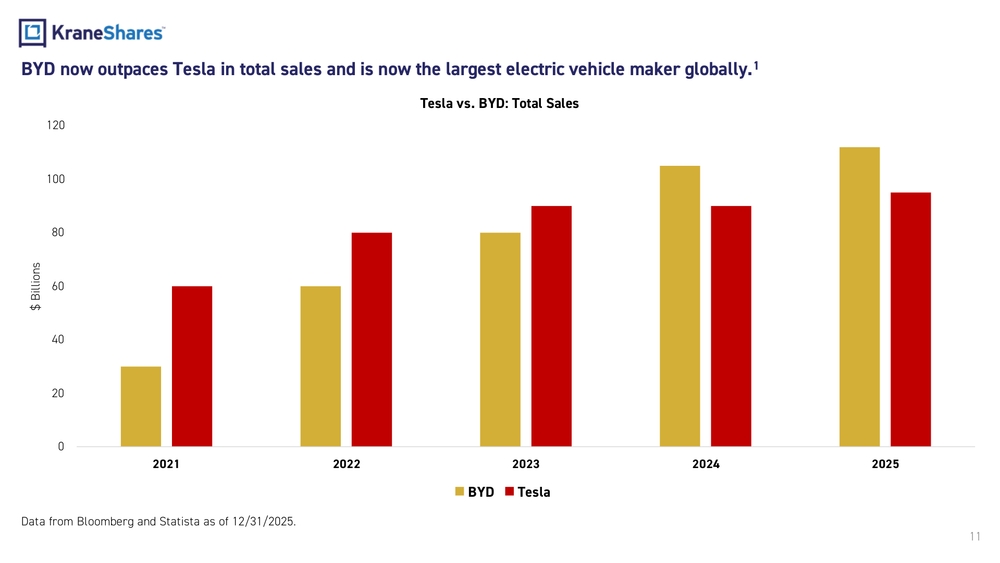
BYD now outpaces Tesla in total sales and is now the largest electric vehicle maker globally.
Tesla vs. BYD: Total Sales
| Year | BYD ($ Billions) | Tesla ($ Billions) |
|---|---|---|
| 2021 | ~30 | ~60 |
| 2022 | ~60 | ~80 |
| 2023 | ~80 | ~90 |
| 2024 | ~105 | ~90 |
| 2025 | ~113 | ~95 |
Data from Bloomberg and Statista as of 12/31/2025.
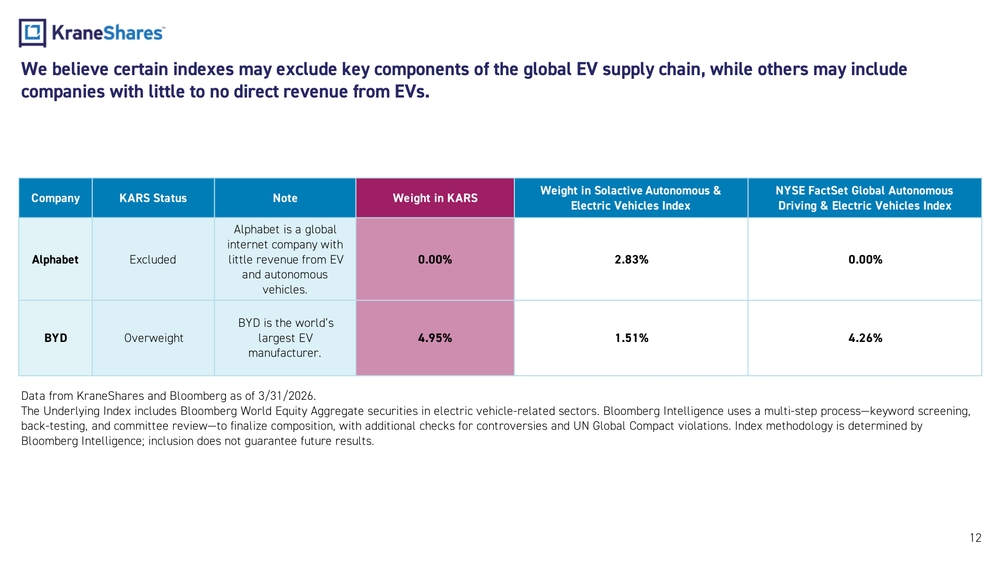
We believe certain indexes may exclude key components of the global EV supply chain, while others may include companies with little to no direct revenue from EVs.
| Company | KARS Status | Note | Weight in KARS | Weight in Solactive Autonomous & Electric Vehicles Index | NYSE FactSet Global Autonomous Driving & Electric Vehicles Index |
|---|---|---|---|---|---|
| Alphabet | Excluded | Alphabet is a global internet company with little revenue from EV and autonomous vehicles. | 0.00% | 2.83% | 0.00% |
| BYD | Overweight | BYD is the world's largest EV manufacturer. | 4.95% | 1.51% | 4.26% |
Data from KraneShares and Bloomberg as of 3/31/2026.
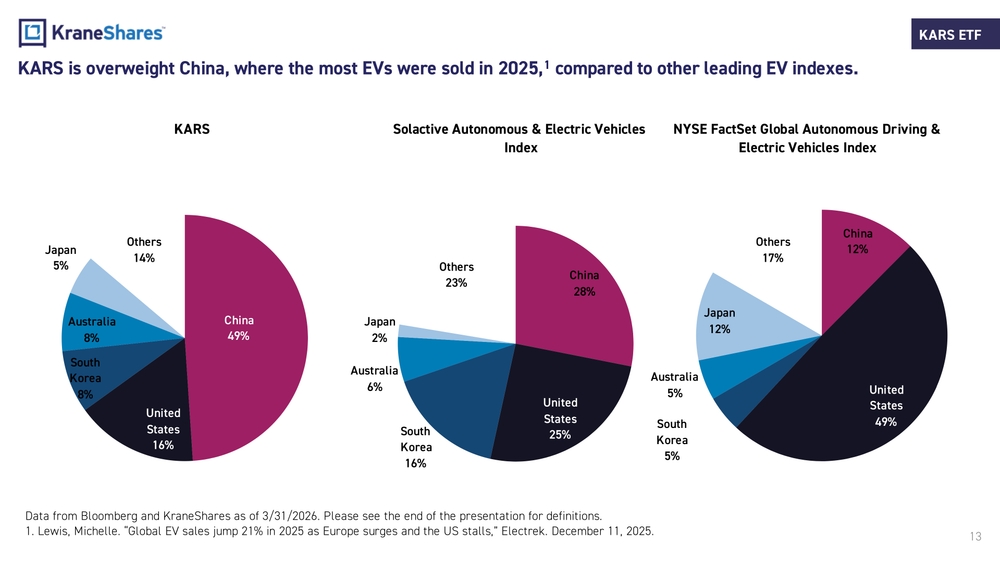
KARS is overweight China, where the most EVs were sold in 2025, compared to other leading EV indexes.
KARS Geographic Breakdown
- China: 49%
- United States: 16%
- South Korea: 8%
- Australia: 8%
- Japan: 5%
- Others: 14%
Solactive Autonomous & Electric Vehicles Index
- China: 28%
- United States: 25%
- South Korea: 16%
- Australia: 6%
- Japan: 2%
- Others: 23%
NYSE FactSet Global Autonomous Driving & Electric Vehicles Index
- China: 12%
- United States: 49%
- South Korea: 5%
- Australia: 5%
- Japan: 12%
- Others: 17%
Data from Bloomberg and KraneShares as of 3/31/2026.
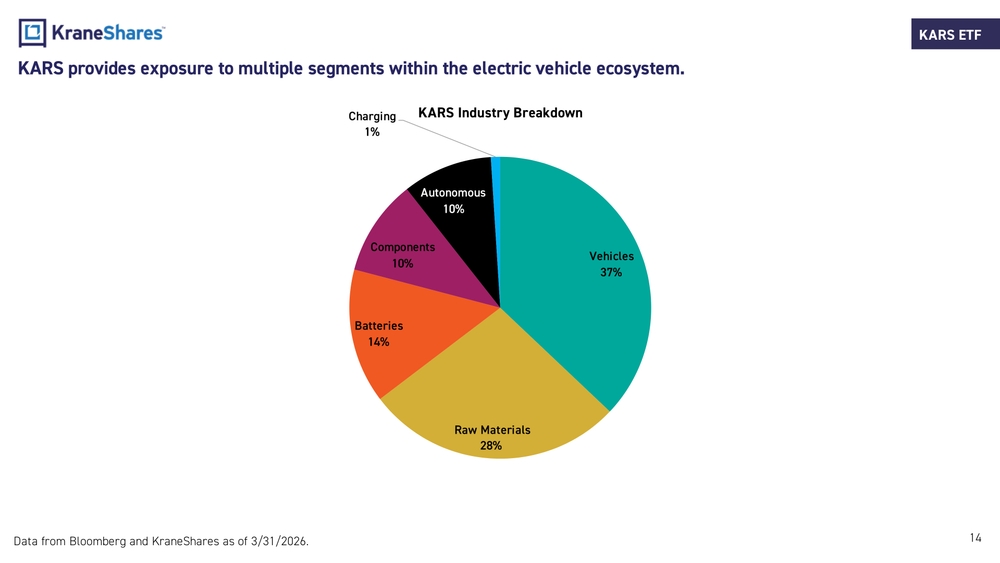
KARS provides exposure to multiple segments within the electric vehicle ecosystem.
KARS Industry Breakdown
- Vehicles: 37%
- Raw Materials: 28%
- Batteries: 14%
- Components: 10%
- Autonomous: 10%
- Charging: 1%
Data from Bloomberg and KraneShares as of 3/31/2026.
Catalysts for EVs & Future Mobility Going Forward
- Recovery in consumer sentiment and big-ticket consumption activities in China
- Battery or range innovation and proliferation of chargers
- Reaching global policy equilibrium
- Global cost per kWh potentially falling below the cost of ICE after reaching parity last year
- Oil price shocks causing anxiety at the pump and accelerating adoption
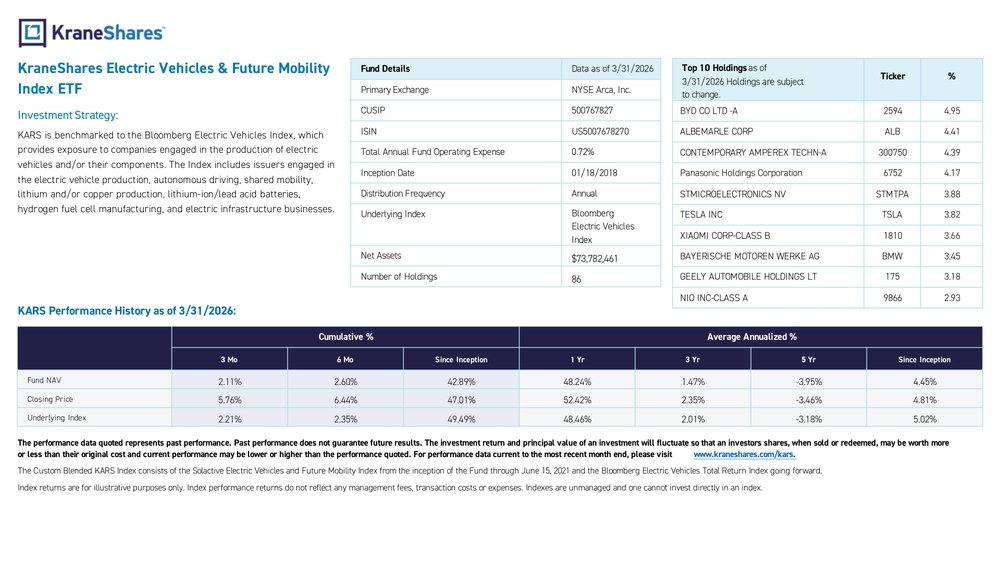
KraneShares Electric Vehicles & Future Mobility Index ETF
Investment Strategy:
KARS is benchmarked to the Bloomberg Electric Vehicles Index, which provides exposure to companies engaged in the production of electric vehicles and/or their components. The Index includes issuers engaged in the electric vehicle production, autonomous driving, shared mobility, lithium and/or copper production, lithium-ion/lead acid batteries, hydrogen fuel cell manufacturing, and electric infrastructure businesses.
Fund Details (Data as of 3/31/2026)
| Field | Value |
|---|---|
| Primary Exchange | NYSE Arca, Inc. |
| CUSIP | 500767827 |
| ISIN | US5007678270 |
| Total Annual Fund Operating Expense | 0.72% |
| Inception Date | 01/18/2018 |
| Distribution Frequency | Annual |
| Underlying Index | Bloomberg Electric Vehicles Index |
| Net Assets | $73,782,461 |
| Number of Holdings | 86 |
Top 10 Holdings as of 3/31/2026
| Ticker | % |
|---|---|
| BYD CO LTD -A (2594) | 4.95 |
| ALBEMARLE CORP (ALB) | 4.41 |
| CONTEMPORARY AMPEREX TECHN-A (300750) | 4.39 |
| Panasonic Holdings Corporation (6752) | 4.17 |
| STMICROELECTRONICS NV (STMTPA) | 3.88 |
| TESLA INC (TSLA) | 3.82 |
| XIAOMI CORP-CLASS B (1810) | 3.66 |
| BAYERISCHE MOTOREN WERKE AG (BMW) | 3.45 |
| GEELY AUTOMOBILE HOLDINGS LT (175) | 3.18 |
| NIO INC-CLASS A (9866) | 2.93 |
KARS Performance History as of 3/31/2026
| 3 Mo | 6 Mo | Since Inception | 1 Yr | 3 Yr | 5 Yr | Since Inception | |
|---|---|---|---|---|---|---|---|
| Fund NAV | 2.11% | 2.60% | 42.89% | 48.24% | 1.47% | -3.95% | 4.45% |
| Closing Price | 5.76% | 6.44% | 47.01% | 52.42% | 2.35% | -3.46% | 4.81% |
| Underlying Index | 2.21% | 2.35% | 49.49% | 48.46% | 2.01% | -3.18% | 5.02% |
KraneShares
Empowering investors with access to the world's most powerful growth themes through ETFs, private strategies, and innovative investment solutions.
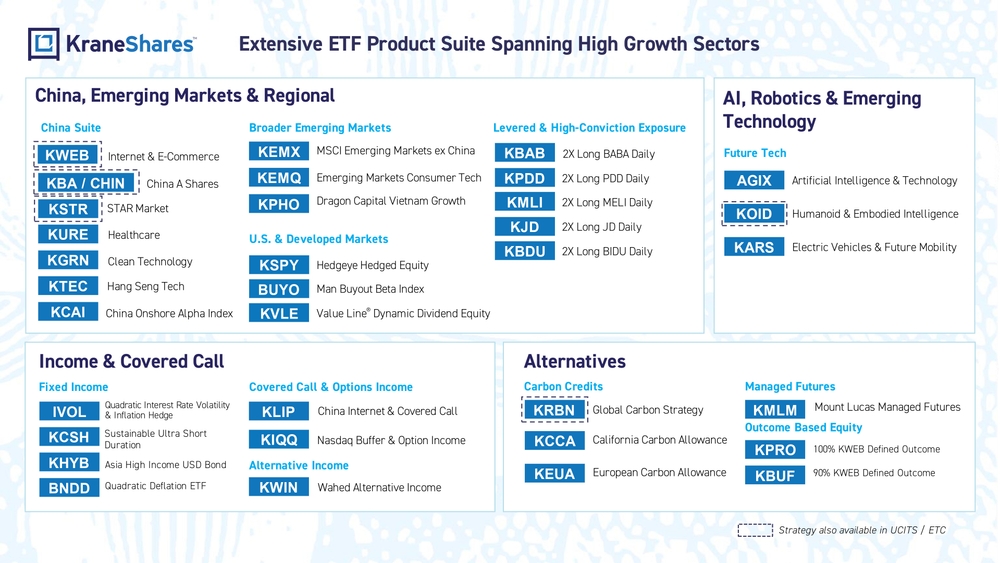
Extensive ETF Product Suite Spanning High Growth Sectors
China, Emerging Markets & Regional
China Suite
- KWEB - Internet & E-Commerce
- KBA / CHIN - China A Shares
- KSTR - STAR Market
- KURE - Healthcare
- KGRN - Clean Technology
- KTEC - Hang Seng Tech
- KCAI - China Onshore Alpha Index
Broader Emerging Markets
- KEMQ - Emerging Markets Consumer Tech
- KPHO - Dragon Capital Vietnam Growth
- KEMX - MSCI Emerging Markets ex China
U.S. & Developed Markets
- KSPY - Hedgeye Hedged Equity
- BUYO - Man Buyout Beta Index
- KVLE - Value Line® Dynamic Dividend Equity
Levered & High-Conviction Exposure
- KBAB - 2X Long BABA Daily
- KPDD - 2X Long PDD Daily
- KMLI - 2X Long MELI Daily
- KJD - 2X Long JD Daily
- KBDU - 2X Long BIDU Daily
AI, Robotics & Emerging Technology
Future Tech
- AGIX - Artificial Intelligence & Technology
- KOID - Humanoid & Embodied Intelligence
- KARS - Electric Vehicles & Future Mobility
Income & Covered Call
Fixed Income
- IVOL - Quadratic Interest Rate Volatility & Inflation Hedge
- KCSH - Sustainable Ultra Short Duration
- KHYB - Asia High Income USD Bond
- BNDD - Quadratic Deflation ETF
Covered Call & Options Income
- KLIP - China Internet & Covered Call
- KIQQ - Nasdaq Buffer & Option Income
Alternative Income
- KWIN - Wahed Alternative Income
Alternatives
Carbon Credits
- KRBN - Global Carbon Strategy
- KCCA - California Carbon Allowance
- KEUA - European Carbon Allowance
Managed Futures
- KMLM - Mount Lucas Managed Futures
Outcome Based Equity
- KPRO - 100% KWEB Defined Outcome
- KBUF - 90% KWEB Defined Outcome
Strategy also available in UCITS / ETC
Important Notes:
Carefully consider the Funds' investment objectives, risk factors, charges and expenses before investing. This and additional information can be found in the Funds' full and summary prospectus, which may be obtained by visiting www.kraneshares.com/kars. Read the prospectus carefully before investing.
Risk Disclosures:
Investing involves risk, including possible loss of principal. There can be no assurance that a Fund will achieve its stated objectives. Indices are unmanaged and do not include the effect of fees. One cannot invest directly in an index.
This information should not be relied upon as research, investment advice, or a recommendation regarding any products, strategies, or any security in particular. This material is strictly for illustrative, educational, or informational purposes and is subject to change.
A-Shares are issued by companies in mainland China and traded on local exchanges. They are available to domestic and certain foreign investors, including QFIs and those participating in Stock Connect Programs like Shanghai-Hong Kong and Shenzhen-Hong Kong. Foreign investments in A-Shares face various regulations and restrictions, including limits on asset repatriation.
The Fund may invest in derivatives, which are often more volatile than other investments and may magnify the Fund's gains or losses.
Narrowly focused investments typically exhibit higher volatility. The Fund's assets are expected to be concentrated in a sector, industry, market, or group of concentrations to the extent that the Underlying Index has such concentrations.
ETF shares are bought and sold on an exchange at market price (not NAV) and are not individually redeemed from the Fund.
The KraneShares ETFs and KFA Funds ETFs are distributed by SEI Investments Distribution Company (SIDCO), 1 Freedom Valley Drive, Oaks, PA 19456, which is not affiliated with Krane Funds Advisors, LLC, the Investment Adviser for the Funds, or any sub-advisers for the Funds.
Index Definitions:
Solactive Autonomous & Electric Vehicles Index: The Solactive Autonomous & Electric Vehicles Index is an equity index designed to track the price performance of companies that are, or are expected to be, actively involved in the electric vehicle and autonomous driving ecosystem. It includes: Electric vehicle manufacturers, Producers of electric-vehicle components and key materials (such as batteries and relevant raw materials), Companies developing or supplying autonomous-vehicle technologies (sensors, mapping, AI, ADAS, ride-sharing, and connected-transport services). The index is calculated and maintained by Solactive AG, uses free-float market-cap weighting with thematic screening, and is reviewed and reconstituted on a regular schedule (ordinary adjustments twice a year). The Solactive Autonomous & Electric Vehicles Index was launched on April 16, 2018.
NYSE FactSet Global Autonomous Driving & Electric Vehicles Index: A rules-based equity benchmark designed to track the performance of globally listed companies involved in the development of autonomous driving and electric vehicles, including producers of autonomous or electric vehicles, batteries, and related technologies and components (such as sensors, chips, and software for self-driving systems). The index was launched on January 25, 2019.
Term Definitions:
Global Electric Vehicle (EV) Sales as % of Light Vehicle Sales: The percentage of light vehicles worldwide that are fully electric. In the auto industry, a light vehicle is generally a road vehicle with a relatively low gross vehicle weight, typically covering passenger cars and smaller trucks/SUVs rather than heavy trucks or buses.