IVOL White Paper
by Kraneshares
For Institutional Use Only. Not for Retail Distribution.
F
IVOL White Paper:
Opportunities in Fixed Income
This white paper seeks to explain why investors may want to consider an allocation to IVOL . We begin with a summary of the fund itself and how to position the fund within a portfolio .
We then explore current as well as future potential market conditions. In doing so, we ex amine IVOL’s potential diversification benefits to help explain how an allocation can help complete traditional core fixed income in different macro environments such as stagflation, risk -off, or risk-on.
In setting forth this argument, we rely upon historical data. Of course, past performance does not guarantee future results. Like all investments , IVOL may perform well in certain market conditions and not as well in others . We will attempt to illustrate a range of outcomes. Also, like all assets, IVOL has its own set of risks. We set these forth in greater detail in the IVOL Risk Profile section later in the paper.
Nancy Davis
CIO & Portfolio Manager
Quadratic Capital Management
2
For Institutional Use Only. Not for Retail Distribution. Contents
Executive Summary ................................ ................................ ................................ ................. 3
Key Features ................................ ................................ ................................ ............................ 4
IVOL’s Potential Role in a Portfolio ................................ ................................ .......................... 6
IVOL: Why Not TIPS Alone ................................ ................................ ................................ ....... 7
IVOL in Various Market Environments ................................ ................................ ..................... 9
• IVOL during Periods of Recession (“Risk Off”) ................................ ...................... 10
• IVOL during Stagflation: Inflation and Lower Growth ................................ .......... 12
• IVOL during Periods of “Risk On” ................................ ................................ ......... 13
IVOL’s Risk Profile ................................ ................................ ................................ .................. 16
About Quadratic Capital ................................ ................................ ................................ ........ 17
Definitions ................................ ................................ ................................ ............................. 17
Important Information ................................ ................................ ................................ ........... 19
About the Author ................................ ................................ ................................ ................... 20
3 For Institutional Use Only. Not for Retail Distribution. Executive Summary
• IVOL has paid out at least 30 bps every month for over 7 years in a row1.
• IVOL employs a unique tax strategy that allows its shareholders to keep potentially more of their monthly income than regular US Treasury holdings on an after -tax basis. Distributions for tax years 2022, 2023, 2024, and 2025 were not taxable .2
• Since inception, IVOL has been able to diversify a portfolio of stocks and bonds, including a correlation of -0.02 to equities, 0.07 to high yield credit and 0.06 to the VIX. These low correlations should be attractive to investors looking to lower the overall volatility of their portfolios and complement their core fixed income.3
• IVOL is rooted in the basics. The portfolio invests in only three things. Roughly 80% of the fund is US Treasury Bonds, in the form of Treasury Inflation -Protected Securities (TIPS) or cash . The balance is comprised of fully funded long options on the i nterest rate curve .
• IVOL addresses the short volatility position inherent in most bond portfolios. For
instance, 1/3 of the Bloomberg US Aggregate Bond Index (“the AGG”) is short options
due to its mortgage exposure (US homeowners are long option to prepay) and callable
bonds (the corporate issuer is long the option). Adding IVOL to the AGG provides
additional diversification and can help offset the embedded short vol position.
1 The fund started paying distributions in July 2019 of at least 30bps a month through June 2026. For IVOL’s
standard performance and 30 day SEC yield as of the most recent calendar quarter, please click here
Distributions may contain a return of capital.
2 The tax treatment of IVOL’s distributions is potentially highly compelling. This is because the options inside of
IVOL receive ordinary tax treatment, which may be beneficial to IVOL’s shareholders. At the end of the year, we
look at the fund’s distributio ns vs. the fund’s net income. Net income includes any bond interest income less
realized losses from the options, which are treated as ordinary assets and not as capital assets. If the fund’s net
income is less than the distribution, the difference will be treated as a return of capital and not taxed. Investors
should not expect that distributions will not be taxed in the future.
3Daily correlation from 5/14/2019 to 3/31/2026 using the S&P 500 Index, iBoxx High Yield Corp Bond Index and
Gold Spot price quoted as US Dollars per Troy Ounce.
In the year of its launch, IVOL won the “Best New US Fixed Income ETF for 2019” award from ETF.com. IVOL bested other finalists which included funds issued by Nuveen, VanEck, Goldman Sachs and Blackrock.
4
For Institutional Use Only. Not for Retail Distribution. Key Features
IVOL is rooted in the basics. The portfolio invests in only three things. Roughly 80% of the IVOL
portfolio is composed of US Treasury Bonds, in the form of Treasury Inflation -Protected
Securities (TIPS). Th e balance of the portfolio is comprised of cash and fully funded long fixed
income options.
Its use of options m ay make IVOL sound complicated , but one can draw a clear but opposite
parallel with mortgage -backed securities and callable bonds . Consider that an investor in
fixed -rate mortgages . That investor is long Fannie or Freddie bonds but those bonds come
with an embedded short option position . The mortgage investor is short the prepayment
option to the homeowner. Similarly, investors in callable bonds are short options to issuer s.
Issuers may call their bonds when funding conditions are more favorable to them, creating re -
investment risk for investors . IVOL, on the other hand, is long Treasuries and long options.
IVOL’s options are fully funded, so the maximum downside is known and limited to the market
value of the options.
As its prospectus s tates , IVOL “seeks to hedge relative interest rate movements - whether these movements arise from falling short -term interest rates or rising long -term - and to benefit from market stress when fixed income volatility increases. IVOL also provides the potential for enhanced inflation -protected income. ” IVOL has paid its investors a minimum of 30 bps per month for over 6 years1.
Distributions for tax years 2022, 2023, 2024, and 2025 were not taxable . This is because IVOL utilizes a sophisticated tax strategy to harvest possible negative ordinary income, which can be used to offset the interest income from the Treasuries. The fund also utilizes a passive TIPS index to access tax efficiencies of trading Treasuries in kind, with the potential to benefit IVOL’s shareholders. Since IVOL accesses the tax efficiencies of trading Treasuries in kind, IVOL has not generated capital gains taxes for its shareholders2.
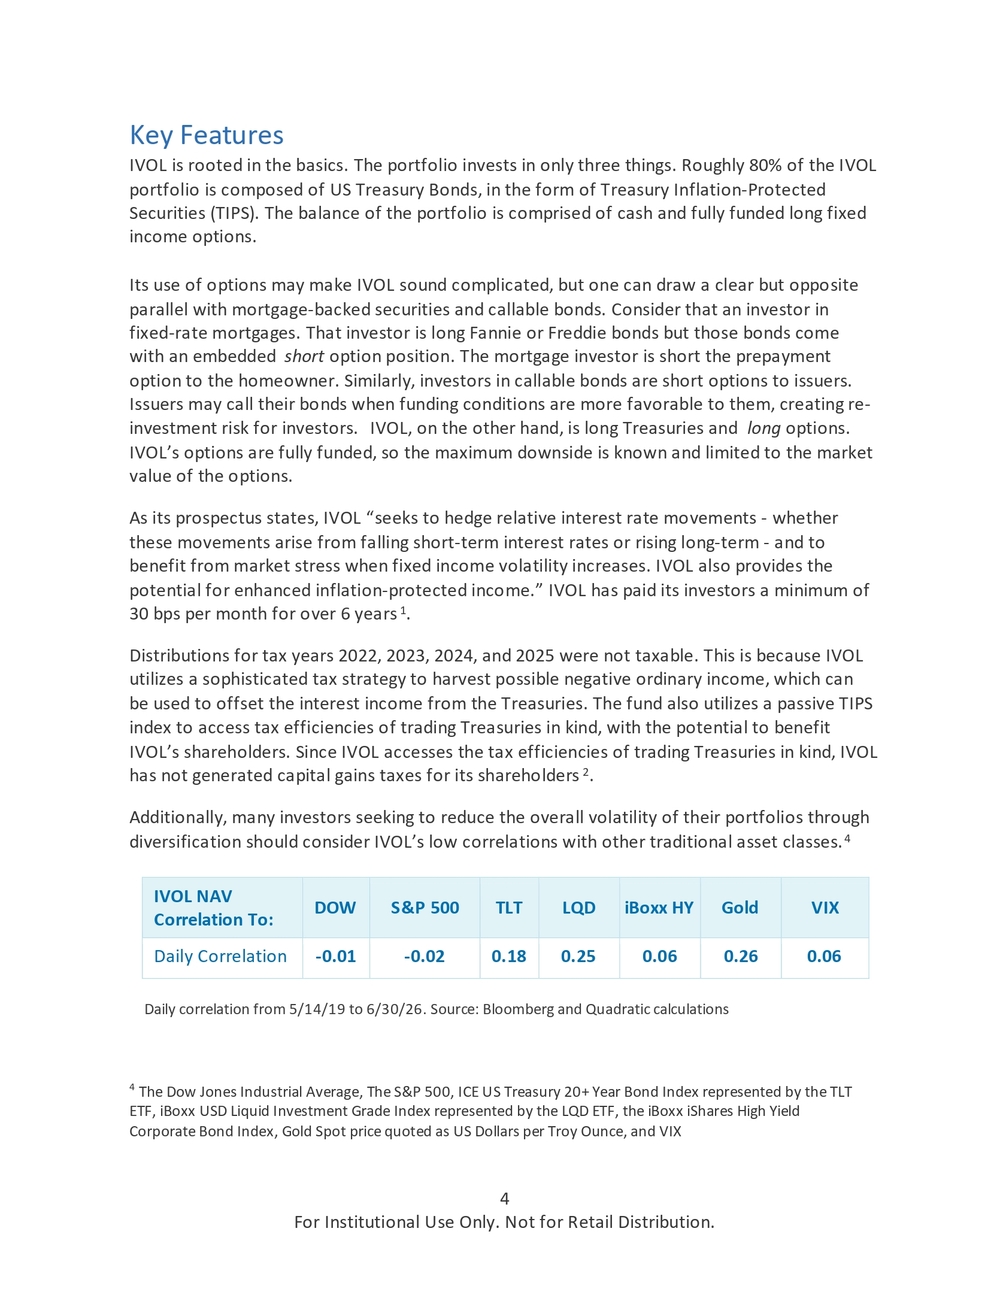
Additionally, many investors seeking to reduce the overall volatility of their portfolio s through diversification should consider IVOL’s low correlations with other traditional asset classes.4
IVOL NAV
Correlation To: DOW S&P 500 TLT LQD iBoxx HY Gold VIX
Daily Correlation -0.01 -0.02 0.18 0.25 0.06 0.26 0.06
4 The Dow Jones Industrial Average, The S&P 500, ICE US Treasury 20+ Year Bond Index represented by the TLT ETF, iBoxx USD Liquid Investment Grade Index represented by the LQD ETF , the iBoxx iShares High Yield Corporate Bond Index, Gold Spot price quoted as US Dollars per Troy Ounce , and VIX Daily correlation from 5/14/19 to 6/30/26. Source: Bloomberg and Quadratic calculations
5 For Institutional Use Only. Not for Retail Distribution. What makes IVOL unique is that it is long interest rate volatility via its access to the OTC fixed income options market. This is the key to IVOL’s many applications. It also means that IVOL may perform well in market stress when volatility increases and correlations across asset classes increase.
IVOL’s options are not swaptions . While swaptions ( upon which the MOVE index is based) refer to the level of swap rates, IVOL’s options refer to the level of the swap curve . Not only is IVOL’s implied vol cheaper than swaption vol , the term structure of IVOL’s vol tends to exhibit more backwardat ion due to the term structure of implied correlation . This is the opposite of the equity vol market and some parts of the swaption vol market , which tend to have upward sloping term structures . Since IVOL is always long only fully funded options, we are always long gamma and long vol . So, if nothing changes, IVOL’s longer dated options benefit from positive roll due to the term structure of vol.
While IVOL seeks to profit from increased market stress, it does not require doomsday scenarios to perform well. IVOL investors do not have to sell the opportunity for future upside in order to potentially hedge against a downturn.
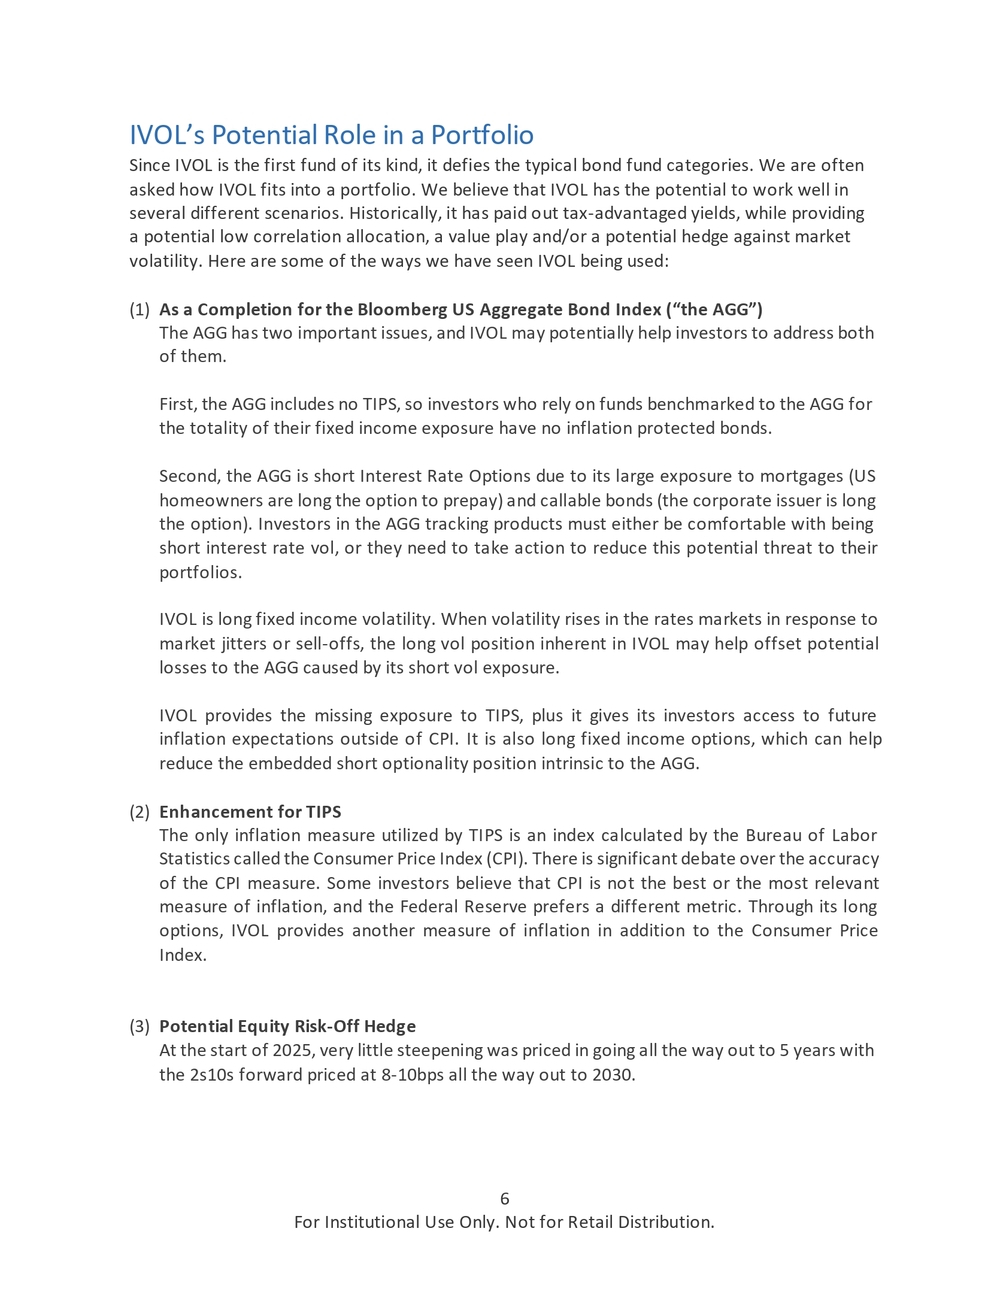
Investors unfamiliar with IVOL may find it helpful to consider some of the factors that impact the value of the IVOL portfolio:
Factors that Impact IVOL Increasing Decreasing
TIPS Bond Price ✓
Interest Rate Volatility ✓
Expectations for More Fed Cuts or
Lower Short -Dated Interest Rates ✓
Long -Dated Interest Rates ✓
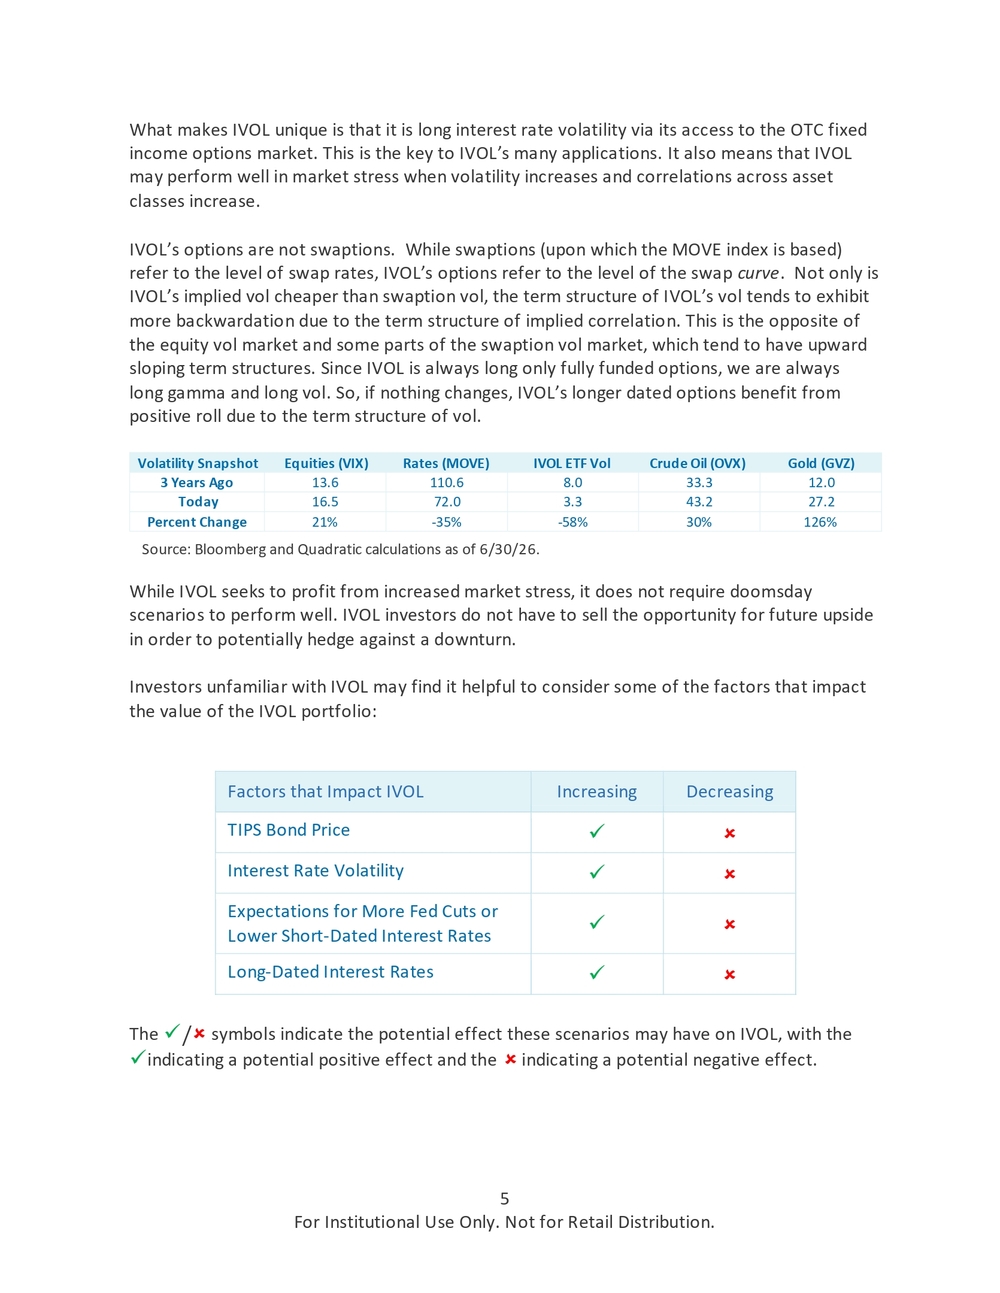
The ✓/ symbols indicate the potential effect these scenarios may have on IVO L, with the ✓indicating a potential positive effect and the indicating a potential negative effect . Volatility Snapshot Equities (VIX) Rates (MOVE) IVOL ETF Vol Crude Oil (OVX) Gold (GVZ) 3 Years Ago 13.6 110.6 8.0 33.3 12.0 Today 16.5 72.0 3.3 43.2 27.2 Percent Change 21% -35% -58% 30% 126%Source: Bloomberg and Quadratic calculations as of 6/30/26.
6
For Institutional Use Only. Not for Retail Distribution. IVOL’s Potential Role in a Portfolio
Since IVOL is the first fund of its kind, it defies the typical bond fund categories. We are often
asked how IVOL fits into a portfolio. We believe that IVOL has the potential to work well in
several different scenarios . Historically, it has paid out tax -advantaged yields, while providing
a potential low correlation allocation, a value play and/or a potential hedge against market
volatility . Here are some of the ways we have seen IVOL being used:
(1) As a Completion for the Bloomberg US Ag gregate Bond Index (“the AGG”)
The AGG has two important issues, and IVOL may potentially help investors to address both
of them.
First, t he A GG includes no TIPS , so investors who rely on funds benchmarked to the AGG for the totality of their fixed income exposure have no inflation protected bonds.
Second, the A GG is short Interest Rate Options due to its large exposure to mortgages (US homeowners are long the option to prepay) and callable bonds (the corporate issuer is long the option) . Investors in the AGG tracking products must either be comfortable with being short interest rate vol , or they need to take action to reduce this potential threat to their portfolios.
IVOL is long fixed income volatility. When volatility rises in the rates markets in response to market jitters or sell -offs, the long vol position inherent in IVOL may help offset potential losses to the AGG caused by its short vol exposure.
IVOL provides the missing exposure to TIPS, plus it gives its investors access to future inflation expectations outside of CPI. It is also long fixed income options, which can help reduce the embedded short optionality position intrinsic to the A GG.
(2) Enhancement for TIPS
The only inflation measure utilized by TIPS is an index calculated by the Bureau of Labor
Statistics called the Consumer Price Index (CPI) . There is significant debate over the accuracy
of the CPI measure. Some investors believe that CPI is not the best or the most relevant
measure of inflation , and the Federal Reserve prefers a different metric . Through its long
options, IVOL provides another measure of inflation in addition to t he Consumer Price
Index.
(3) Potential Equity Risk -Off Hedge
At the start of 2025, very little s teepening was priced in going all the way out to 5 years with
the 2s10s forward priced at 8 -10bps all the way out to 2030.
7 For Institutional Use Only. Not for Retail Distribution. IVOL delivered a strong performance in 2025, as the US interest rate curve began to normalize. This steepening of the spot and forward 2s10s curves has caused IVOL ’s market price to outperform: IVOL +11.97%. After posting strong returns during the tariff announcement selloff, IVOL has continued to perform well as the equity markets recovered and rallied . Many other investments that performed well during the selloff then struggled when markets rallied.
In the event of another large risk-off event like the one in April 2025 , we could potentially see some additional re -pricing of monetary policy, and the market could quickly price in more interest rate cuts. This could make the yield curve steepen and potentially benefit the options inside IVOL.
Additionally , since IVOL is long options, its investors are long interest rate volatility. If implied interest rate volatility increases, that benefits the options. The interest rate volatility inside IVOL fell approximately 25% in 2024 and another 30% in 2025 . Volatility is a measure of how expensive options are in the markets. As uncertainty increases, the price of options and implied volatility tend to increase. When volatility is low, one can buy a larger quantity of options with the same dollar amount. How m any financial investments can offer such a potentially asymmetric risk/reward?
(4) Diversifi er
IVOL has shown very low correlations with most other asset classes since its launch in 2019 .
Holdings with such low correlation coefficients can be very attractive to investors looking to
temper large swings in their portfolios. Note that IVOL achieved these low correlations
during a time when most other assets were becoming more correlated with each other, not
less. Investors looking for diversification may want to consider whether there is a place for
IVOL in their portfolios.
IVOL: Why Not TIPS Alone
IVOL is a fixed income fund that is built using an allocation to Treasury Inflation -Protected
Securities (TIPS). But IVOL is different from other TIPS funds in that it is also long fixed -income
volatility via its portfolio of fully -funded rate options. Why? There are three main issues with
TIPS which IVOL seeks to solve:
- The only index of inflation used by TIPS is the Consumer Price Index (CPI) which is a massive, multi -input calculation involving hundreds of assumptions and calculated monthly by the Bureau of Labor Statistics (BLS) . There are a number of issues with CPI. Most obviously, roughly one-third of the entire measure is based on owner -occupied rent costs. It isn’t clear that this source of inflation is that important to institutional investors. Even the Fed itself does not use CPI as its primary gauge for inflation.
8 For Institutional Use Only. Not for Retail Distribution. 2. All TIPS are long duration. Even “short duration” TIPS are still long duration. This means that all TIPS fall in price when real interest rates move higher. IVOL seeks to solve this exposure and potentially to profit from higher long -date d rates which cause the yield curve to steepen.
- Inflation has no zero bound. Breakevens can fall well below zero. This can increase the
risks of holding short duration TIPS because the shorter breakevens tend to fall much
faster than longer term breakevens. During “risk off” periods, TIPS themselves may
struggle as equities sell-off and credit spreads widen. IVOL seeks to mitigate th is
downside risk to TIPS through its portfolio of fully funded options which can potentially
profit during sell-offs, either because volatility is rising or because the market prices in
lower -than -expected policy rates.
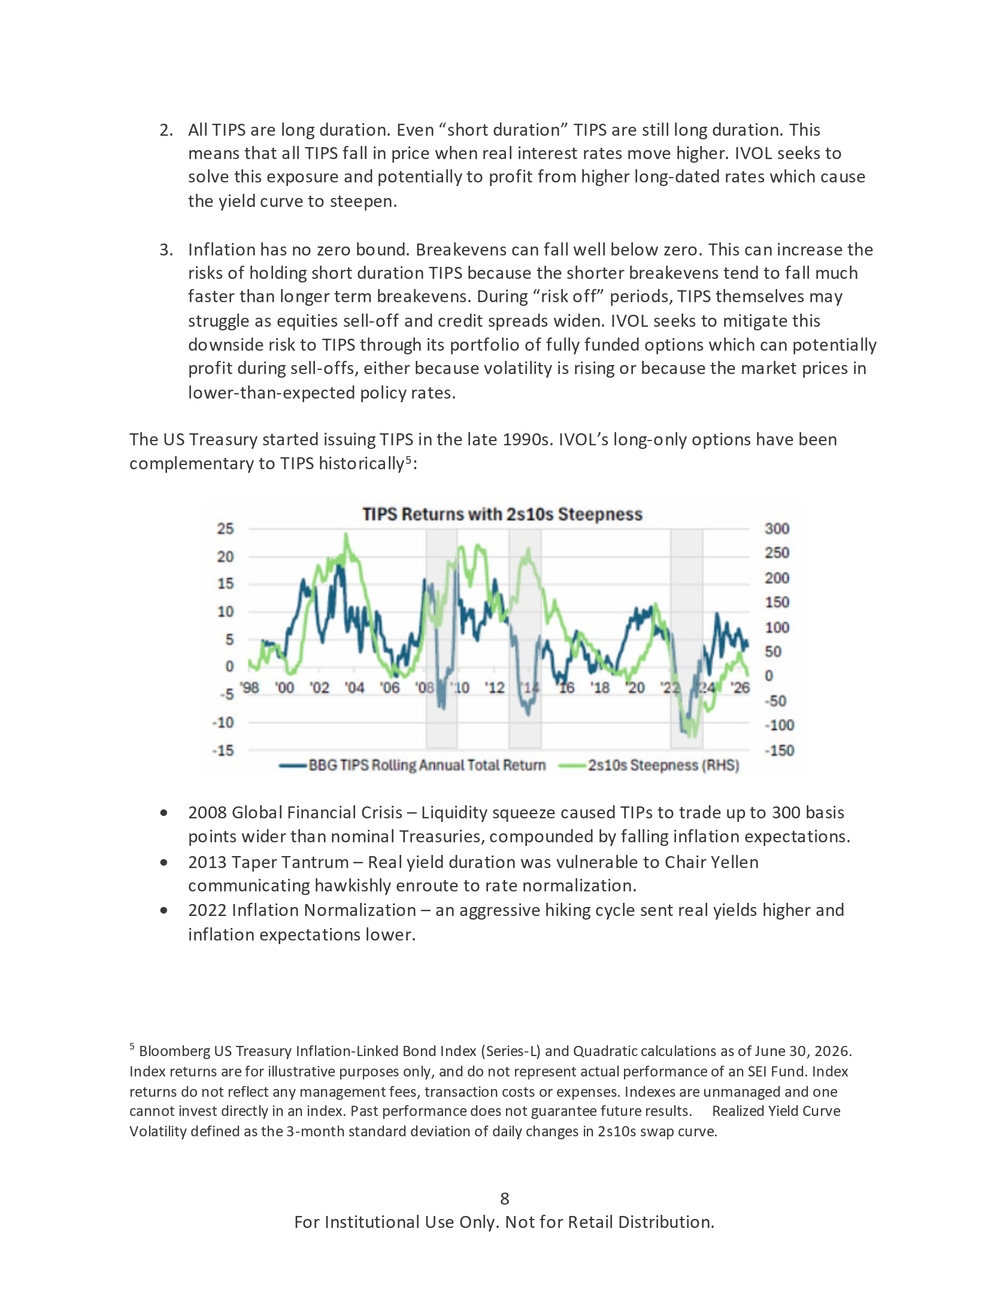
The US Treasury started issuing TIPS in the late 1990s. IVOL ’s long -only options have been complementary to TIPS historically5:
• 2008 Global Financial Crisis – Liquidity squeeze caused TIPs to trade up to 300 basis
points wider than nominal Treasuries, compounded by falling inflation expectations.
• 2013 Taper Tantrum – Real yield duration was vulnerable to Chair Yellen
communicating hawkishly enroute to rate normalization.
• 2022 Inflation Normalization – an aggressive hiking cycle sent real yields higher and
inflation expectations lower.
5 Bloomberg US Treasury Inflation -Linked Bond Index (Series -L) and Quadratic calculations as of June 30, 2026. Index returns are for illustrative purposes only, and do not represent actual performance of an SEI Fund. Index returns do not reflect any management fees, transaction costs or expenses. Indexes are unmanaged and one cannot invest directly in an in dex. Past performance does not guarantee future results. Realized Yield Curve Volatility defined as the 3 -month standard deviation of daily changes in 2s10s swap curve.
9
For Institutional Use Only. Not for Retail Distribution. • The yield curve steepened during the 2008 drawdown period due to lower short -term
rates and steepened during the 2013 drawdown period due to higher long -term rates.
Realized yield curve vol increased during each of the drawdown periods.
As discussed previously, distributions for tax years 2022, 2023, 2024 and 202 5 were not subject to income or capital gains taxes. This is because IVOL has a sophisticated tax strategy to harvest possible negative ordinary income, which can be used to offset the interest income from the Treasuries.
Finally, the fund utilizes a passive TIPS index to access tax efficiencies of trading Treasuries in kind , which potentially benefit s IVOL’s shareholders. Since IVOL access es the tax efficiencies of trading Treasuries in kind , this has helped IVOL to not generate capital gains taxes for its shareholders .
Many investors believe that US policy rates will continue to fall slowly , and that inflation is a thing of the past . But is the battle really over? Markets remain complacent with inflation, pricing little to no inflation premium in the future.
Investors should be closely watching the Treasury issuance, especially the impact on long -
term rates and the performance of highly leveraged companies. Policy rates and long -term
rates could have significant consequences on the normalization of the US inte rest rate curve.
IVOL in Various Market Environments
In this section, we discuss IVOL’s potential performance in three very different market
environments – “Risk Off,” “Stagflation,” and “Risk On.” We believe IVOL could work well in all
three scenarios, potentially functioning as an enhanced distribution gen erator, a low
correlation allocation, a value play and/or a potential hedge depending on how it is used in a
portfolio. Some of the key questions include:
• Has the Fed won its fight against inflation ? And what will the cost be to the economy in
terms of jobs and growth? Will further lowering inflation also require softer labor
markets?
• What about rising fiscal deficits and interest rate costs? How about tariffs and possible
tariff retaliation?
• How long will the distortion of the housing sector and concerns over the banking
sector persist? What will be the second and third order effects of these issues?
• Will geopolitical tensions intensify or abate? What are the potential ramifications for
the world economy?
• How should investors position portfolios for such a wide array of potential outcomes?
10
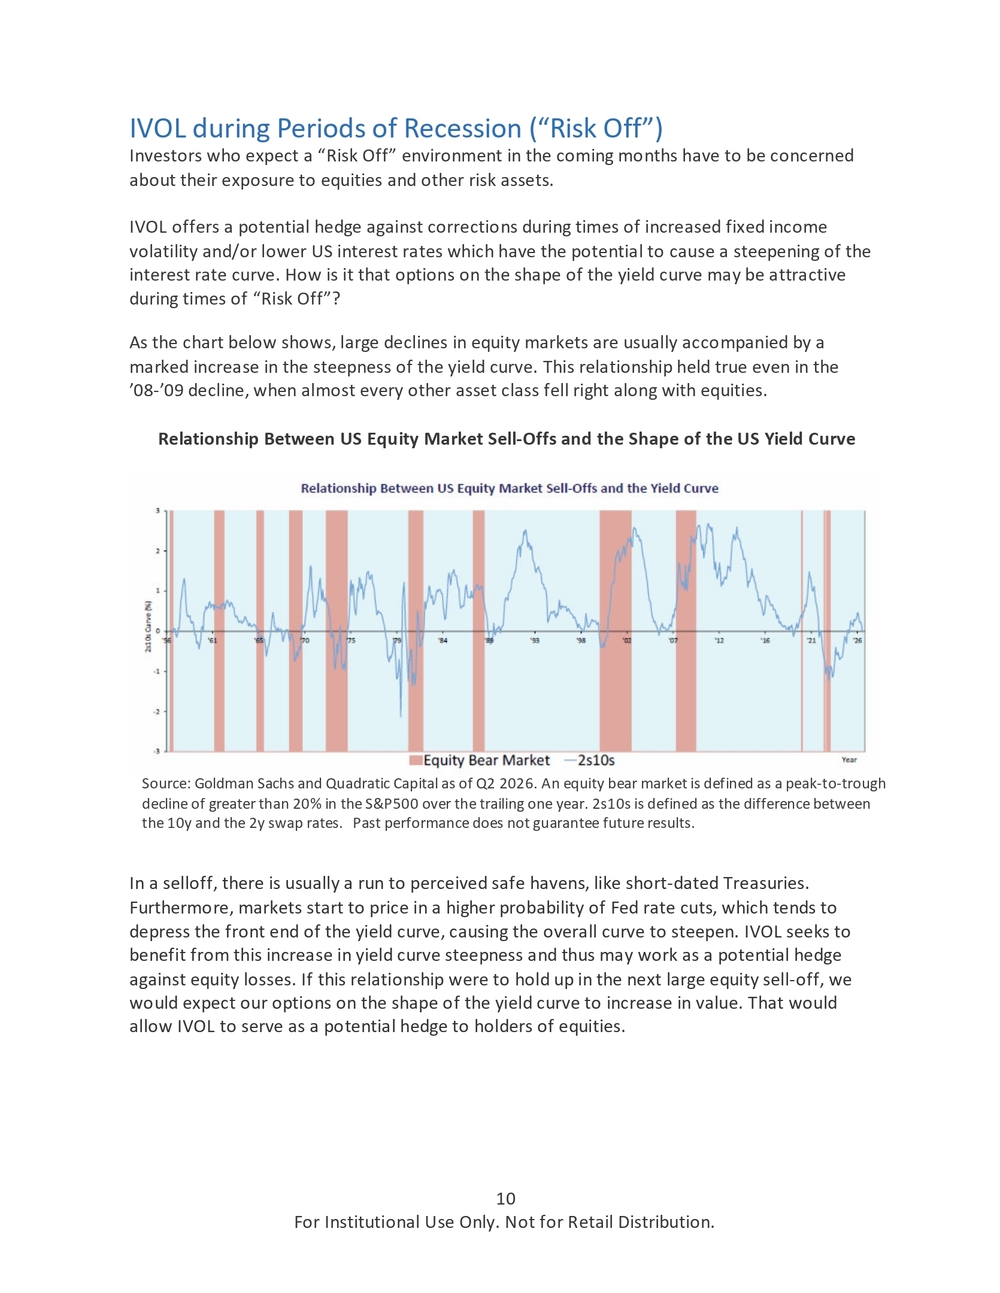
For Institutional Use Only. Not for Retail Distribution. Source: Goldman Sachs and Quadratic Capital as of Q2 2026. An equity bear market is defined as a peak -to-trough
decline of greater than 20% in the S&P500 over the trailing one year. 2s10s is defined as the difference between
the 10y and the 2y swap rates. Past performance does not guarantee future results.
IVOL during Periods of Recession (“Risk Off” )
Investors who expect a “ Risk Off” environment in the coming months have to be concerned
about their exposure to equities and other risk assets.
IVOL offers a potential hedge against corrections during times of increased fixed income volatility and/or lower US interest rates which have the potential to cause a steepening of the interest rate curve. How is it that options on the shape of the yield curve may be attractive during times of “ Risk Off”?
As the chart below shows, large declines in equity markets are usually accompanied by a marked increase in the steepness of the yield curve . This relationship held true even in the ’08-’09 decline , when almost every other asset class fell right along with equities.
Relationship Between US Equity Market Sell -Offs and the Shape of the US Yield Curve
In a selloff, there is usually a run to perceived safe havens, like short -dated Treasuries. Furthermore, markets start to price in a higher probability of Fed rate cuts, which tends to depress the front end of the yield curve, causing the overall curve to steepen. IVOL seeks to benefit from this increase in yield curve steepness and thus may work as a potential hedge against equity losses. If this relationship were to hold up in the next large equity sell -off, we would expect our options on the shape of the yield cu rve to increase in value. That would allow IVOL to serve as a potential hedge to holders of equities.
11
For Institutional Use Only. Not for Retail Distribution. Example s of IVOL’s Behavior in Risk Off Environment s:
• During the onset of COVID, the peak to trough in S&P500 was -33.92% from Feb 19th -
Mar 23rd of 2020. During this period, the AGG was -0.94% and IVOL NAV gained
+4.02%.
• During the banking crisis in March 2023: the period from March 6th to March 15th saw
the S&P 500 drop almost -4%, credit spreads widened and the IVOL NAV was up
14.19 % in this period.
• During the 7 -weeks spanning local equity highs and lows around “Liberation Day
2025”, S&P500 experienced a -18.90% drawdown. IVOL NAV gained +9.83% while the
AGG gained +1.03%.
• During some “risk off” periods, IVOL has not performed as well. For example, the
historic inversion of the interest rate curve which ended in early 2025, was the longest
and deepest inversion since 1988, when the swap market was created. This was a
challen ging period for IVOL due to the inversion and falling levels of interest rate
volatility. Similarly , in Q2 of 2026, IVOL’s market price was -6.75% as the yield curve
flattened on more hawkish Fed expectations due to the US -Iranian conflict. For IVOL’s
standard performance and 30 -day SEC yield, please click here.
As we watch the interplay of economic slowdown , instability , and persistent inflation , we believe uncertainty is likely to feed higher volatility . IVOL owns fixed income volatility in the form of interest rate options . So, the higher vola tility which often accompanies troubled markets could also be a boost for IVOL. Note that IVOL’s function as a potential hedge against falling risk asset prices does not require an investor to lose out on potential positive returns in a “Risk On” environment.
Mortgage investors model prepayments, durations, negative convexity, and everything else that impacts the embedded short option in mortgage bonds, including rate volatility. Prior to the GFC and QE, market participants hedged the short optionality in their mortgages by buying interest rate volatility.
Since IVOL owns options, the fund is long interest rate volatility and that may help investors hedge embedded prepayment risks inside other parts of their bond portfolio.
Investors should be prepared for multiple s cenarios in the coming years. If market volatility, and especially interest rate volatility, were to fall, IVOL might not perform well. This is because volatility is a key input in the price of options. Since IVOL owns options on the shape of the yield curve, a fall in volatility may l ower the value of the options in the portfolio. If, on the other hand, volatility w as to increase, the value of our options would be more likely to increase.
12
For Institutional Use Only. Not for Retail Distribution. IVOL during Stagflation: Inflation and Lower Growth
Once dismissed as a relic of the 1970s, stagflation may be poised for an unwelcome return.
Stagflation is a disastrous outcome for investors. Higher prices coupled with lower growth is a
potentially terrible environment to generate positive real returns. With inflation as measured
by CPI still well above the Fed’s preferred long -term average, even as fears persist about
recession, s tagflation is a real possibility. Geopolitical instability , higher energy prices, rising
inflation from tax cuts and fiscal spending, a growing deficit and higher tariffs could also be
catalysts for stagflation .
Investors might hope that a conservative bond portfolio would provide some protection in a stagflation ary environment, but stagflation could be difficult for holders of fixed income instruments. Bonds could be just as likely to sell off as equities, foiling the popular “risk parity” strategy.
Additionally, the bond market is susceptible to supply and demand dynamics that could lead to a decoupling of normal correlations. A classic example occurred during the immediate aftermath of the financial crisis from January to March 2009. During these mo nths, the equity market deteriorated along with the economic data. Investors who looked for a haven in Treasuries were not successful. 2-year US Treasuries sold off by 19 basis points (bps) and 10 y Treasuries sold off by 41bps due to higher supply as the Treasury sought to finance increasing deficits.
More recently, stocks and bonds have sold off together. In 2022, while US equity indexes were down by double digits, the bond markets offered no safe haven. Shorter - and longer -dated Treasuries, municipal bonds, mortgages, investment grade, high yield bonds and even gold all sold off right along with stocks. For example, long dated Treasuries lost more than the Nasdaq in 2022 ! 6
Looking back at the stagflationary periods of 1973 -75 and 1979 -82, i t’s important to note that neither TIPS nor the interest rate options market were in existence. Options on Treasury futures were listed on the CBOT in 1982 , and the US Treasury issued the first TIPS only in 1997.
But we can safely assume that the high realized inflation and rising inflation expectations of these periods would have benefited the TIPS asset class. Similarly, the extreme bond market volatility would have been supportive for higher implied vol. These t wo asset classes are the key components of IVOL. But investors relying on back testing and models using data from the 1970s will have no data on these two crucial asset classes during a time when they shined.
6 In 2022, the 30 year Treasury bond price (Cusip 912810TB4) was down -35.86% and the NASDAQ -100 Index was down -32.97%.
13 For Institutional Use Only. Not for Retail Distribution. As correlations increase and portfolios start behav ing in unexpected ways , investors look for solutions . Uncorrelated strategies like IVOL may be attractive. During historical stagflation ary periods , the US interest rate curve steepened as bond markets demanded higher term premium . During the stagflationary shock, hawkish Fed policy under Arthur Burns and Paul Volcker raised rates to 13% and 20% respectively . These extreme rate hikes flattened the yield curve until subsequent rate cuts were made to address the rapidly deteriorating growth outloo k and ultimately re -steepened the curve.
We certainly do not hope for a stagflation scenario in the US, but under such an interest rate scenario as described, IVOL’s options portfolio may help mitigate investor losses elsewhere in their portfolio .
IVOL during Periods of “Risk On”
Despite all the causes for concern, markets continue to power on. Perhaps the Fed actually
will manage to nail the “soft landing” and equities will rally further . Market expectations are
for inflation to remain well behaved in the future despite stubbornly high realized inflation .
Clearly a renewed appetite for risk and a growing economy would be positive for equities.
What about bonds?
We have long been conditioned to think of bonds as “safe.” But this is far from true for
investors who care about the mark -to-market price, especially about their longer -dated
bonds. Bonds are exposed to interest rate risk, commonly called duration. The higher the
duration, the higher the sensitivity of the bond to changes in interest rates. As interest rates
rise, the price of the bond declines, causing investors to mark down the price.
Despite the recent moves, the 10 -year Treasury remains expensive from a long -term historical perspective. While they don’t carry credit risk, long -duration Treasuries are far from risk -free in the current environment. The risk of owning otherwise “risk free” US Treasuries comes from the bonds’ duration. The longer the duration, the greater the risk. An investor who owns 30-year US Treasuries at today’s rates should expect to lose around 13.8% on the bond mark - to-market if the 30y yield rises by 1%. 10-year Treasuries will lose roughly 7.5% of their mark - to-market value if the 10y yield rises by 1%.
As rates move higher in our “Risk On” scenario, many investors may try to mitigate their duration risk by making exactly this trade - trading out of longer -dated bonds and into “short duration” bonds, typically those with a duration of 2 years or less. They do reduce their duration risk, but they do not eliminate it. Investors who are long fixed income will lose money on their mark -to-market if rates rise. It’s si mple bond math.
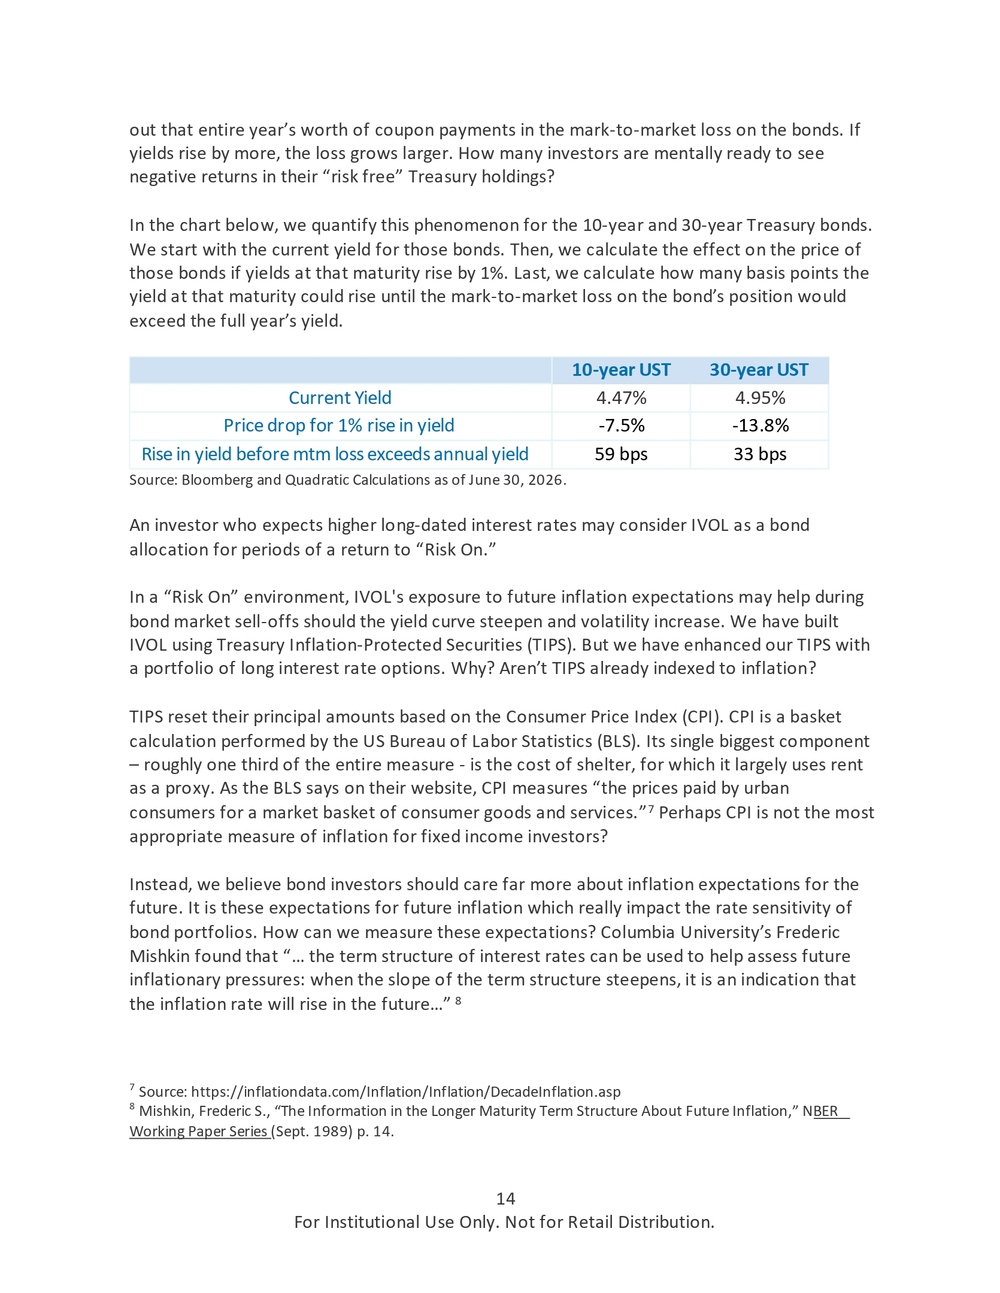
Furthermore, bond investors have little cushion to absorb these mark -to-market losses. With the 10 -year currently yielding roughly 4.47%, a rise of around 59 bps in 10 -year rates will wipe
14
For Institutional Use Only. Not for Retail Distribution. out that entire year’s worth of coupon payments in the mark -to-market loss on the bonds. If
yields rise by more, the loss grows larger. How many investors are mentally ready to see
negative returns in their “risk free” Treasury holdings?
In the chart below, we quantify this phenomenon for the 10 -year and 30 -year Treasury bonds.
We start with the current yield for those bonds . Then, we calculate the effect on the price of
those bonds if yields at that maturity rise by 1%. Last, we calculate how many basis points the
yield at that maturity could rise until the mark -to-market loss on the bond’s position would
exceed the full yea r’s yield.
Source: Bloomberg and Quadratic Calculations as of June 30, 2026 .
An investor who expects higher long -dated interest rates may consider IVOL as a bond allocation for periods of a return to “Risk On .”
In a “Risk On” environment , IVOL's exposure to future inflation expectations may help during bond market sell -offs should the yield curve steepen and volatility increase. We have built IVOL using Treasury Inflation -Protected Securities (TIPS). But we have enhanced our TIPS with a portfolio of long interest rate options. Why? Aren’t TIPS already indexed to inflation?
TIPS reset their principal amounts based on the Consumer Price Index (CPI). CPI is a basket calculation performed by the US Bureau of Labor Statistics (BLS). Its single biggest component – roughly one third of the entire measure - is the cost of shelter, for which it largely uses rent as a proxy. As the BLS says on their website, CPI measures “th e prices paid by urban consumers for a market basket of consumer goods and services.”7 Perhaps CPI is not the most appropriate measure of infla tion for fixed income investors?
Instead, we believe bond investors should care far more about inflation expectations for the future. It is these expectations for future inflation which really impact the rate sensitivity of bond portfolios. How can we measure these expectations? Columbia University’s Frederic Mishkin found that “… the term structure of interest rates can be used to help assess future inflationary pressures: when the slope of the term structure steepens, it is an indication that the inflation rate will rise in the future… ”8
7 Source: https://inflationdata.com/Inflation/Inflation/DecadeInflation.asp
8 Mishkin, Frederic S., “The Information in the Longer Maturity Term Structure About Future Inflation,” NBER
Working Paper Series (Sept. 1989) p. 14.
10-year UST 30-year UST
Current Yield 4.47% 4.95%
Price drop for 1% rise in yield -7.5% -13.8%
Rise in yield before mtm loss exceeds annual yield 59 bps 33 bps
15 For Institutional Use Only. Not for Retail Distribution. IVOL provides access to the term structure of the swap yield curve. It is important to note that this is different than the Treasury yield curve where the Fed conduct ed its QE purchases. IVOL provides exposure to a different measure of inflation expectations outside of the CPI Index which is cal culated by the BLS ’ CPI basket .
IVOL’s exposure to the swaps yield curve better reflects the global market’s expectations for interest rates in the future. It’s a measure of interest rates and inflation expectations that may be more relevant to investors beyond the owner -occupied rent calculation that makes up a third of the CPI basket. The swap yield curve also incorporates the market’s expectations for interest rates in the future plus other factors such as liquidity and term premium . Swap rates can trade higher or lower than Treasury yields with corresponding maturities. Currently , the steepness of the swaps curve is lower than the steepness of the Tre asury curve, allowing for a better entry level in the options used by IVOL. We see that as a value opportunity for IVOL investors to own exposure to a steeper curve at lower levels than Treasuries.
We believe that enhancing our TIPS with long interest rate options gives us both a broader and a more targeted way to own inflation expectations. Our interest rate options have the potential to increase in value with a normalization of inflation expectations that are not in the CPI basket.
If inflation expectations increase, we would expect to see the curve steepen as investors demand higher yield to hold longer -dated bonds. This would be an outcome entirely consistent with “Risk On.” Owning IVOL allows investors potentially to benefit from increases in long dated interest rates and/or a steepening of the yield curve. IVOL may be useful in cushioning the effect of such a move on investors’ bond portfolios.
For these reasons, we believe that IVOL represents a potential diversifier for investors concerned about the negative effects a normalization of risk pricing may have on their portfolio of nominal Treasuries or other bonds. Adding IVOL to a portfolio of Treasuries may cause that portfolio to outperform during periods of heightened inflation expectations, fixed income volatility or any time the curve steepens, either from short rates falling or long rates rising. Additionally, in the current environment, adding IVOL is a potential value play because inflation expectations remain below realized.
There are scenarios in which IVOL may underperform a portfolio of TIPS alone. These scenarios would include periods of falling inflation expectations. If the market believes inflation will fall further than currently expected, our options may lose value, a nd this would cause IVOL to underperform a portfolio composed exclusively of TIPS. Similarly, IVOL may underperform if fixed income volatility were to decrease, as it may negatively impact the value of our options. Our options also may lose value if the yi eld curve were to invert or flatten further.
16
For Institutional Use Only. Not for Retail Distribution. IVOL’s Risk Profile
Since IVOL owns volatility in its portfolio, it should benefit during times when interest rate
volatility increases. This does not mean there is no risk to owning IVOL. It is important to
understand that IVOL may also underperform or lose money when the interest rate curve
flattens or inverts .
Additionally, while IVOL does not borrow against its holdings, the OTC options used by IVOL may give rise to a form of asymmetry which may magnify the fund’s potential for gain and the risk of loss. The prices of options can be highly volatile, and the use of options can lower total returns.
It is important for investors to understand how OTC options work. OTC options generally have more flexible terms negotiated between the buyer and the seller. As a result, they are generally subject to greater credit risk and counterparty risk. OTC instrume nts may also be subject to greater liquidity risk.
As discussed previously, IVOL seeks to mitigate the risk associated with the potential impact of a steepening yield curve (“curve risk”) on the performance of U.S. government bonds by investing in OTC options designed to appreciate in value when the yield curve steepens. There is no guarantee that the Fund’s investments will completely eliminate the curve or inflation risk of its long positions in U.S. government bonds.
IVOL’s use of such instruments is not intended to mitigate credit risk, or non -curve interest rate risk. In addition, when the curve flattens, the Fund’s investments will generally underperform a portfolio comprised solely of U.S. government bonds. In a flattening curve environment, IVOL’s hedging strategy could result in disproportionately larger losses in the Fund’s options as compared to gains or losses in the U.S. government bond positions attributable to interest rate changes.
The Fund’s exposure to derivatives tied to interest rates subjects IVOL to potentially greater
volatility than investments in traditional securities, such as stocks and bonds. Investing in
derivatives tied to interest rates, including through options tied to the shape of the yield
curve, is speculative and can be extremely volatile.
Additionally, IVOL invests in debt securities, which typically decrease in value when interest rates rise. This risk is usually greater for longer term debt securities.
17
For Institutional Use Only. Not for Retail Distribution. About Quadratic Capital
Quadratic Capital is an innovative asset management firm founded in 2013 by Nancy Davis.
Ms. Davis serves as the firm’s Chief Investment Officer and is the portfolio manager for the
Quadratic Interest Rate Volatility and Inflation Hedge ETF (NYSE t icker: IVOL). IVOL was named
the “Best New US Fixed Income ETF of 2019 ” by ETF.com.
Quadratic is a registered Small/Minority Business Enterprise and a majority woman -owned firm. The firm is based in Greenwich, CT.
Definitions
Yield curve : The yield curve shows the prevailing yield of bonds having the same credit risk,
but different maturity dates. The most common yield curve is the treasury yield curve that
displays the 3m, 2y, 5y, 10y and 30y bond yields. The x -axis displays the maturity and the y -
axis displays the yield.
Long interest rate volatility : A strategy that purchases options in the market and benefits if
the implied volatility used to price these options increase.
OTC fixed income options : Options whose underlying are fixed income instruments and don’t
trade in the listed market or on an exchange. The options are traded in the over -the- counter
market directly between two parties.
CPI: The Consumer Price Index (CPI) is a metric that measures a basket of consumer goods and
services. Changes in the CPI are commonly used to assess changes in the cost of living. It is
used to identify periods of inflation or deflation.
Disinflation : It is the slowing of the pace of price inflation.
Risk parity : It is strategy used in portfolio management focused on the volatility of the
underlying asset instead of the allocation of capital. It relies on historical volatility and
correlation between assets to determine the optimal asset allocation.
Spread : Additional yield that a bond pays above the benchmark rate.
Risk On / Risk Off : Risk On is broadly defined as periods when equity prices are rising, overall
market sentiment is positive, and perceived risk is low. Risk Off is the opposite of Risk On.
Stagflation : Stagflation is an economic condition when there is slow economic growth
accompanied by or inflation.
Roll down : A roll down is the effect that happens to instruments purchased at a future price
that is different from the price today. As time goes by, the value of the instrument converges
from the future price to the present price as maturity is approached.
Spot : The spot price is the current price at which an asset is traded for immediate delivery.
Carry : Cost or benefit of holding a position over time assuming no changes in the market.
Implied Volatility : Implied volatility is a metric used to measure the market’s probability of
changes in the price of an instrument. Investors use this to price options contracts.
The Dow Jones Industrial Average (“Dow”) is an index that tracks 30 large, publicly -owned
companies trading on the New York Stock Exchange and the NASDAQ.
18
For Institutional Use Only. Not for Retail Distribution. The S&P 500 , (“S&P”), is a stock market index that measures the stock performance of 500
large companies listed on stock exchanges in the US.
The MSCI Emerging Markets (“MSCI EM”) Index captures large and mid -cap representation
across 26 Emerging Markets (EM) countries.
The iBoxx iShares High Yield Corporate Bond Index (HYG) is designed to reflect the
performance of USD denominated high yield corporate debt.
VIX is a CBOE index that represents equity volatility of 30 -day expectations of the S&P 500
equity index.
Bloomberg US Aggregate Bond Index (“Agg”) The Bloomberg US Aggregate Bond Index is a
broad -based flagship benchmark that measures the investment grade, US dollar -
denominated, fixed -rate taxable bond market. The index includes Treasuries, government -
related and corporate securities, MBS (ag ency fixed -rate pass -throughs), ABS and CMBS
(agency and non -agency).
ICE US Treasury 20+ Year Bond Index (TLT) which measures the performance of public
obligations of the U.S. Treasury that have a remaining maturity greater than twenty years .
iBoxx USD Liquid Investment Grade Index (LQD ) the USD denominated, investment grade,
corporate bond market.
LBMA Gold Price is the global benchmark prices for unallocated gold delivered in London.
ICE BofA MOVE Index (MOVE) measures US bond market volatility by tracking a based of OTC
options on US interest rate swaps.
CBOE Crude Oil ETF USO VIX Index Index (OVX) is based on the CBOE VIX Methodology applied
to USO options and measures the market’s expectation of 30 -day volatility in crude oil prices.
CBOE Gold ETF GLD VIX Index (GVZ) is based on the CBOE VIX Methodology applied to options
on the GLD SPDR Trust.

19
For Institutional Use Only. Not for Retail Distribution. Important Information
For Institutional Use Only. Not for Retail Distribution.
This material represents the opinion of the manager. It should not be regarded as investment advice or recommendation of specific securities. Neither Quadratic Capital Management nor SIDCO and its affiliates provide tax advice. Please note that (i) any discussion of U.S. tax matters contained in this communication cannot be used by you for the purpose of avoiding tax penalties; (ii) this communi cation was written to support the promotion or marketing of the matters addressed herein; and (iii) you should seek advice based on your particular circumstances from an independent tax advisor.
The fund’s investment objectives, risks, charges and expenses must be
considered carefully before investing. The prospectus contains this and other
important information about the company and may be obtained by calling +1 -
833-IVOL -ETF. Please read it carefully before investing.
Investing involves risk, including possible loss of principal. There can be no assurance that a
Fund will achieve its stated investment objectives. The Fund does not seek to mitigate credit
risk, non -curve interest rate risk, or other factors influencing t he price of U.S. government
bonds, which factors may have a greater impact on the bonds’ returns than the U.S. interest
rate curve or inflation. There is no guarantee that the Fund’s investments will eliminate or
mitigate curve risk, or inflation risk on l ong positions in U.S. government bonds. In addition,
when the forward U.S. interest rate curve flattens, the Fund’s investments will
generally underperform a portfolio comprised solely of the U.S. government bonds. In a
flattening curve environment (a redu ction in the spread between shorter and longer term
interest rates), the Fund’s strategy could result in disproportionately larger losses in the
Fund’s options as compared to gains or losses in the U.S. government bond positions. The
Fund’s exposure to options subjects the Fund to gr eater volatility than investments in
traditional securities and may magnify the Funds’ gains or losses. The Fund is non -diversified
and therefore has concentration risk.
IVOL is distributed by SEI Investments Distribution Co. (SIDCO), 1 Freedom Valley Drive, Oaks, PA 19456. The Fund’s sub -adviser is Quadratic Capital Management LLC (Quadratic). SIDCO is not affiliated with Quadratic.
20 For Institutional Use Only. Not for Retail Distribution.
About the Author
Nancy Davis founded Quadratic Capital Management in 2013. She is the firm’s managing partner and serves as the portfolio manager for The Quadratic Interest Rate Volatility and Inflation Hedge ETF (NYSE Ticker: IVOL).
Before starting Quadratic, Nancy w orked at Goldman Sachs for nearly a decade, where she spent the majority of her time with the proprietary trading group. During her tenure, she played a pivotal role in the prop group and advanced to become the Head of Credit, Derivatives and OTC Trading for Goldman Sachs Principal Strategies. She was also a Portfolio Manager at JP Morgan’s hedge fund Highbridge Capital Management.
She has been the recipient of numerous industry recognitions. Barron’s named her to their Inaugural list of the "100 Most Influential Women in U.S. Finance." Institutional Investor called her a "Rising Star of Hedge Funds." The Hedge Fund Journal tapped her as one of "Tomorrow's Titans."
Nancy writes and speaks frequently about markets and investing. She has been profiled by The Wall Street Journal and Forbes , among others. She is a frequent guest on financial television.