KraneShares Defined Outcome ETFs | KWEB Buffer ETF
by Kraneshares
KraneShares Defined Outcome ETF Suite:
Risk Managed Strategies For China Internet Exposure
KPRO KBUF
6/30/2025
Introduction to KraneShares
About KraneShares
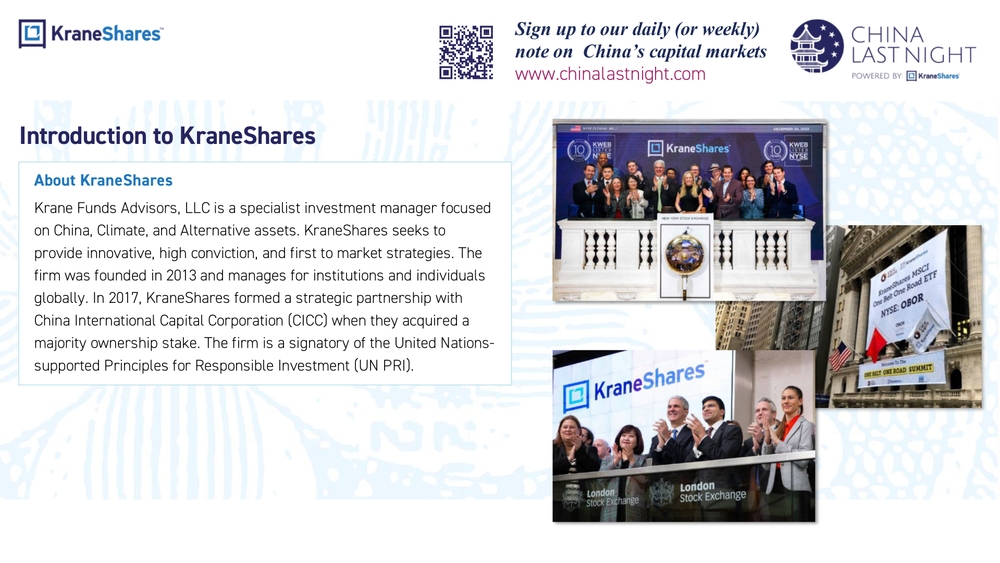
Krane Funds Advisors, LLC is a specialist investment manager focused on China, Climate, and Alternative assets. KraneShares seeks to provide innovative, high conviction, and first to market strategies. The firm was founded in 2013 and manages for institutions and individuals globally. In 2017, KraneShares formed a strategic partnership with China International Capital Corporation (CICC) when they acquired a majority ownership stake. The firm is a signatory of the United Nations-supported Principles for Responsible Investment (UN PRI).
Sign up to our daily (or weekly) note on China's capital markets: www.chinalastnight.com
Product Suite
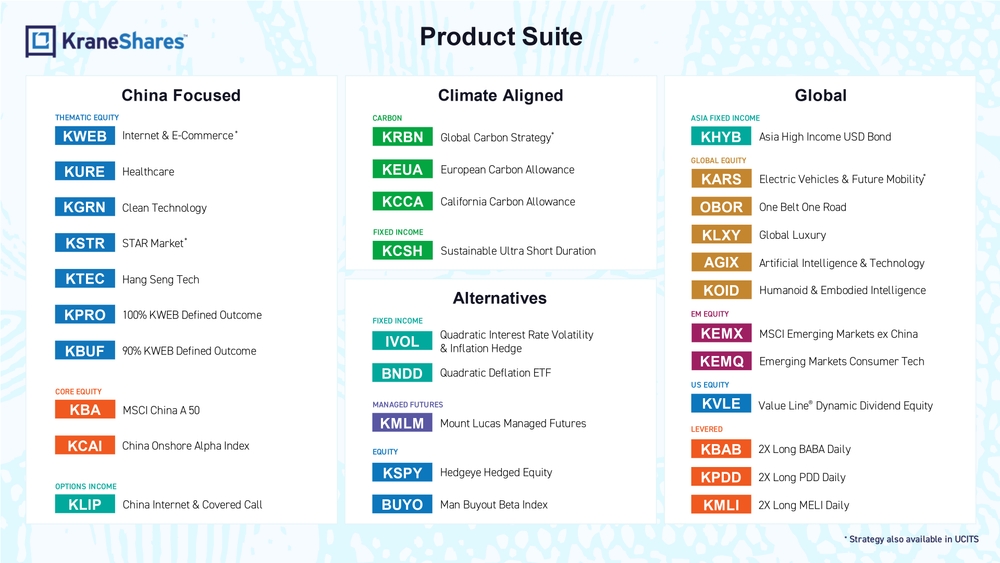
China Focused
Thematic Equity
- KWEB Internet & E-Commerce*
- KURE Healthcare
- KGRN Clean Technology
- KSTR STAR Market*
- KTEC Hang Seng Tech
- KPRO 100% KWEB Defined Outcome
- KBUF 90% KWEB Defined Outcome
Core Equity
- KBA MSCI China A 50
- KCAI China Onshore Alpha Index
Options Income
- KLIP China Internet & Covered Call
Climate Aligned
Carbon
- KRBN Global Carbon Strategy*
- KEUA European Carbon Allowance
- KCCA California Carbon Allowance
Fixed Income
- KCSH Sustainable Ultra Short Duration
Alternatives
Fixed Income
- IVOL Quadratic Interest Rate Volatility & Inflation Hedge
- BNDD Quadratic Deflation ETF
Managed Futures
- KMLM Mount Lucas Managed Futures
Equity
- KSPY Hedgeye Hedged Equity
- BUYO Man Buyout Beta Index
Global
Asia Fixed Income
- KHYB Asia High Income USD Bond
Global Equity
- KARS Electric Vehicles & Future Mobility*
- OBOR One Belt One Road
- KLXY Global Luxury
- AGIX Artificial Intelligence & Technology
- KOID Humanoid & Embodied Intelligence
EM Equity
- KEMX MSCI Emerging Markets ex China
- KEMQ Emerging Markets Consumer Tech
US Equity
- KVLE Value Line® Dynamic Dividend Equity
Levered
- KBAB 2X Long BABA Daily
- KPDD 2X Long PDD Daily
- KMLI 2X Long MELI Daily
Strategy also available in UCITS
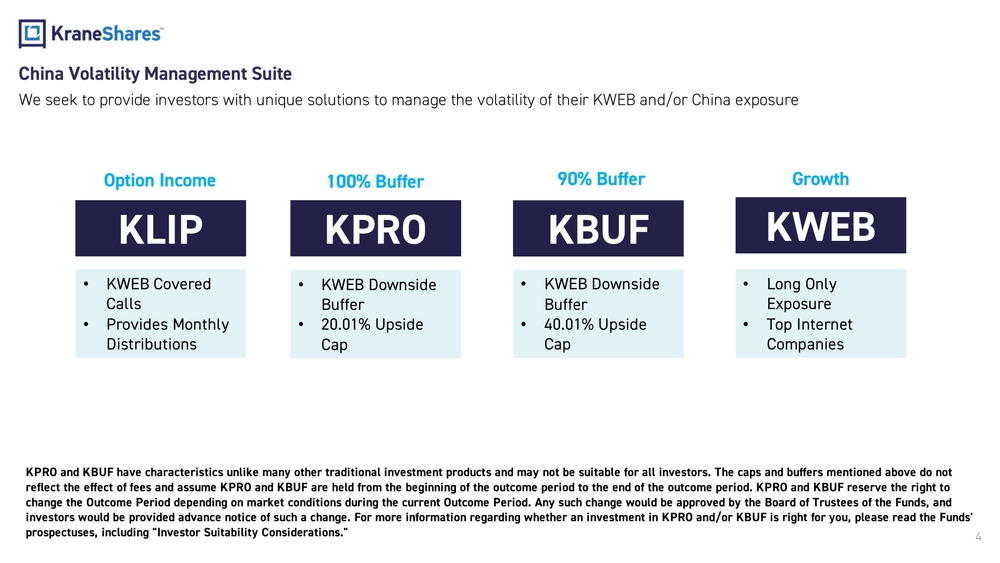
China Volatility Management Suite
We seek to provide investors with unique solutions to manage the volatility of their KWEB and/or China exposure
| Option Income | 100% Buffer | 90% Buffer | Growth | |
|---|---|---|---|---|
| Ticker | KLIP | KPRO | KBUF | KWEB |
| Feature 1 | KWEB Covered Calls | KWEB Downside Buffer | KWEB Downside Buffer | Long Only Exposure |
| Feature 2 | Provides Monthly Distributions | 20.01% Upside Cap | 40.01% Upside Cap | Top Internet Companies |
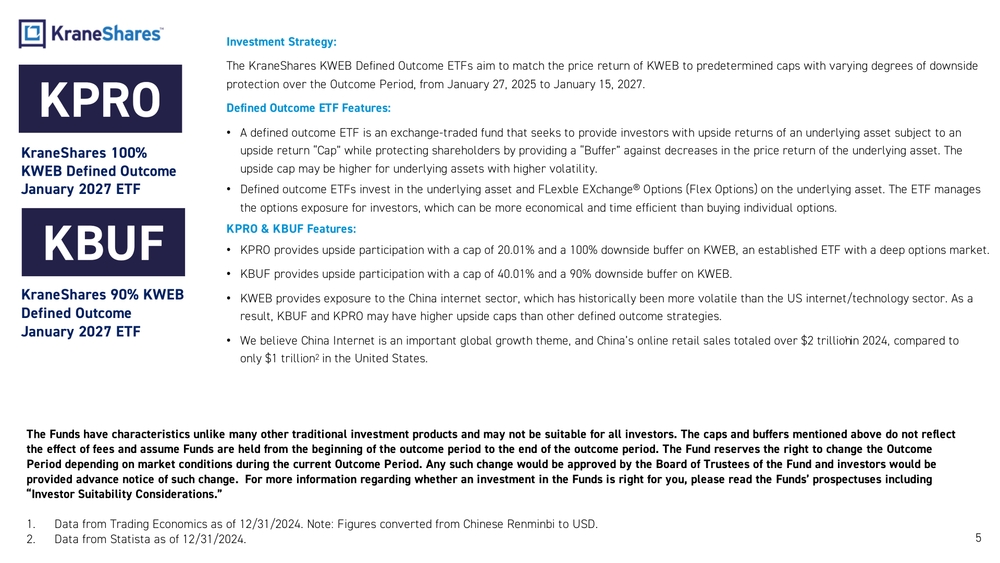
Investment Strategy
The KraneShares KWEB Defined Outcome ETFs aim to match the price return of KWEB to predetermined caps with varying degrees of downside protection over the Outcome Period, from January 27, 2025 to January 15, 2027.
Defined Outcome ETF Features
- A defined outcome ETF is an exchange-traded fund that seeks to provide investors with upside returns of an underlying asset subject to an upside return "Cap" while protecting shareholders by providing a "Buffer" against decreases in the price return of the underlying asset. The upside cap may be higher for underlying assets with higher volatility.
- Defined outcome ETFs invest in the underlying asset and FLexble EXchange® Options (Flex Options) on the underlying asset. The ETF manages the options exposure for investors, which can be more economical and time efficient than buying individual options.
KPRO & KBUF Features
- KPRO provides upside participation with a cap of 20.01% and a 100% downside buffer on KWEB, an established ETF with a deep options market.
- KBUF provides upside participation with a cap of 40.01% and a 90% downside buffer on KWEB.
- KWEB provides exposure to the China internet sector, which has historically been more volatile than the US internet/technology sector. As a result, KBUF and KPRO may have higher upside caps than other defined outcome strategies.
- We believe China Internet is an important global growth theme, and China's online retail sales totaled over $2 trillion in 2024, compared to only $1 trillion in the United States.
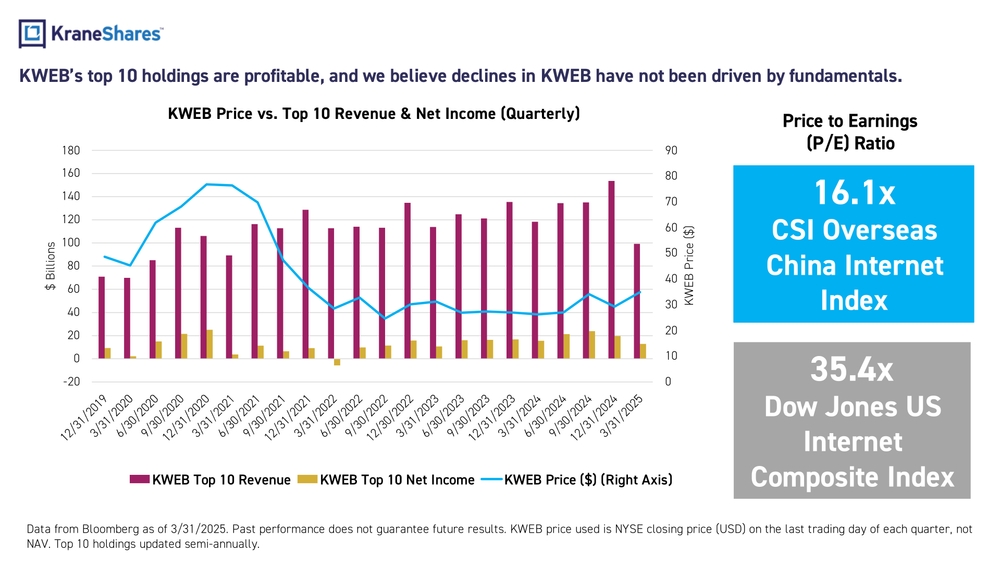
KWEB's top 10 holdings are profitable, and we believe declines in KWEB have not been driven by fundamentals.
KWEB Price vs. Top 10 Revenue & Net Income (Quarterly)
Chart showing KWEB Top 10 Revenue, KWEB Top 10 Net Income, and KWEB Price from 12/31/2019 to 3/31/2025
Price to Earnings (P/E) Ratio
- 16.1x CSI Overseas China Internet Index
- 35.4x Dow Jones US Internet Composite Index
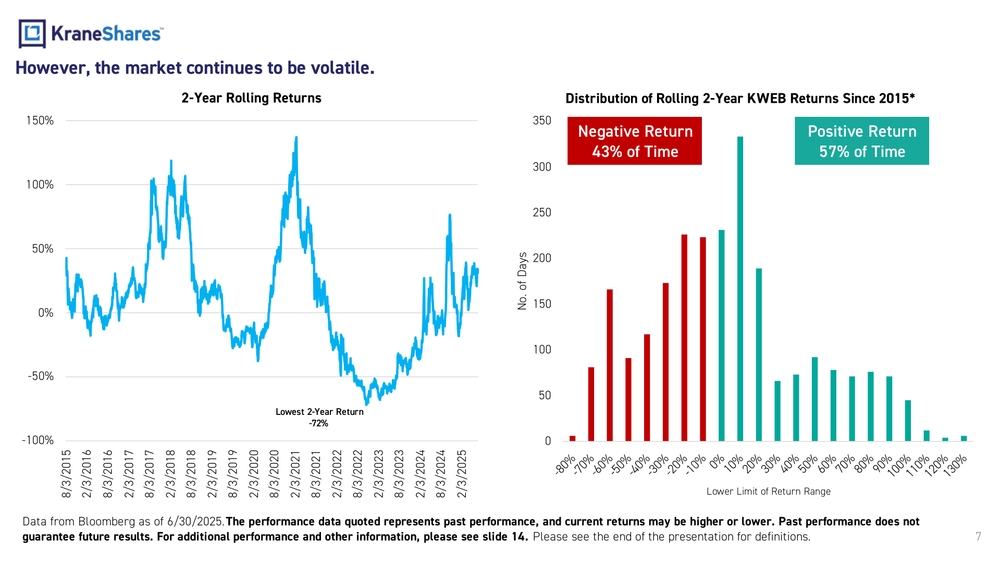
However, the market continues to be volatile.
2-Year Rolling Returns
Chart showing KWEB 2-year rolling returns from 8/3/2015 to 2/3/2025, with the lowest 2-year return at -72%
Distribution of Rolling 2-Year KWEB Returns Since 2015
- Negative Return: 43% of Time
- Positive Return: 57% of Time
- Lowest 2-Year Return: -72%
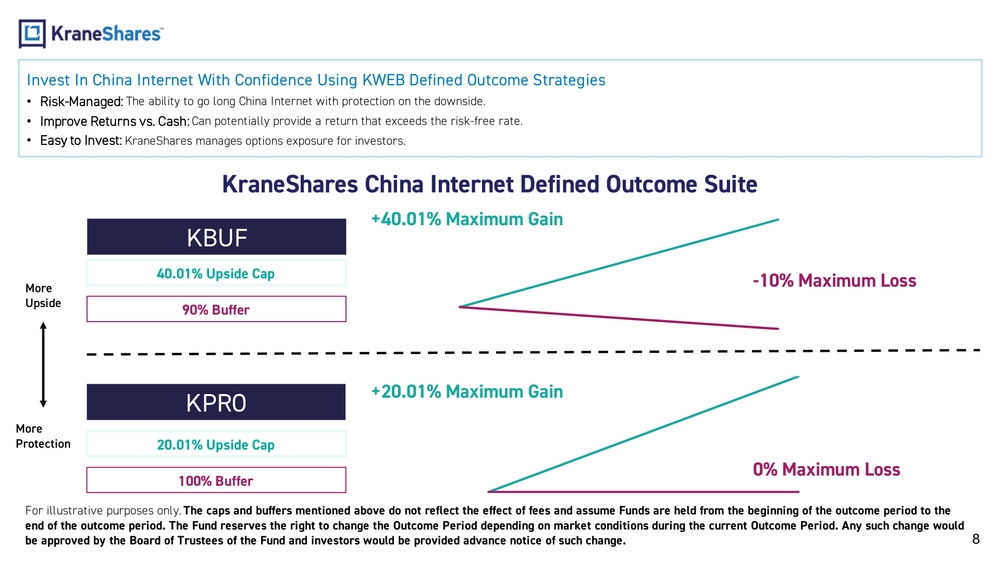
KraneShares China Internet Defined Outcome Suite
Invest In China Internet With Confidence Using KWEB Defined Outcome Strategies
- Risk-Managed: The ability to go long China Internet with protection on the downside.
- Improve Returns vs. Cash: Can potentially provide a return that exceeds the risk-free rate.
- Easy to Invest: KraneShares manages options exposure for investors.
Product Comparison
KBUF
- 40.01% Upside Cap
- 90% Buffer
- +40.01% Maximum Gain
- -10% Maximum Loss
- More Upside
KPRO
- 20.01% Upside Cap
- 100% Buffer
- +20.01% Maximum Gain
- 0% Maximum Loss
- More Protection
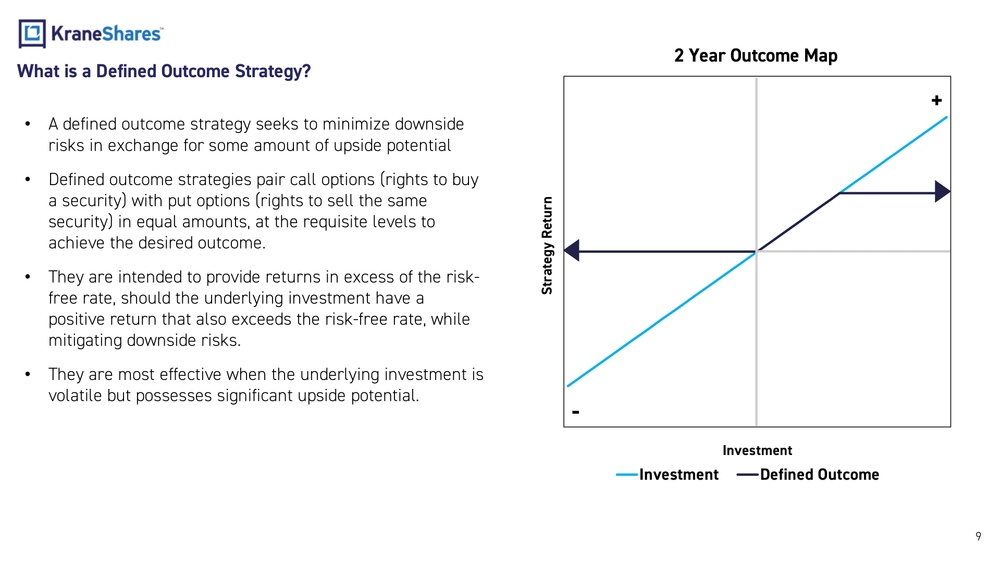
What is a Defined Outcome Strategy?
- A defined outcome strategy seeks to minimize downside risks in exchange for some amount of upside potential.
- Defined outcome strategies pair call options (rights to buy a security) with put options (rights to sell the same security) in equal amounts, at the requisite levels to achieve the desired outcome.
- They are intended to provide returns in excess of the risk-free rate, should the underlying investment have a positive return that also exceeds the risk-free rate, while mitigating downside risks.
- They are most effective when the underlying investment is volatile but possesses significant upside potential.
2 Year Outcome Map
Chart illustrating the relationship between Investment return (x-axis) and Strategy Return (y-axis), comparing a standard Investment line vs. a Defined Outcome line
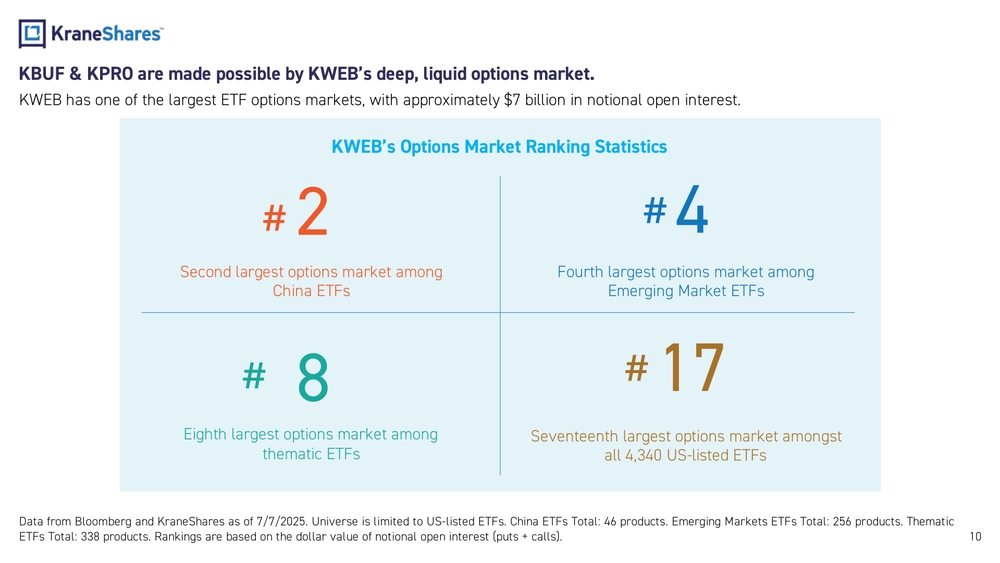
KBUF & KPRO are made possible by KWEB's deep, liquid options market.
KWEB has one of the largest ETF options markets, with approximately $7 billion in notional open interest.
KWEB's Options Market Ranking Statistics
- #2 Second largest options market among China ETFs
- #4 Fourth largest options market among Emerging Market ETFs
- #8 Eighth largest options market among thematic ETFs
- #17 Seventeenth largest options market amongst all 4,340 US-listed ETFs
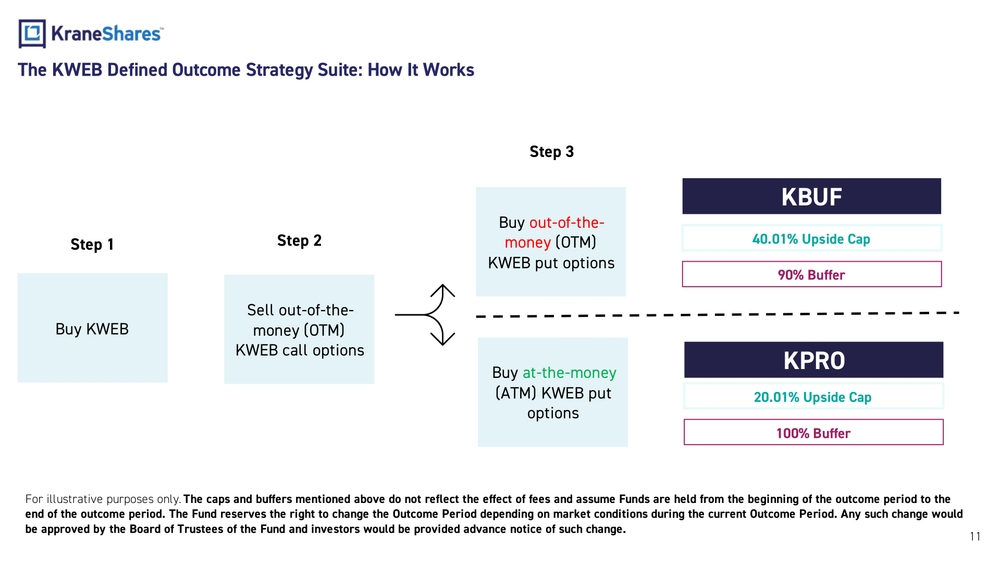
The KWEB Defined Outcome Strategy Suite: How It Works
Step 1
Buy KWEB
Step 2
Sell out-of-the-money (OTM) KWEB call options
Step 3
KBUF
- Buy out-of-the-money (OTM) KWEB put options
- 40.01% Upside Cap
- 90% Buffer
KPRO
- Buy at-the-money (ATM) KWEB put options
- 20.01% Upside Cap
- 100% Buffer
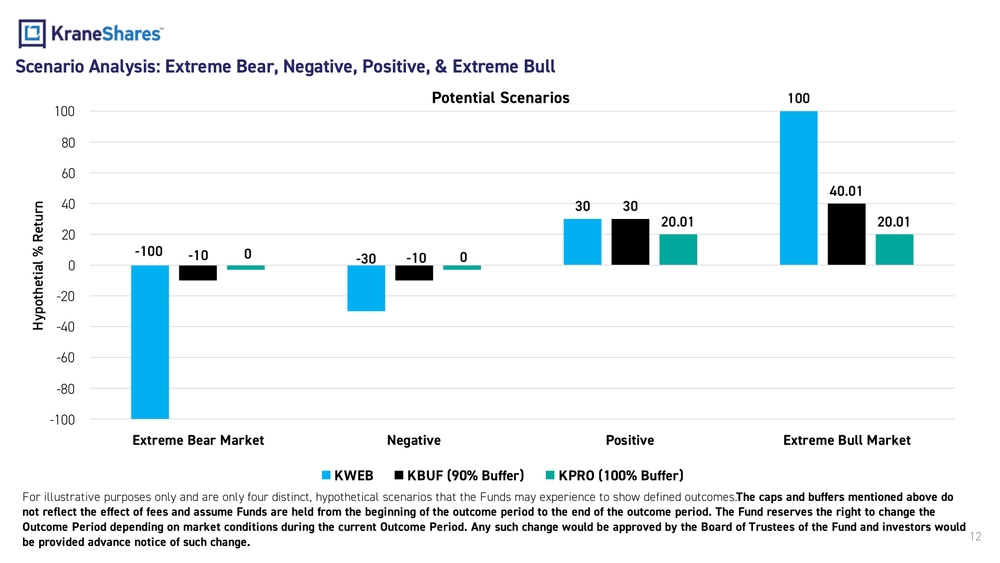
Scenario Analysis: Extreme Bear, Negative, Positive, & Extreme Bull
Potential Scenarios (Hypothetical % Return)
| Scenario | KWEB | KBUF (90% Buffer) | KPRO (100% Buffer) |
|---|---|---|---|
| Extreme Bear Market | -100 | -10 | 0 |
| Negative | -30 | -10 | 0 |
| Positive | 30 | 30 | 20.01 |
| Extreme Bull Market | 100 | 40.01 | 20.01 |
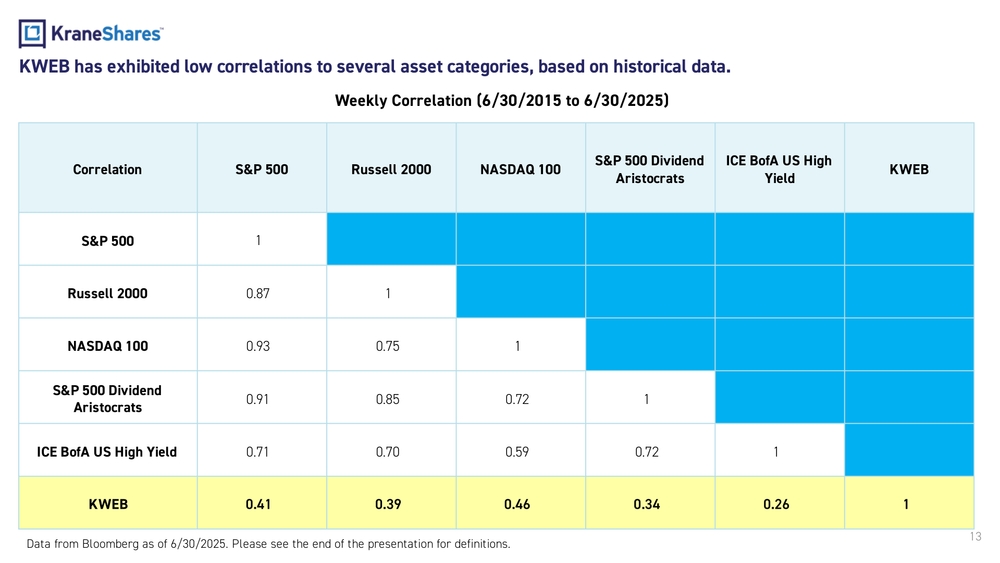
KWEB has exhibited low correlations to several asset categories, based on historical data.
Weekly Correlation (6/30/2015 to 6/30/2025)
| Correlation | S&P 500 | Russell 2000 | NASDAQ 100 | S&P 500 Dividend Aristocrats | ICE BofA US High Yield | KWEB |
|---|---|---|---|---|---|---|
| S&P 500 | 1 | |||||
| Russell 2000 | 0.87 | 1 | ||||
| NASDAQ 100 | 0.93 | 0.75 | 1 | |||
| S&P 500 Dividend Aristocrats | 0.91 | 0.85 | 0.72 | 1 | ||
| ICE BofA US High Yield | 0.71 | 0.70 | 0.59 | 0.72 | 1 | |
| KWEB | 0.41 | 0.39 | 0.46 | 0.34 | 0.26 | 1 |
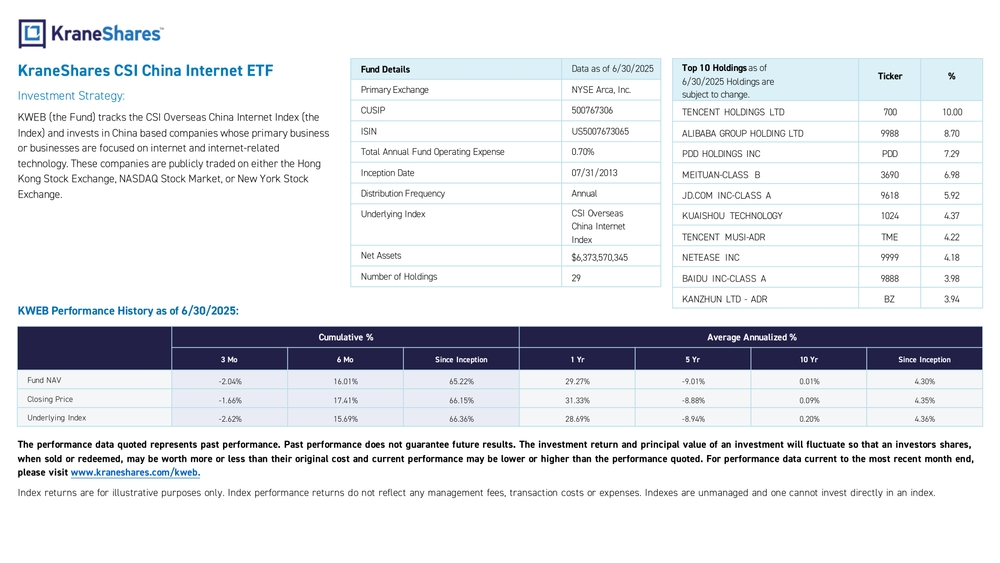
KraneShares CSI China Internet ETF
Investment Strategy
KWEB (the Fund) tracks the CSI Overseas China Internet Index (the Index) and invests in China based companies whose primary business or businesses are focused on internet and internet-related technology. These companies are publicly traded on either the Hong Kong Stock Exchange, NASDAQ Stock Market, or New York Stock Exchange.
Fund Details (Data as of 6/30/2025)
- Primary Exchange: NYSE Arca, Inc.
- CUSIP: 500767306
- ISIN: US5007673065
- Total Annual Fund Operating Expense: 0.70%
- Inception Date: 07/31/2013
- Distribution Frequency: Annual
- Underlying Index: CSI Overseas China Internet Index
- Net Assets: $6,373,570,345
- Number of Holdings: 29
Top 10 Holdings as of 6/30/2025
| Company | Ticker | % |
|---|---|---|
| TENCENT HOLDINGS LTD | 700 | 10.00 |
| ALIBABA GROUP HOLDING LTD | 9988 | 8.70 |
| PDD HOLDINGS INC | PDD | 7.29 |
| MEITUAN-CLASS B | 3690 | 6.98 |
| JD.COM INC-CLASS A | 9618 | 5.92 |
| KUAISHOU TECHNOLOGY | 1024 | 4.37 |
| TENCENT MUSI-ADR | TME | 4.22 |
| NETEASE INC | 9999 | 4.18 |
| BAIDU INC-CLASS A | 9888 | 3.98 |
| KANZHUN LTD - ADR | BZ | 3.94 |
KWEB Performance History as of 6/30/2025
| 3 Mo | 6 Mo | Since Inception | 1 Yr | 5 Yr | 10 Yr | Since Inception | |
|---|---|---|---|---|---|---|---|
| Fund NAV | -2.04% | 16.01% | 65.22% | 29.27% | -9.01% | 0.01% | 4.30% |
| Closing Price | -1.66% | 17.41% | 66.15% | 31.33% | -8.88% | 0.09% | 4.35% |
| Underlying Index | -2.62% | 15.69% | 66.36% | 28.69% | -8.94% | 0.20% | 4.36% |
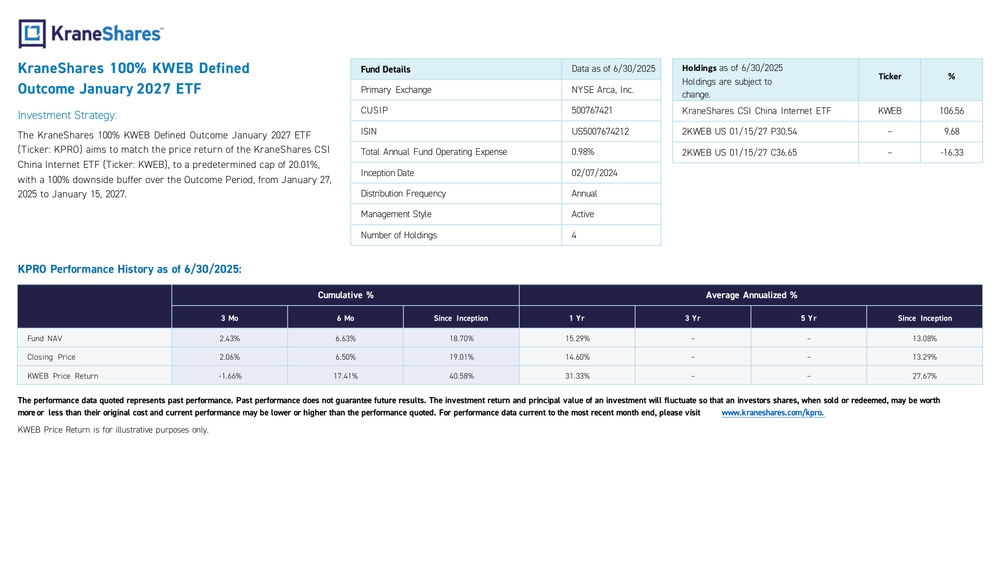
KraneShares 100% KWEB Defined Outcome January 2027 ETF
Investment Strategy
The KraneShares 100% KWEB Defined Outcome January 2027 ETF (Ticker: KPRO) aims to match the price return of the KraneShares CSI China Internet ETF (Ticker: KWEB), to a predetermined cap of 20.01%, with a 100% downside buffer over the Outcome Period, from January 27, 2025 to January 15, 2027.
Fund Details (Data as of 6/30/2025)
- Primary Exchange: NYSE Arca, Inc.
- CUSIP: 500767421
- ISIN: US5007674212
- Total Annual Fund Operating Expense: 0.98%
- Inception Date: 02/07/2024
- Distribution Frequency: Annual
- Management Style: Active
- Number of Holdings: 4
Holdings as of 6/30/2025
| Holding | Ticker | % |
|---|---|---|
| KraneShares CSI China Internet ETF | KWEB | 106.56 |
| 2KWEB US 01/15/27 P30.54 | – | 9.68 |
| 2KWEB US 01/15/27 C36.65 | – | -16.33 |
KPRO Performance History as of 6/30/2025
| 3 Mo | 6 Mo | Since Inception | 1 Yr | 3 Yr | 5 Yr | Since Inception | |
|---|---|---|---|---|---|---|---|
| Fund NAV | 2.43% | 6.63% | 18.70% | 15.29% | – | – | 13.08% |
| Closing Price | 2.06% | 6.50% | 19.01% | 14.60% | – | – | 13.29% |
| KWEB Price Return | -1.66% | 17.41% | 40.58% | 31.33% | – | – | 27.67% |
KraneShares 90% KWEB Defined Outcome January 2027 ETF
Investment Strategy
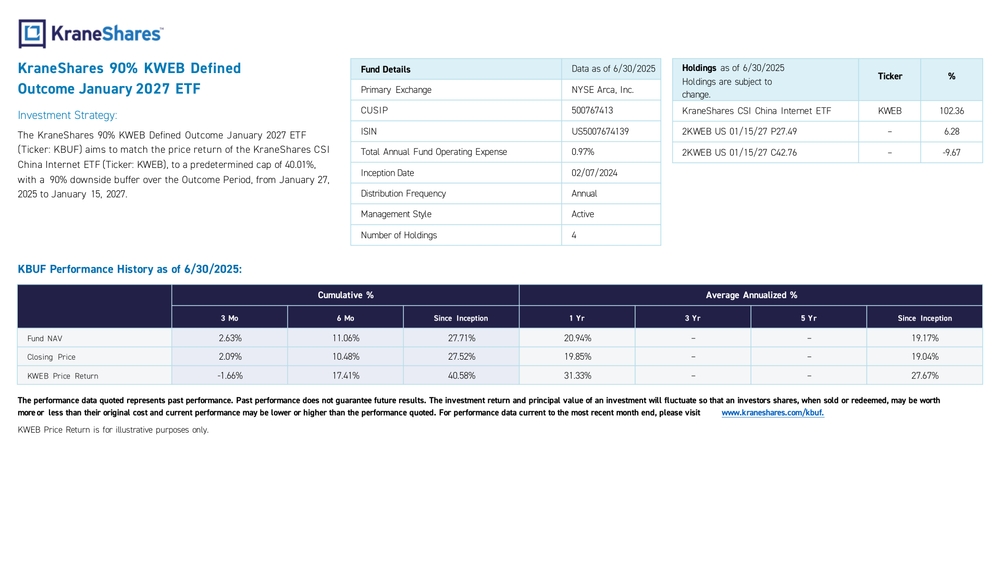
The KraneShares 90% KWEB Defined Outcome January 2027 ETF (Ticker: KBUF) aims to match the price return of the KraneShares CSI China Internet ETF (Ticker: KWEB), to a predetermined cap of 40.01%, with a 90% downside buffer over the Outcome Period, from January 27, 2025 to January 15, 2027.
Fund Details (Data as of 6/30/2025)
- Primary Exchange: NYSE Arca, Inc.
- CUSIP: 500767413
- ISIN: US5007674139
- Total Annual Fund Operating Expense: 0.97%
- Inception Date: 02/07/2024
- Distribution Frequency: Annual
- Management Style: Active
- Number of Holdings: 4
Holdings as of 6/30/2025
| Holding | Ticker | % |
|---|---|---|
| KraneShares CSI China Internet ETF | KWEB | 102.36 |
| 2KWEB US 01/15/27 P27.49 | – | 6.28 |
| 2KWEB US 01/15/27 C42.76 | – | -9.67 |
KBUF Performance History as of 6/30/2025
| 3 Mo | 6 Mo | Since Inception | 1 Yr | 3 Yr | 5 Yr | Since Inception | |
|---|---|---|---|---|---|---|---|
| Fund NAV | 2.63% | 11.06% | 27.71% | 20.94% | – | – | 19.17% |
| Closing Price | 2.09% | 10.48% | 27.52% | 19.85% | – | – | 19.04% |
| KWEB Price Return | -1.66% | 17.41% | 40.58% | 31.33% | – | – | 27.67% |
Index Definitions
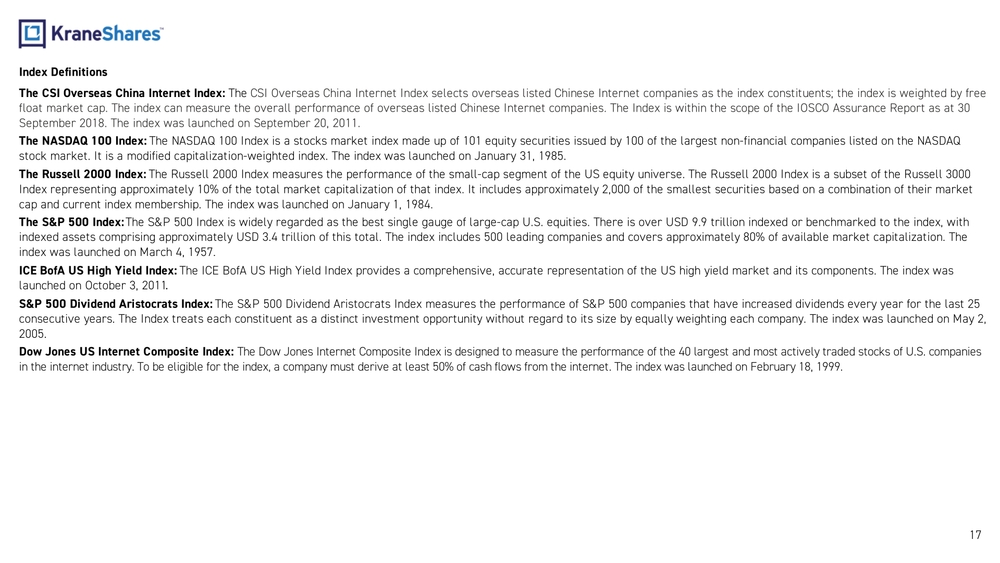
The CSI Overseas China Internet Index: The CSI Overseas China Internet Index selects overseas listed Chinese Internet companies as the index constituents; the index is weighted by free float market cap. The index can measure the overall performance of overseas listed Chinese Internet companies. The Index is within the scope of the IOSCO Assurance Report as at 30 September 2018. The index was launched on September 20, 2011.
The NASDAQ 100 Index: The NASDAQ 100 Index is a stocks market index made up of 101 equity securities issued by 100 of the largest non-financial companies listed on the NASDAQ stock market. It is a modified capitalization-weighted index. The index was launched on January 31, 1985.
The Russell 2000 Index: The Russell 2000 Index measures the performance of the small-cap segment of the US equity universe. The Russell 2000 Index is a subset of the Russell 3000 Index representing approximately 10% of the total market capitalization of that index. It includes approximately 2,000 of the smallest securities based on a combination of their market cap and current index membership. The index was launched on January 1, 1984.
The S&P 500 Index: The S&P 500 Index is widely regarded as the best single gauge of large-cap U.S. equities. There is over USD 9.9 trillion indexed or benchmarked to the index, with indexed assets comprising approximately USD 3.4 trillion of this total. The index includes 500 leading companies and covers approximately 80% of available market capitalization. The index was launched on March 4, 1957.
ICE BofA US High Yield Index: The ICE BofA US High Yield Index provides a comprehensive, accurate representation of the US high yield market and its components. The index was launched on October 3, 2011.
S&P 500 Dividend Aristocrats Index: The S&P 500 Dividend Aristocrats Index measures the performance of S&P 500 companies that have increased dividends every year for the last 25 consecutive years. The Index treats each constituent as a distinct investment opportunity without regard to its size by equally weighting each company. The index was launched on May 2, 2005.
Dow Jones US Internet Composite Index: The Dow Jones Internet Composite Index is designed to measure the performance of the 40 largest and most actively traded stocks of U.S. companies in the internet industry. To be eligible for the index, a company must derive at least 50% of cash flows from the internet. The index was launched on February 18, 1999.
Term Definitions
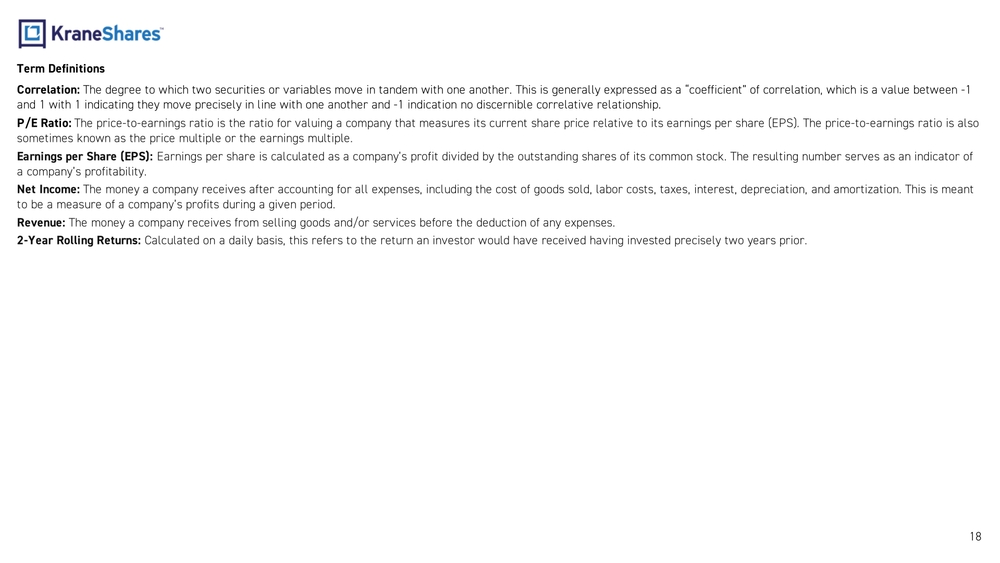
Correlation: The degree to which two securities or variables move in tandem with one another. This is generally expressed as a "coefficient" of correlation, which is a value between -1 and 1 with 1 indicating they move precisely in line with one another and -1 indication no discernible correlative relationship.
P/E Ratio: The price-to-earnings ratio is the ratio for valuing a company that measures its current share price relative to its earnings per share (EPS). The price-to-earnings ratio is also sometimes known as the price multiple or the earnings multiple.
Earnings per Share (EPS): Earnings per share is calculated as a company's profit divided by the outstanding shares of its common stock. The resulting number serves as an indicator of a company's profitability.
Net Income: The money a company receives after accounting for all expenses, including the cost of goods sold, labor costs, taxes, interest, depreciation, and amortization. This is meant to be a measure of a company's profits during a given period.
Revenue: The money a company receives from selling goods and/or services before the deduction of any expenses.
2-Year Rolling Returns: Calculated on a daily basis, this refers to the return an investor would have received having invested precisely two years prior.
Important Notes
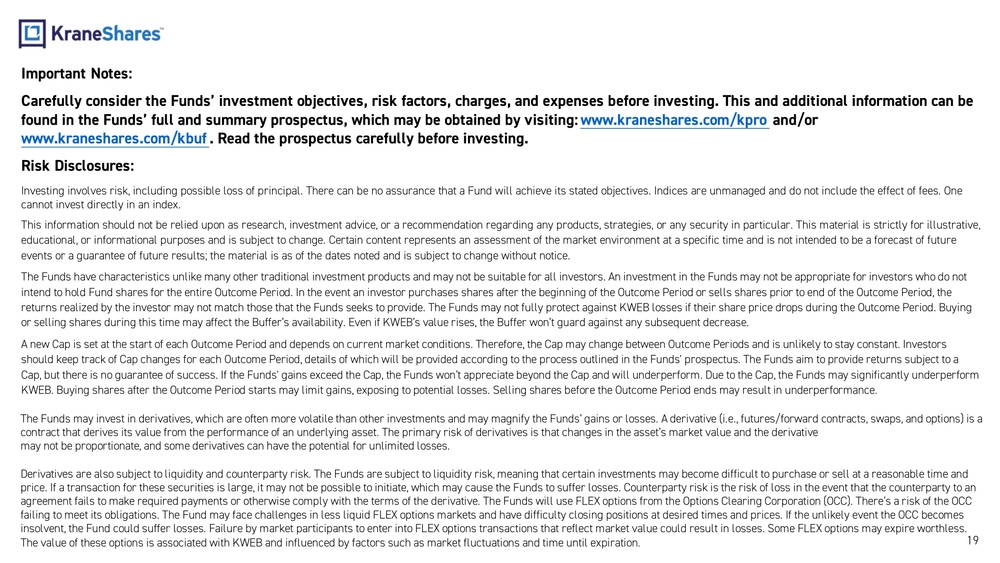
Carefully consider the Funds' investment objectives, risk factors, charges, and expenses before investing. This and additional information can be found in the Funds' full and summary prospectus, which may be obtained by visiting: www.kraneshares.com/kpro and/or www.kraneshares.com/kbuf. Read the prospectus carefully before investing.
Risk Disclosures
Investing involves risk, including possible loss of principal. There can be no assurance that a Fund will achieve its stated objectives. Indices are unmanaged and do not include the effect of fees. One cannot invest directly in an index.
This information should not be relied upon as research, investment advice, or a recommendation regarding any products, strategies, or any security in particular. This material is strictly for illustrative, educational, or informational purposes and is subject to change.
The Funds have characteristics unlike many other traditional investment products and may not be suitable for all investors. An investment in the Funds may not be appropriate for investors who do not intend to hold Fund shares for the entire Outcome Period.
A new Cap is set at the start of each Outcome Period and depends on current market conditions. Therefore, the Cap may change between Outcome Periods and is unlikely to stay constant.
The Funds may invest in derivatives, which are often more volatile than other investments and may magnify the Funds' gains or losses. A derivative (i.e., futures/forward contracts, swaps, and options) is a contract that derives its value from the performance of an underlying asset. The primary risk of derivatives is that changes in the asset's market value and the derivative may not be proportionate, and some derivatives can have the potential for unlimited losses.
Derivatives are also subject to liquidity and counterparty risk. The Funds will use FLEX options from the Options Clearing Corporation (OCC). There's a risk of the OCC failing to meet its obligations. Some FLEX options may expire worthless. The value of these options is associated with KWEB and influenced by factors such as market fluctuations and time until expiration.
Narrowly focused investments typically exhibit higher volatility. The Funds' assets are expected to be concentrated in a sector, industry, market, or group of concentrations to the extent that the Underlying Index has such concentrations. KPRO and KBUF are non-diversified.
The ability of the Funds to achieve their respective investment objectives is dependent, in part, on the continuous availability of A Shares and the ability to obtain, if necessary, additional A Shares quota. The Funds are subject to political, social or economic instability within China which may cause decline in value. Emerging markets involve heightened risk related to the same factors as well as increase volatility and lower trading volume. Fluctuations in currency of foreign countries may have an adverse effect to domestic currency values.
ETF shares are bought and sold on an exchange at market price (not NAV) and are not individually redeemed from the Fund. However, shares may be redeemed at NAV directly by certain authorized broker-dealers (Authorized Participants) in very large creation/redemption units. Shares may trade at a premium or discount to their NAV in the secondary market. Brokerage commissions will reduce returns. NAVs are calculated using prices as of 4:00 PM Eastern Time.
The KraneShares ETFs and KFA Funds ETFs are distributed by SEI Investments Distribution Company (SIDCO), 1 Freedom Valley Drive, Oaks, PA 19456, which is not affiliated with Krane Funds Advisors, LLC, the Investment Adviser for the Funds, or any sub-advisers for the Funds.