KTEC ETF: Hang Seng Tech | Hong Kong Technology ETF
by Kraneshares
KTEC 6/30/2026 Capturing The China Internet & Technology Opportunity Through Hong Kong Listings An Overview of the KraneShares Hang Seng Tech Index ETF (Ticker: KTEC) 1 info@kraneshares.com
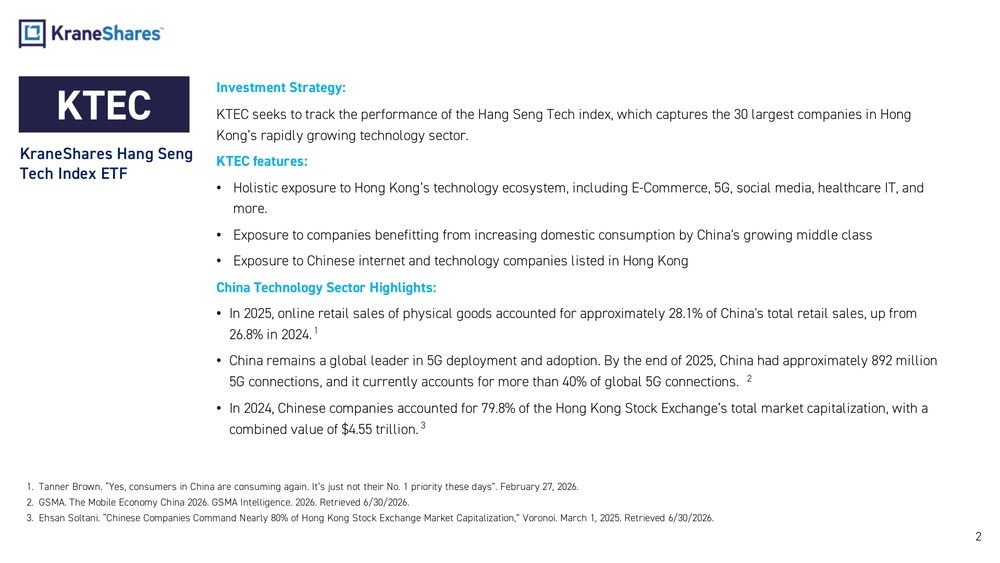
2Investment Strategy: KTEC seeks to track the performance of the Hang Seng Tech index, which captures the 30 largest companies in Hong Kong’s rapidly growing technology sector. KTEC features: •Holistic exposure to Hong Kong’s technology ecosystem, including E -Commerce, 5G, social media, healthcare IT, and more. •Exposure to companies benefitting from increasing domestic consumption by China's growing middle class •Exposure to Chinese internet and technology companies listed in Hong Kong China Technology Sector Highlights: •In 2025, online retail sales of physical goods accounted for approximately 28.1% of China's total retail sales, up from 26.8% in 2024.1 •China remains a global leader in 5G deployment and adoption. By the end of 2025, China had approximately 892 million 5G connections, and it currently accounts for more than 40% of global 5G connections.2 •In 2024, Chinese companies accounted for 79.8% of the Hong Kong Stock Exchange’s total market capitalization, with a combined value of $4.55 trillion.3KTEC KraneShares Hang Seng Tech Index ETF 1.Tanner Brown. “Yes, consumers in China are consuming again. It’s just not their No. 1 priority these days”. February 27, 2026. 2.GSMA. The Mobile Economy China 2026. GSMA Intelligence. 2026. Retrieved 6 /30/2026 . 3.Ehsan Soltani. “Chinese Companies Command Nearly 80% of Hong Kong Stock Exchange Market Capitalization,” Voronoi . March 1, 2025. Retrieved 6 /30/2026 .
3Why did Hang Seng make the index? Internet giants like Alibaba, JD.com, and Baidu have chosen to pursue additional listings on the Hong Kong Stock Exchange to capitalize on its growing investor base from Mainland China. In 2024, Chinese companies accounted for 79.8% of the Hong Kong Stock Exchange’s total market capitalization, with a combined value of $4.55 trillion1 The Hong Kong Stock Exchange has remained one of the most popular IPO venues globally. In 2024, companies raised nearly USD 11.1 billion through initial public offerings on the exchange, marking a significant increase of almost 89 percent compared to the previous year.China is becoming a world leader in advanced Information Technology hardware production , focusing on 5G equipment and semiconductors. Many of the firms leading these developing industries in China list shares in Hong Kong. Access to H ong Kong -listed technology companies Growing number of secondary listings Top IPO locationMainland investor opportunity 1.Ehsan Soltani. “Chinese Companies Command Nearly 80% of Hong Kong Stock Exchange Market Capitalization,” Voronoi. March 1, 20 25. Retrieved 6/30 /2026 . 2.Data from Statista as 3/28/2025. Retrieved 6/30 /2026 .
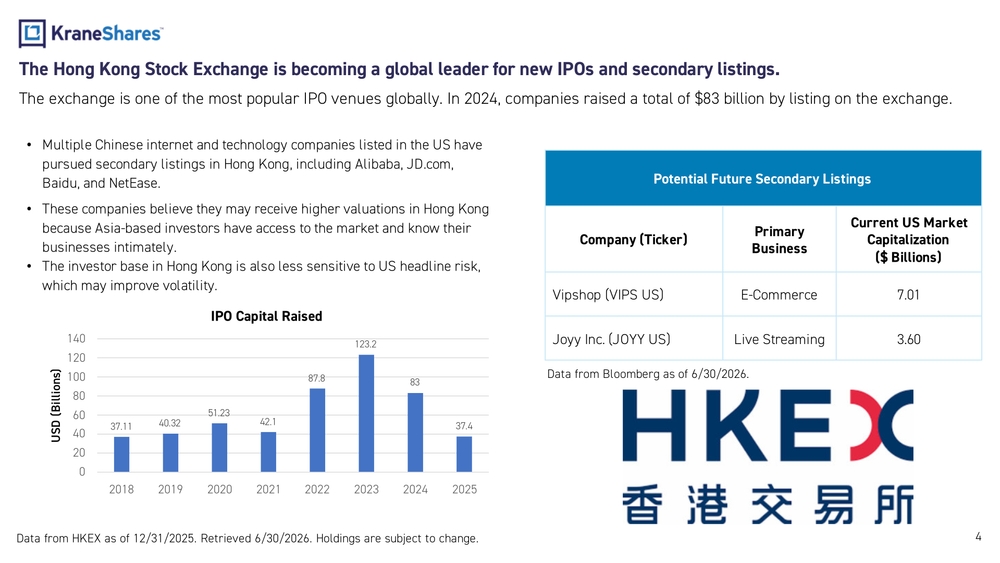
4The Hong Kong Stock Exchange is becoming a global leader for new IPOs and secondary listings. The exchange is one of the most popular IPO venues globally. In 2024, companies raised a total of $83 billion by listing on t he exchange. •Multiple Chinese internet and technology companies listed in the US have pursued secondary listings in Hong Kong, including Alibaba, JD.com , Baidu, and NetEase. •These companies believe they may receive higher valuations in Hong Kong because Asia -based investors have access to the market and know their businesses intimately. •The investor base in Hong Kong is also less sensitive to US headline risk, which may improve volatility. Data from HKEX as of 12/31/2025. Retrieved 6/30 /2026 . Holdings are subject to change.Potential Future Secondary Listings Company (Ticker)Primary BusinessCurrent US Market Capitalization ($ Billions) Vipshop (VIPS US) E-Commerce 7.01 Joyy Inc. (JOYY US) Live Streaming 3.60 Data from Bloomberg as of 6/30/2026. 37.11 40.3251.23 42.187.8123.2 83 37.4 020406080100120140 2018 2019 2020 2021 2022 2023 2024 2025USD (Billions)IPO Capital Raised
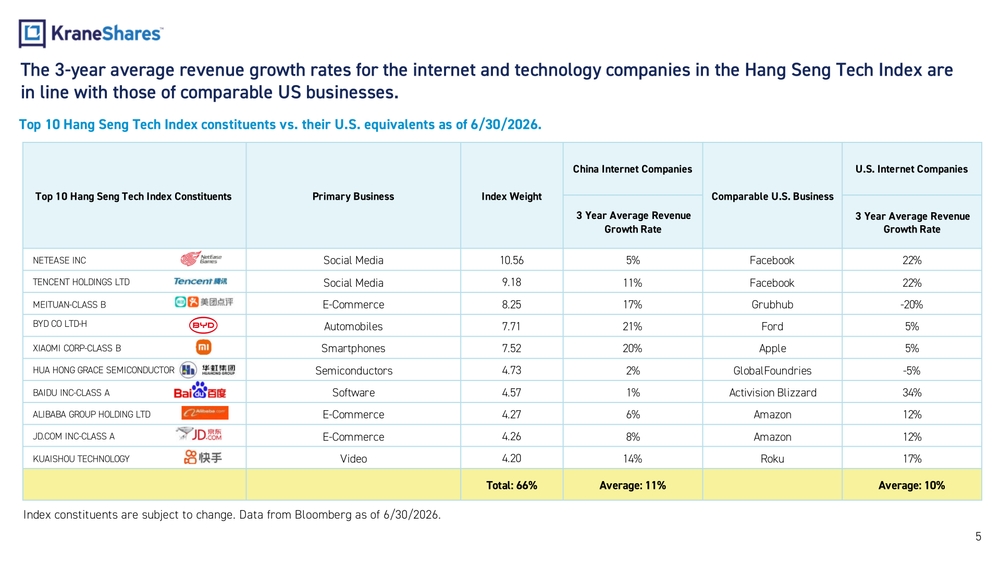
Top 10 Hang Seng Tech Index Constituents Primary Business Index WeightChina Internet Companies Comparable U.S. BusinessU.S. Internet Companies 3 Year Average Revenue Growth Rate 3 Year Average Revenue Growth Rate NETEASE INC Social Media 10.56 5% Facebook 22% TENCENT HOLDINGS LTD Social Media 9.18 11% Facebook 22% MEITUAN -CLASS B E-Commerce 8.25 17% Grubhub -20% BYD CO LTD -H Automobiles 7.71 21% Ford 5% XIAOMI CORP -CLASS B Smartphones 7.52 20% Apple 5% HUA HONG GRACE SEMICONDUCTOR Semiconductors 4.73 2% GlobalFoundries -5% BAIDU INC -CLASS A Software 4.57 1% Activision Blizzard 34% ALIBABA GROUP HOLDING LTD E-Commerce 4.27 6% Amazon 12% JD.COM INC -CLASS A E-Commerce 4.26 8% Amazon 12% KUAISHOU TECHNOLOGY Video 4.20 14% Roku 17% Total: 66% Average: 11% Average: 10%The 3 -year average revenue growth rates for the internet and technology companies in the Hang Seng Tech Index are in line with those of comparable US businesses. Top 10 Hang Seng Tech Index constituents vs. their U.S. equivalents as of 6/30/2026. Index constituents are subject to change. Data from Bloomberg as of 6/30/2026. 5
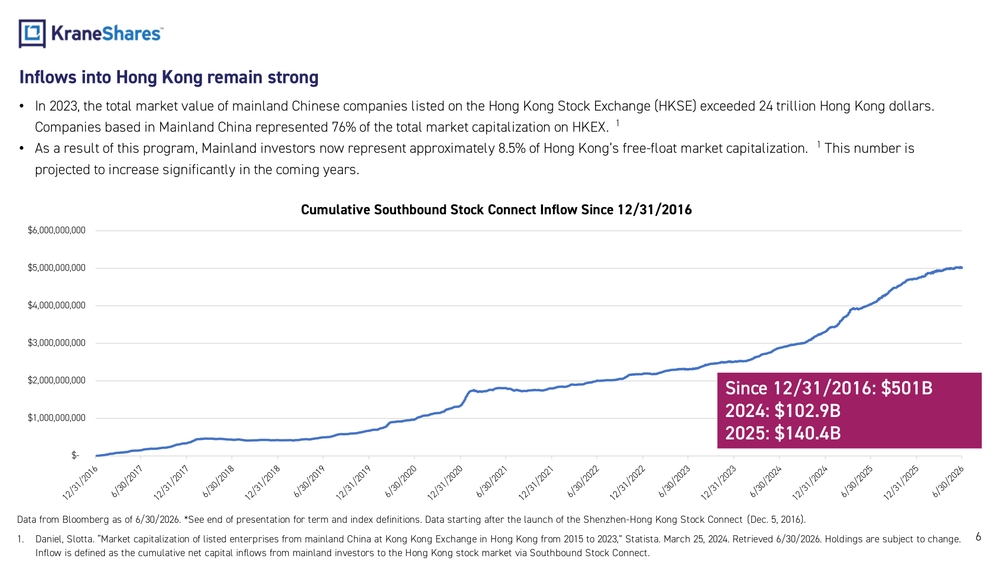
6Inflows into Hong Kong remain strong
Data from Bloomberg as of 6/30/2026. *See end of presentation for term and index definitions. Data starting after the launch of the Shenzhen -Hong Kong Stock Connect (Dec. 5, 2016).•In 2023, the total market value of mainland Chinese companies listed on the Hong Kong Stock Exchange (HKSE) exceeded 24 trill ion Hong Kong dollars.
Companies based in Mainland China represented 76% of the total market capitalization on HKEX.1
•As a result of this program, Mainland investors now represent approximately 8.5% of Hong Kong’s free -float market capitalization .1 This number is
projected to increase significantly in the coming years.
1.Daniel, Slotta. “Market capitalization of listed enterprises from mainland China at Kong Kong Exchange in Hong Kong from 2015 to 2023,” Statista. March 25, 2024. Retrieved 6/30/2026. Holdings are subject to change.
Inflow is defined as the cumulative net capital inflows from mainland investors to the Hong Kong stock market via Southbound Stock Connect. $- $1,000,000,000 $2,000,000,000 $3,000,000,000 $4,000,000,000 $5,000,000,000 $6,000,000,000Cumulative Southbound Stock Connect Inflow Since 12/31/2016
Since 12/31/2016: $501B
2024: $102.9B
2025: $140.4B
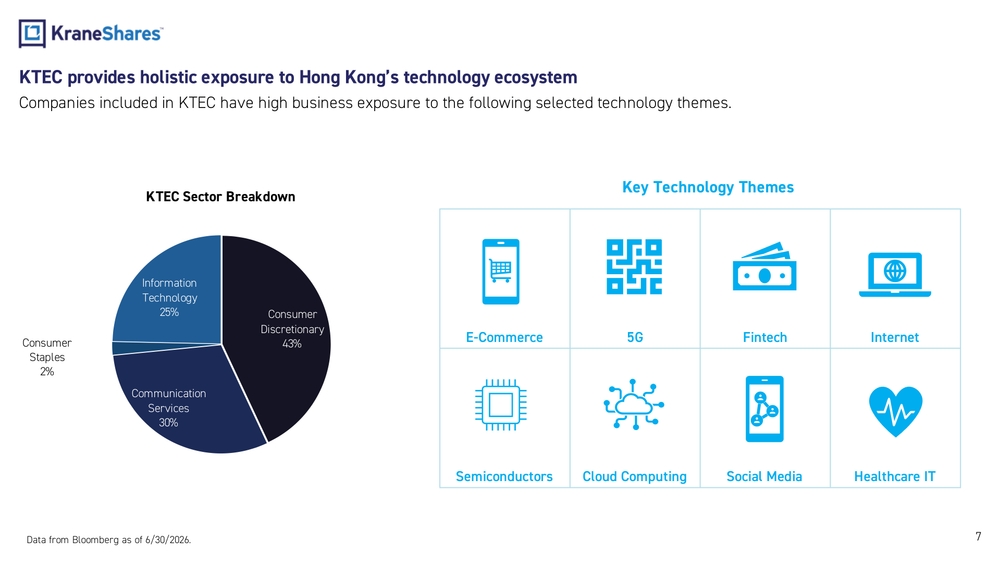
E-Commerce 5G Fintech Internet Semiconductors Cloud Computing Social Media Healthcare IT 7Companies included in KTEC have high business exposure to the following selected technology themes.KTEC provides holistic exposure to Hong Kong’s technology ecosystem Key Technology Themes Data from Bloomberg as of 6/30/2026 . Consumer Discretionary 43% Communication Services 30%Consumer Staples 2%Information Technology 25%KTEC Sector Breakdown
8Information Technology •Founded in 1984, Sunny Optical Technology (Group) Co. Ltd.is a leading manufacturer of integrated optical components and products worldwide, best known for its smartphone camera lenses . •At present, the Company operates in eight business sectors : mobile phone business, automobile business, security business, microscopes business, robot business, AR / VR business, industrial detection business and medical detection business. •The likely expansion into Apple's supply chain and smartphone users’ penchant for more advanced lenses may help Sunny Optical's revenue growth and margin stay above its peer group average over the next few years. •The company's car -camera modules’ deliver high margins and could benefit from the global transition toward electric vehicles. Data from Sunny Optical as of 12/31/2024. Retrieved 6/30/2026. Holdings are subject to change.•Founded in 2010, Xiaomi is an electronics company and one of the top five smartphone vendors in the world. Additionally, Xiaomi makes laptops, appliances, consumer electronics, and many other products. •Electric vehicles could become a major growth driver . At the Xiaomi EV Technology Launch, Xiaomi officially unveiled the five core technologies of its electric vehicle initiative: E -Motor, Battery, Xiaomi Hyper Die -Casting, Xiaomi Pilot Autonomous Driving, and Smart Cabin. Xiaomi EV is dedicated to redefining automotive technology through the development of foundational technologies and extensive independent research.1 •Xiaomi profiting from Artificial Intelligence of Things ( AIoT ) in the 5G era. Xiaomi’s core strategy of “Smartphone × AIoT” increased revenue by 12.5% quarter -over- quarter in the last quarter of 2022 to 3.0 billion.2 We are confident that their AIoT platform will continue to grow rapidly thanks to their strengths in connected device production. •Increased investments in semiconductors by Xiaomi . Xiaomi wants to become a leading chip manufacturer, and their ambitions are beginning to bear fruit.3
- XiaoMi . ” Xiaomi Unveils Five Core Automotive Technologies and Debuts Xiaomi SU7, Completing the Human x Car x Home Smart Ecosystem.”Dec 28, 2023. Retrieved 6/30/2026.
- Telecomtv . ” Xiaomi 2022 Annual Results Slightly Beat Market Estimates.” Mar 24, 2023. Retrieved 6/30/2026.
- Wall Street Journal “Xiaomi Billionaire Leads New Fund to Boost China’s Chip Industry.” Nikkei Asia. March 3, 2023. Retrieved 6/30/2026.Company Introductions
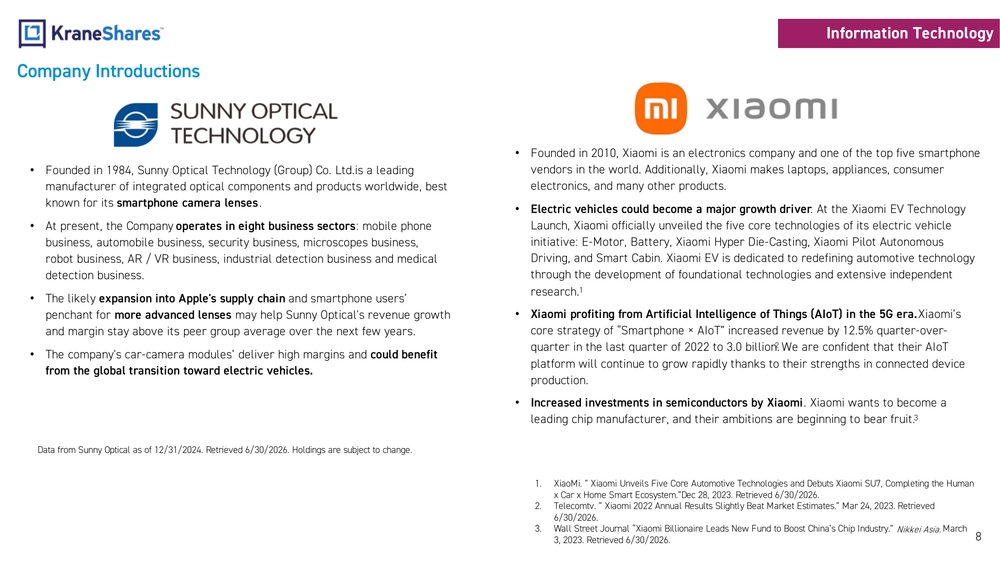
9Company Introductions •Kingdee International Software Group Company Ltd. is the second -largest enterprise resource planning (ERP) provider in China . It offers both traditional ERP software and cloud -based service to over 6.8mn corporate customers. •Kingdee currently holds a more than 10% market share in China’s ERP space but we believe there is much room for greater market share gains as Chinese companies increasingly favor domestic software. •Kingdee has developed a comprehensive cloud product portfolio, addressing the needs of enterprises of all sizes, and a Platform -as-a-Service (PaaS) platform that drives ecosystem development. •The company plans to turn its cloud business into a full subscription -based model in the future. Source: JP Morgan; Kingdee website Internet of Things (IoT); Software as a service (SaaS) AI Robot K, the smart business assistant, and the Kingdee Finance RPA RobotBlockchain Financial chain for distributed financial accounting and blockchain invoices5G Kingdee and China Unicom jointly established Yundee Cloud Computing Kingdee cloud native SaaS+PaaS platformIoT* & Big Data edge computing data box & cloud driveInformation Technology •In 2023, BYD significantly expanded its global presence, recording a 337% increase in overseas sales of new energy passenger cars, which surpassed 240,000 units, making it the leading Chinese exporter of NEVs.1 •BYD's new energy passenger vehicles are now available in 64 countries and regions, supported by strategic investments in manufacturing facilities in Thailand, Brazil, Uzbekistan, and Hungary.2 •BYD sold more new energy vehicles (NEVs) than Tesla worldwide in 2023.3 1.BYD, “BYD Rolled Off Its 7 Millionth New Energy Vehicle”, Mar 25, 2024. Retrieved 6/30/2026 . 2.BYD as of 12/31/2023. Retrieved 6/30/2026 . 3.BYD beats Tesla for a second straight year after producing more than 3 million cars in 2023”, Jan 1, 2024. Retrieved 6/30/2026 . 4.Holdings are subject to change. The interior of BYD’s HAN luxury sedan
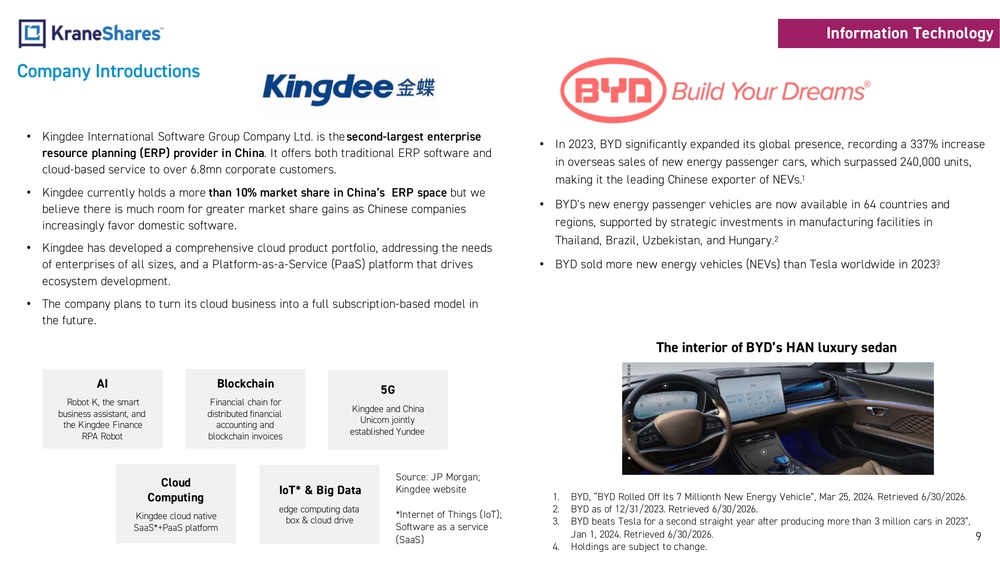
E-Commerce Ecosystem 10Consumer Discretionary Online retail International retail Wholesale Marketplace Food delivery Video sharingWorkplace collaborationSE Asia E -Commerce Smart logisticsCloud suiteOffline -online integrationJD.com is China’s largest online retailer and largest Internet company by revenue ($151.7 billion in 2022) It has one of the largest fulfillment infrastructure operations across e -commerce companies globallyChina’s one -stop app for food delivery, groceries, ticket reservations, ride - sharing, service appointments, and more Source: Company websites. Holdings are subject to change.Global retail marketplace & more Image source: WSJ
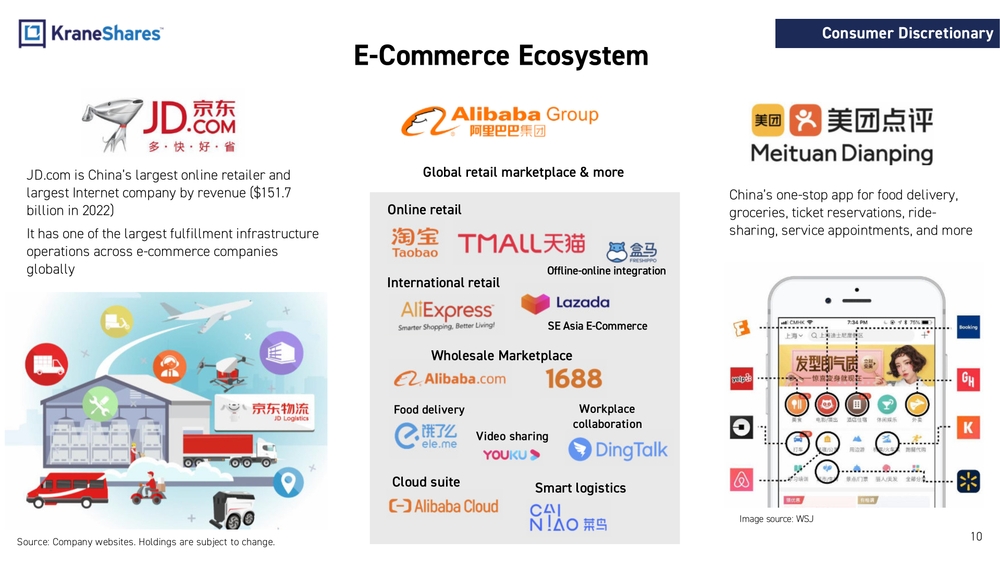
11Communication Services Originally crated as a GIF -maker, Kuaishou evolved into a short video social platform, similar to TikTok, where users can record videos to share their lives and personal stories. The company has additional apps for editing and producing photo and video content. Through partnerships with E -Commerce companies, users can purchase featured products within the app. Gaming FilmE-SportsSocial media & messaging MusicBlockchain Fintech Baidu was founded in 2000 initially as a search engine platform but subsequently became an early adopter of artificial intelligence to make content discovery on its internet platform more efficient. Currently, Baidu consists of an expansive mobile ecosystem, AI cloud platform, smart driving solutions, and more. Founded in 1997, NetEase, Inc. is a leading China -based internet technology company that develops and operates some of China's most popular online PC and mobile games as well as operates a range internet services such as online education, online music, internet media and others NetEase Music Source: Company websites. Holdings are subject to change. WeChatCompany Introductions
KraneShares Hang Seng TECH Index ETF
Investment Strategy:
KTEC seeks totrack theperformance oftheHang Seng TECH
Index, which captures the30largest companies inHong Kong's
rapidly growing technology sector. TheIndex provides exposure to
innovative companies with strong research &development
investment, high revenue growth, andthemes such ascloud, E-
Commerce, fintech andinternet. TheIndex isfree-float market
capitalization weighted with an8%caponindividual constituent
weighting.Fund Details Data as of 6/30/2026
Primary Exchange NYSE Arca, Inc.
CUSIP 500767579
ISIN US5007675797
Total Annual Fund Operating Expense 0.69%
Inception Date 06/0 8/2021
Distribution Frequency Annual
Underlying Index Hang Seng
TECH Index
Net Assets $49,896,258
Number ofHoldings 59Top 10 Holdings as of
6/30/2026 Holdings are subject
to change.Ticker %
NETEASE INC 9999 10.56
TENCENT HOLDINGS LTD 700 9.18
MEITUAN -CLASS B 3690 8.25
BYD CO LTD -H 1211 7.71
XIAOMI CORP -CLASS B 1810 7.52
HUA HONG GRACE SEMICONDUCTOR 1347 4.73
BAIDU INC -CLASS A 9888 4.57
ALIBABA GROUP HOLDING LTD 9988 4.27
JD.COM INC -CLASS A 9618 4.26
KUAISHOU TECHNOLOGY 1024 4.20
KTEC Performance History as of 6/30/202 6:
Cumulative % Average Annualized %
3Mo 6Mo Since Inception 1Yr 3Yr 5Yr Since Inception
Fund NAV -8.84% -22.88% -49.08% -21.62 % 1.82% -12.96% -12.48 %
Closing Price -10.28 % -21.39% -48.50% -20.93 % 2.06% -12.72% -12.29%
Index -3.28% -18.98 % -42.17% -14.82% 5.60% -10.75% -10.25%
Theperformance data quoted represents past performance. Past performance does notguarantee future results. Theinvestment return andprincipal value ofaninvestment willfluctuate sothat aninvestors shares, when sold or
redeemed, may beworth more orless than their original cost andcurrent performance may belower orhigher than theperformance quoted. Forperformance data current tothemost recent month end, please visit
https://kraneshares.com/ktec/ .
Index returns areforillustrative purposes only. Index performance returns donotreflect anymanagement fees, transaction costs orexpenses. Indexes areunmanaged andonecannot invest directly inanindex.
12
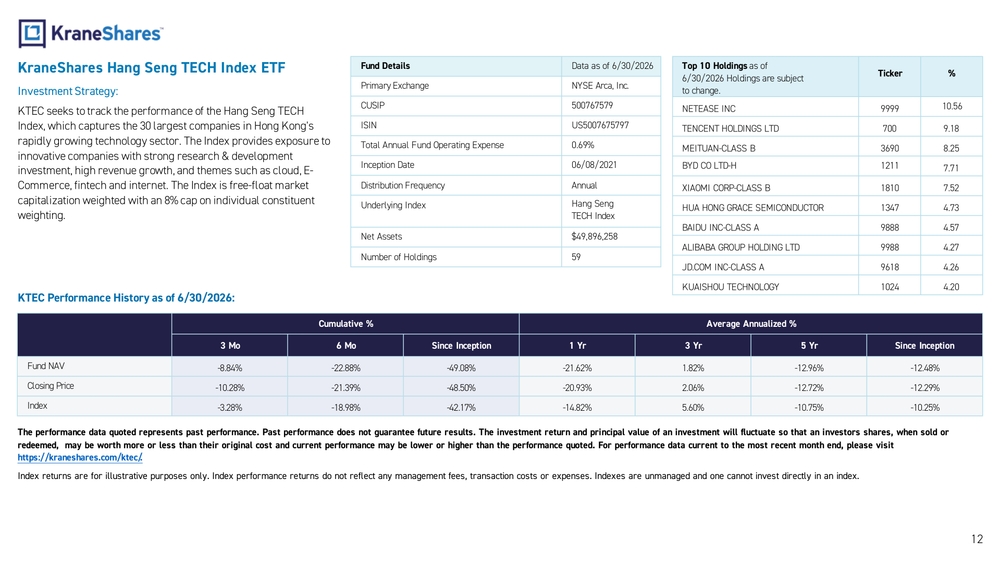
China, Emerging Markets & Regional Alternatives Income & Covered Call AI, Robotics & Emerging Technology KURE Healthcare KGRN Clean TechnologyKSTR STAR Market KTEC Hang Seng TechKWEB Internet & E -Commerce China A Shares KBA / CHIN KCAI China Onshore Alpha IndexAGIX Artificial Intelligence & Technology KOID Humanoid & Embodied Intelligence Electric Vehicles & Future Mobility KARSChina Suite Future TechBroader Emerging Markets KEMQ Emerging Markets Consumer Tech KPHODragon Capital Vietnam GrowthKEMX MSCI Emerging Markets ex China U.S. & Developed Markets KVLE Value Line® Dynamic Dividend EquityHedgeye Hedged Equity KSPY Man Buyout Beta Index BUYO Fixed Income BNDDQuadratic Deflation ETFIVOLQuadratic Interest Rate Volatility & Inflation Hedge KHYB Asia High Income USD BondSustainable Ultra Short DurationKCSHGlobal Carbon Strategy KRBNCarbon CreditsKPDD 2X Long PDD Daily KJD 2X Long JD DailyKBAB 2X Long BABA Daily KMLI 2X Long MELI Daily Covered Call & Options Income Managed Futures KMLMMount Lucas Managed Futures KWIN Wahed Alternative IncomeKLIP China Internet & Covered Call Outcome Based Equity KIQQ Nasdaq Buffer & Option IncomeLevered & High -Conviction Exposure KBUF90% KWEB Defined Outcome100% KWEB Defined Outcome KPRO Alternative Income KCCA California Carbon AllowanceExtensive ETF Product Suite Spanning High Growth Sectors Strategy also available in UCITS / ETCKBDU 2X Long BIDU Daily 13
KraneShares Empowering investors with access to the world’ s most powerful growth themes through ETFs, private strategies, and innovative investment solutions. 14
Important Notes: Carefully consider the Funds’ investment objectives, risk factors, charges and expenses before investing. This and additional information can be found in the Funds' full and summary prospectus, which may be obtained by visiting www.kraneshares.com/ktec/. Read the prospectus carefully before investing. Risk Disclosures: Investing involves risk, including possible loss ofprincipal. There canbenoassurance that aFund willachieve itsstated objectives. Indices areunmanaged anddonotinclude theeffect offees. One cannot invest directly inanindex. This information should notberelied upon asresearch, investment advice, orarecommendation regarding anyproducts, strategies, oranysecurity inparticular. This material isstrictly forillustrative, educational, or informational purposes andis subject tochange. Certain content represents anassessment ofthemarket environment ataspecific time andisnotintended tobeaforecast offuture events oraguarantee offuture results; material isasofthedates noted andissubject tochange without notice. TheFund may invest inderivatives, which areoften more volatile than other investments andmay magnify theFund’s gains orlosses. Aderivative (i.e., futures/forward contracts, swaps, andoptions) isacontract that derives itsvalue from the performance ofanunderlying asset. Theprimary riskofderivatives isthat changes intheasset’s market value andthederivative may notbeproportionate, andsome derivatives canhave the potential forunlimited losses. Derivatives arealso subject toliquidity andcounterparty risk. TheFund issubject toliquidity risk, meaning that certain investments may become difficult topurchase orsellatareasonable time andprice. Ifatransaction forthese securities islarge, itmay notbepossible to initiate, which may cause theFund tosuffer losses. Counterparty riskistheriskofloss intheevent that thecounterparty toan agreement fails tomake required payments orotherwise comply with theterms ofthederivative. Theability oftheFund toachieve itsrespective investment objectives isdependent, inpart, onthecontinuous availability ofAShares andtheability toobtain, ifnecessary, additional AShares quota. IftheFund isunable toobtain sufficient exposure to limited availability ofAShare quota, theFund could seek exposure tothecomponent securities oftheUnderlying Index byinvestment inother types ofsecurities. TheFund issubject to political, social oreconomic instability within China which may cause decline invalue. Emerging markets involve heightened riskrelated tothesame factors aswell asincrease volatility andlower trading volume. Fluctuations incurrency offoreign countries may have anadverse effect todomestic currency values. TheFund may invest inInitial Public Offerings (IPOs). Securities issued inIPOs have notrading history, and information about thecompanies may beavailable forvery limited periods. Inaddition, theprices ofsecurities sold inIPOs may behighly volatile. Inaddition, astheFund increases insize, theimpact ofIPOs onthe Fund’s performance willgenerally decrease. Narrowly focused investments typically exhibit higher volatility. TheFund’s assets areexpected tobeconcentrated inasector, industry, market, orgroup ofconcentrations totheextent that theUnderlying Index hassuch concentrations. The securities orfutures inthat concentration could react similarly tomarket developments. Thus, theFund issubject toloss duetoadverse occurrences that affect that concentration. Inaddition tothe normal risks associated with investing, investments insmaller companies typically exhibit higher volatility. KTEC isnon-diversified. ETFshares arebought andsold onanexchange atmarket price (not NAV) andarenotindividually redeemed from theFund. However, shares may beredeemed atNAV directly bycertain authorized broker -dealers (Authorized Participants) invery large creation/redemption units. Thereturns shown donotrepresent thereturns youwould receive ifyoutraded shares atother times. Shares may trade atapremium ordiscount to their NAV inthesecondary market. Brokerage commissions will reduce returns. Beginning 12/23/2020, market price returns arebased ontheofficial closing price ofanETFshare or,iftheofficial closing price isn't available, themidpoint between thenational best bidandnational best offer ("NBBO") asofthetime theETFcalculates thecurrent NAV pershare. Prior tothat date, market price returns were based onthemidpoint between theBidandAskprice. NAVs arecalculated using prices asof4:00 PMEastern Time. TheKraneShares ETFs and KFA Funds ETFs aredistributed bySEIInvestments Distribution Company (SIDCO), 1Freedom Valley Drive, Oaks, PA19456, which isnotaffiliated with Krane Funds Advisors, LLC, the Investment Adviser fortheFunds, oranysub-advisers fortheFunds. 15
16Index Definitions Hang Seng Tech Index: The Hang Seng Tech Index represents the 30 largest technology companies listed in Hong Kong that have h igh business exposure to technology themes and pass the index’s screening criteria. The index was launched on July 27, 2020. Southbound Connect Flow : Denotes the daily value of stocks purchased on the Hong Kong Stock Exchange by investors with Mainland accounts through the S tock Connect program. (Ticker H1DBTO Index) [R-SEI-KS]