2025_fall_internet_report
by Kraneshares
info@kraneshares.com +1 (212) 933 0393Fall 2025 China Internet Quarterly Earnings Report Kuaishou & Short Video Platforms Take Center Stage In China Internet
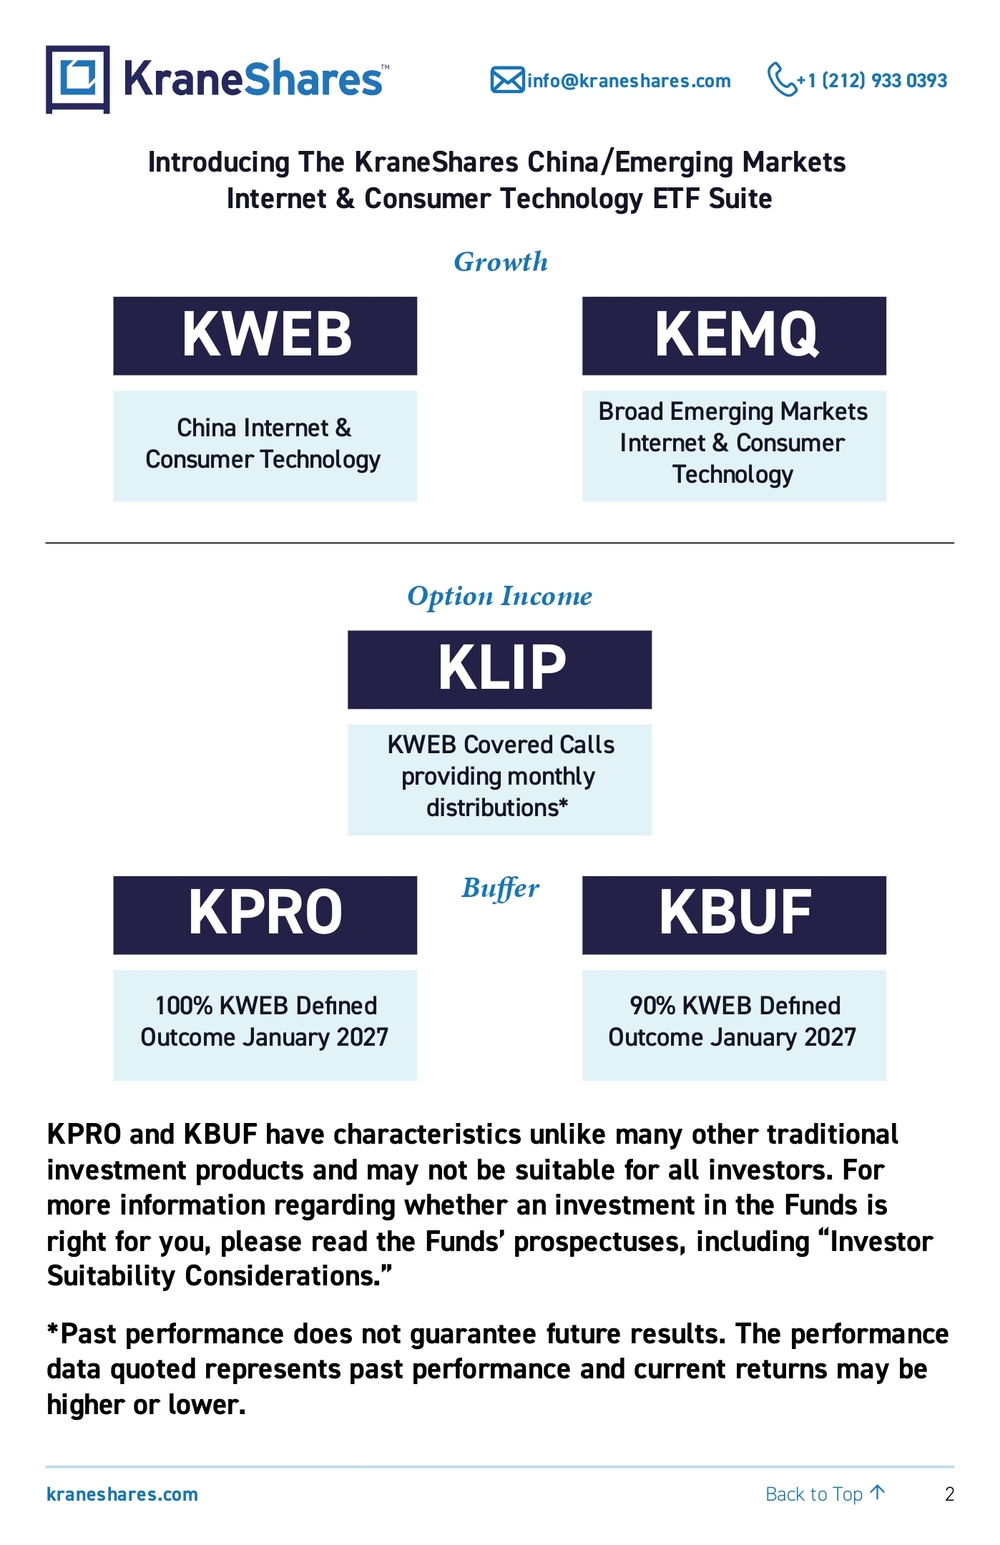
2 kraneshares.com info@kraneshares.com +1 (212) 933 0393 Back to Top ↑Introducing The KraneShares China/Emerging Markets Internet & Consumer Technology ETF Suite Option Income KLIP KWEB Covered Calls providing monthly distributions*Growth KWEB China Internet & Consumer TechnologyKEMQ Broad Emerging Markets Internet & Consumer Technology KPRO and KBUF have characteristics unlike many other traditional investment products and may not be suitable for all investors. For more information regarding whether an investment in the Funds is right for you, please read the Funds’ prospectuses, including “Investor Suitability Considerations.” *Past performance does not guarantee future results. The performance data quoted represents past performance and current returns may be higher or lower.BufferKPRO 100% KWEB Defined Outcome January 2027KBUF 90% KWEB Defined Outcome January 2027
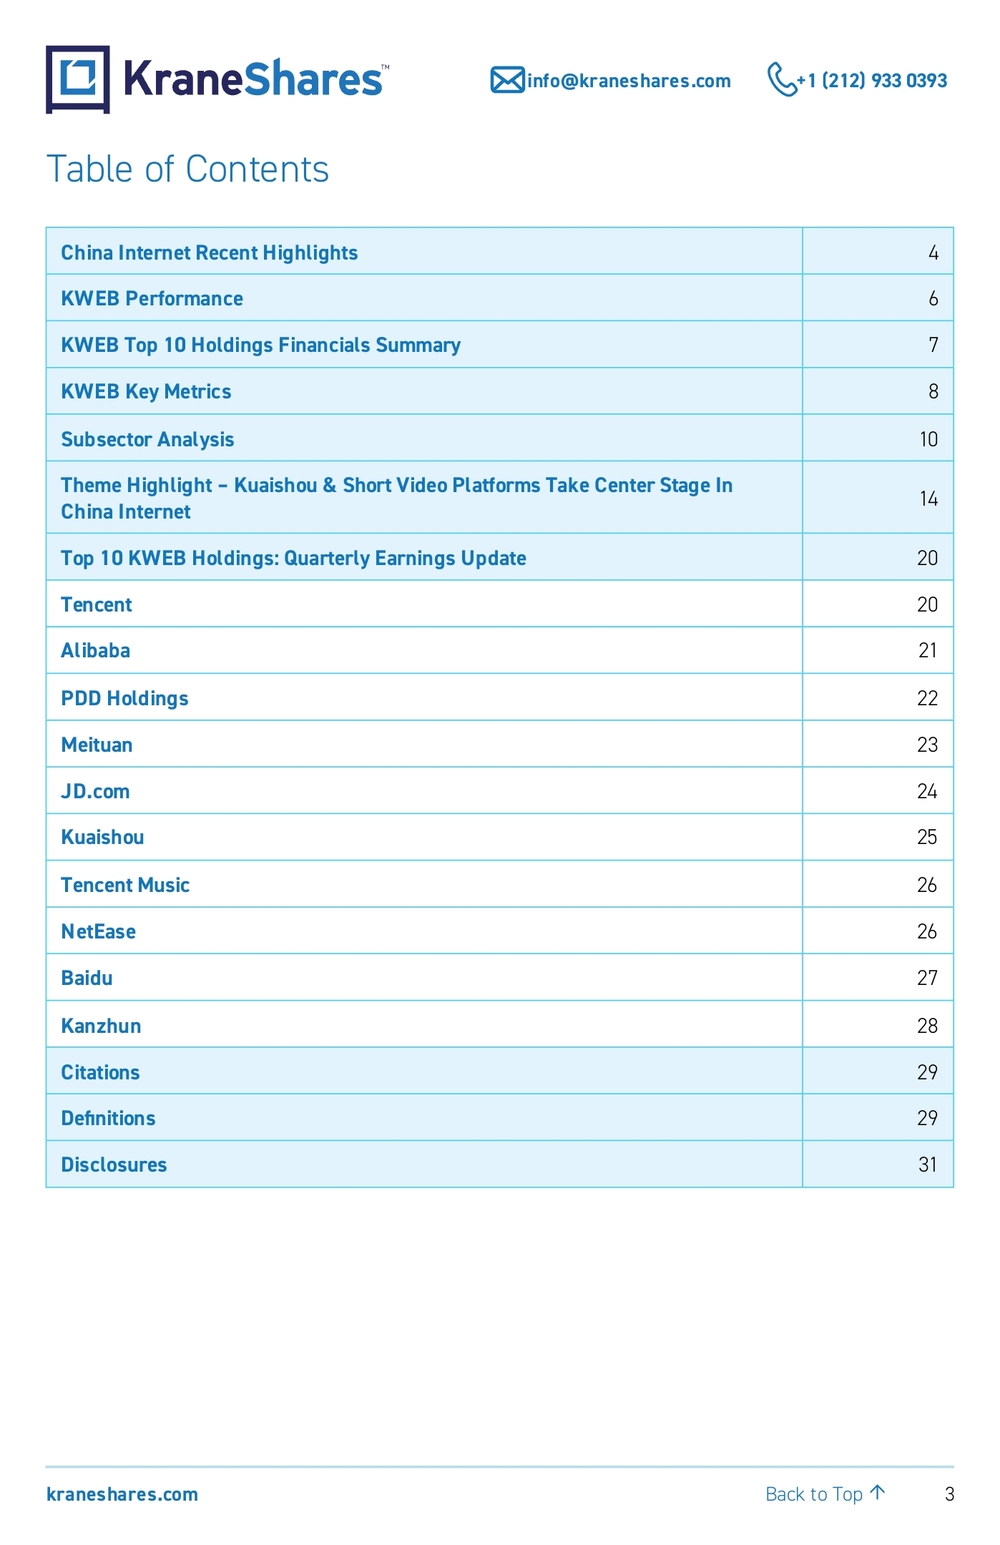
3 kraneshares.com info@kraneshares.com +1 (212) 933 0393 Back to Top ↑Table of Contents China Internet Recent Highlights 4 KWEB Performance 6 KWEB Top 10 Holdings Financials Summary 7 KWEB Key Metrics 8 Subsector Analysis 10 Theme Highlight – Kuaishou & Short Video Platforms Take Center Stage In China Internet 14 Top 10 KWEB Holdings: Quarterly Earnings Update 20 Tencent 20 Alibaba 21 PDD Holdings 22 Meituan 23 JD.com 24 Kuaishou 25 Tencent Music 26 NetEase 26 Baidu 27 Kanzhun 28 Citations 29 Definitions 29 Disclosures 31
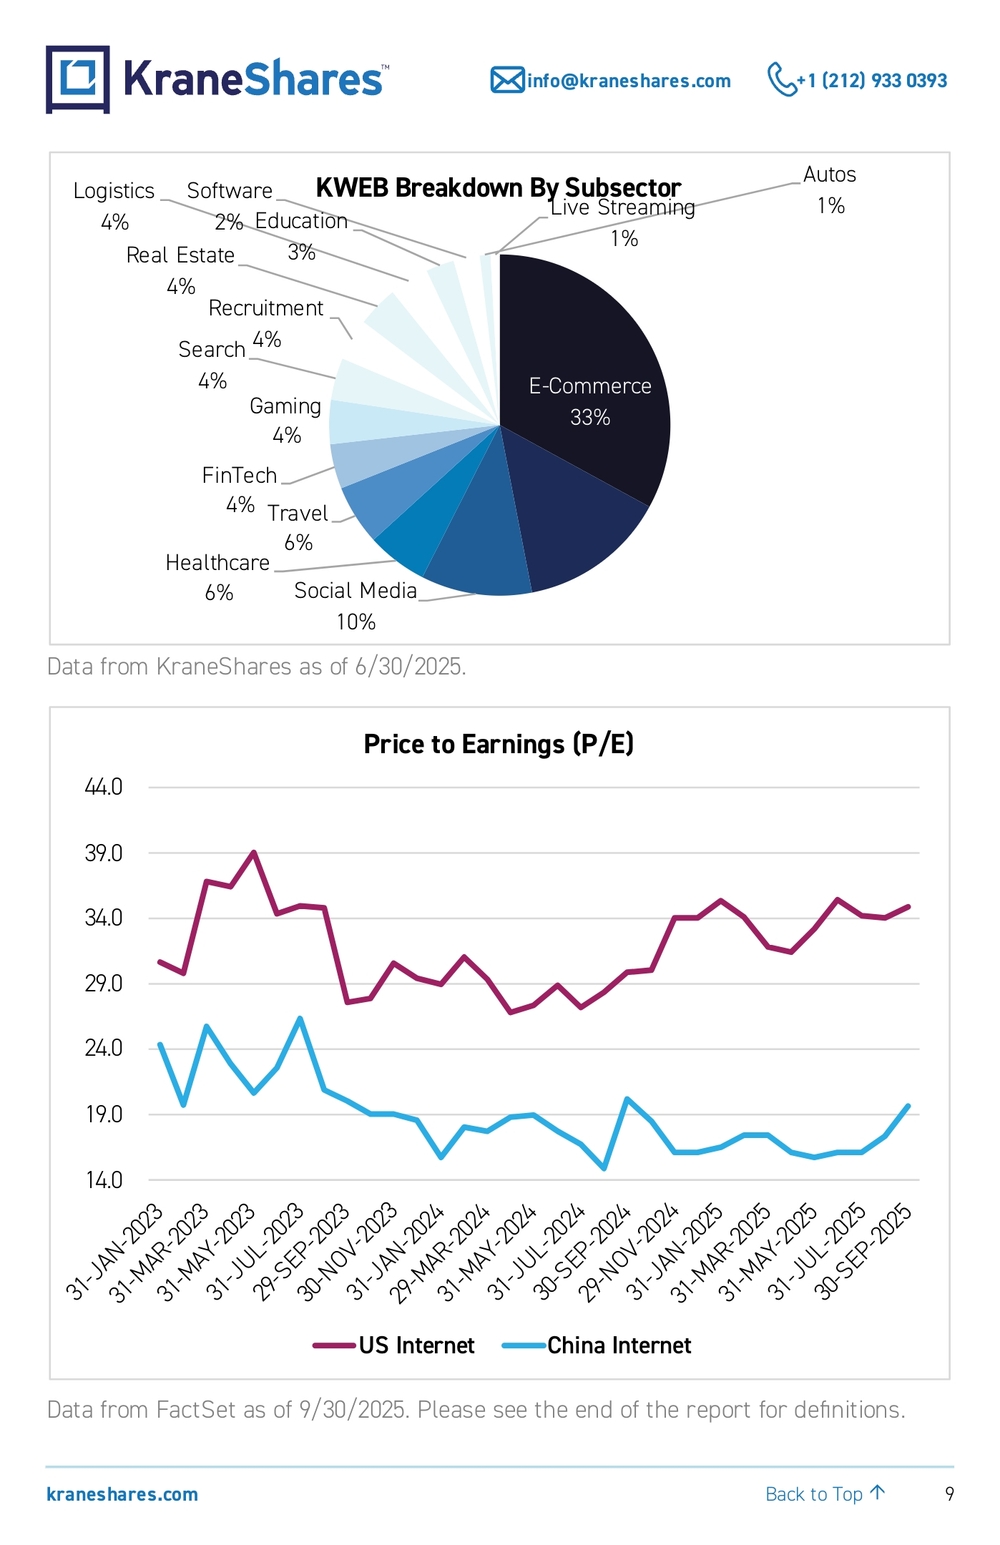
4 kraneshares.com info@kraneshares.com +1 (212) 933 0393 Back to Top ↑China Internet Recent Highlights •KWEB continues to deliver strong returns this year, delivering a total return of 43.75% year-to-date (YTD), as of September 30, 2025, compared to 18.10% for the Nasdaq 100 Index.1 •KWEB’s holdings still only trade at 19 times earnings per share, on average, compared to 35 times earnings per share for US internet companies.2 •China's internet earnings were mixed in the second quarter as video and social media-oriented companies mostly beat estimates on their top and bottom lines, whereas E-Commerce companies experienced margin pressure from instant commerce competition. However, JD, which entered the instant commerce space just this year with massive consumer subsidies, was more profitable than expected. •China's total retail sales increased 3.4% year-over-year (YoY) in August, while online retail sales for the January to August period increased 9.6% YoY.3 •China's National Radio and Television Administration (NRTA) is planning to introduce 21 new measures on TV Drama Production that will ease restrictions across the entire process, from creation and review to broadcast. These measures could benefit the video
5 kraneshares.com info@kraneshares.com +1 (212) 933 0393 Back to Top ↑streaming platforms held by KWEB. •Alibaba announced a new investment plan for its AI initiatives worth over $50 billion, along with a potential partnership with Nvidia for physical AI. •ByteDance could be selling its US TikTok platform and, crucially, licensing its algorithm to a consortium of investors, including Oracle, after President Trump indicated that a deal is near. This raised the valuation of the privately-held China internet giant in private markets.
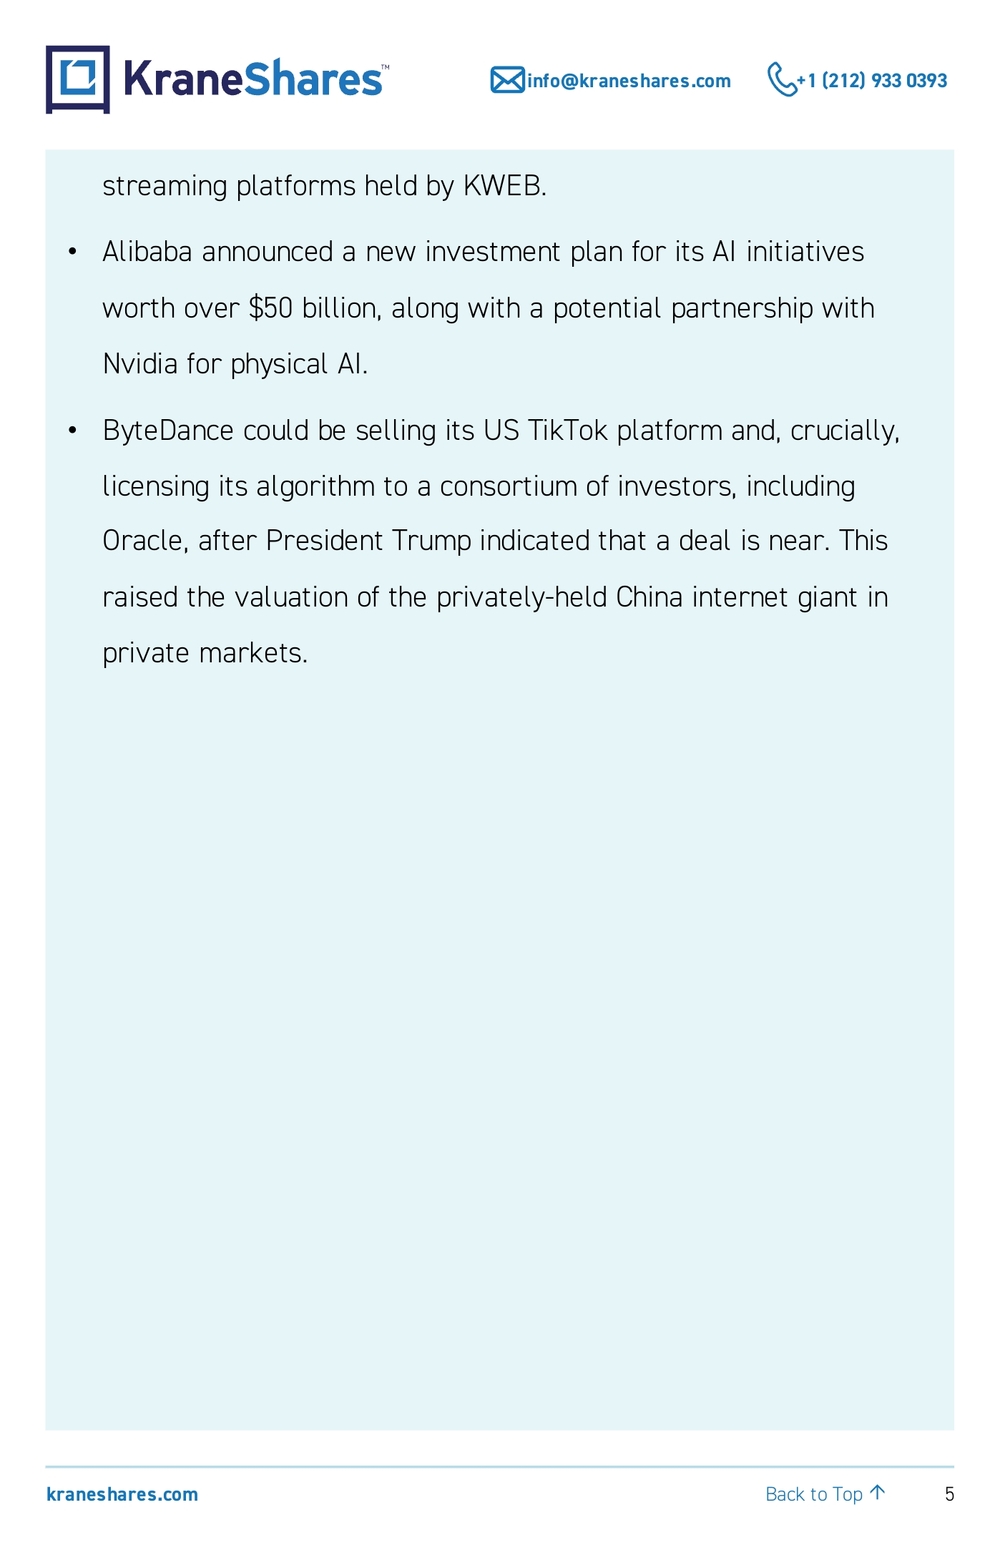
6 kraneshares.com info@kraneshares.com +1 (212) 933 0393 Back to Top ↑KraneShares CSI China Internet ETF (Ticker: KWEB) Performance Cumulative % Data as of: 09/30/2025 Fund NAV Closing Price Index 1 Month 13.04% 10.03% 12.88% 3 Month 23.91% 22.37% 23.87% 6 Month 21.38% 20.34% 20.62% YTD 43.75% 43.67% 43.31% Since Inception 104.73% 103.32% 106.07% Avg Annualized % Data as of quarter end: 09/30/2025 Fund NAV Closing Price Index 1 Year 24.86% 27.64% 24.16% 3 Year 21.77% 21.49% 21.19% 5 Year -6.65% -6.90% -6.59% 10 Year 5.41% 5.27% 5.51% Since Inception 6.06% 6.00% 6.12% KWEB’s gross expense ratio is 0.70%. Inception Date: 7/31/2013. KWEB Index is the CSI Overseas China Internet Index. The performance data quoted represents past performance. Past performance does not guarantee future results. The investment return and principal value of an investment will fluctuate so that an investor’s shares, when sold or redeemed, may be worth more or less than their original cost, and current performance may be lower or higher than the performance quoted. For performance data current to the most recent month end, please call +(1) 855 8KRANE8 or visit our website at www. kraneshares.com/kweb .
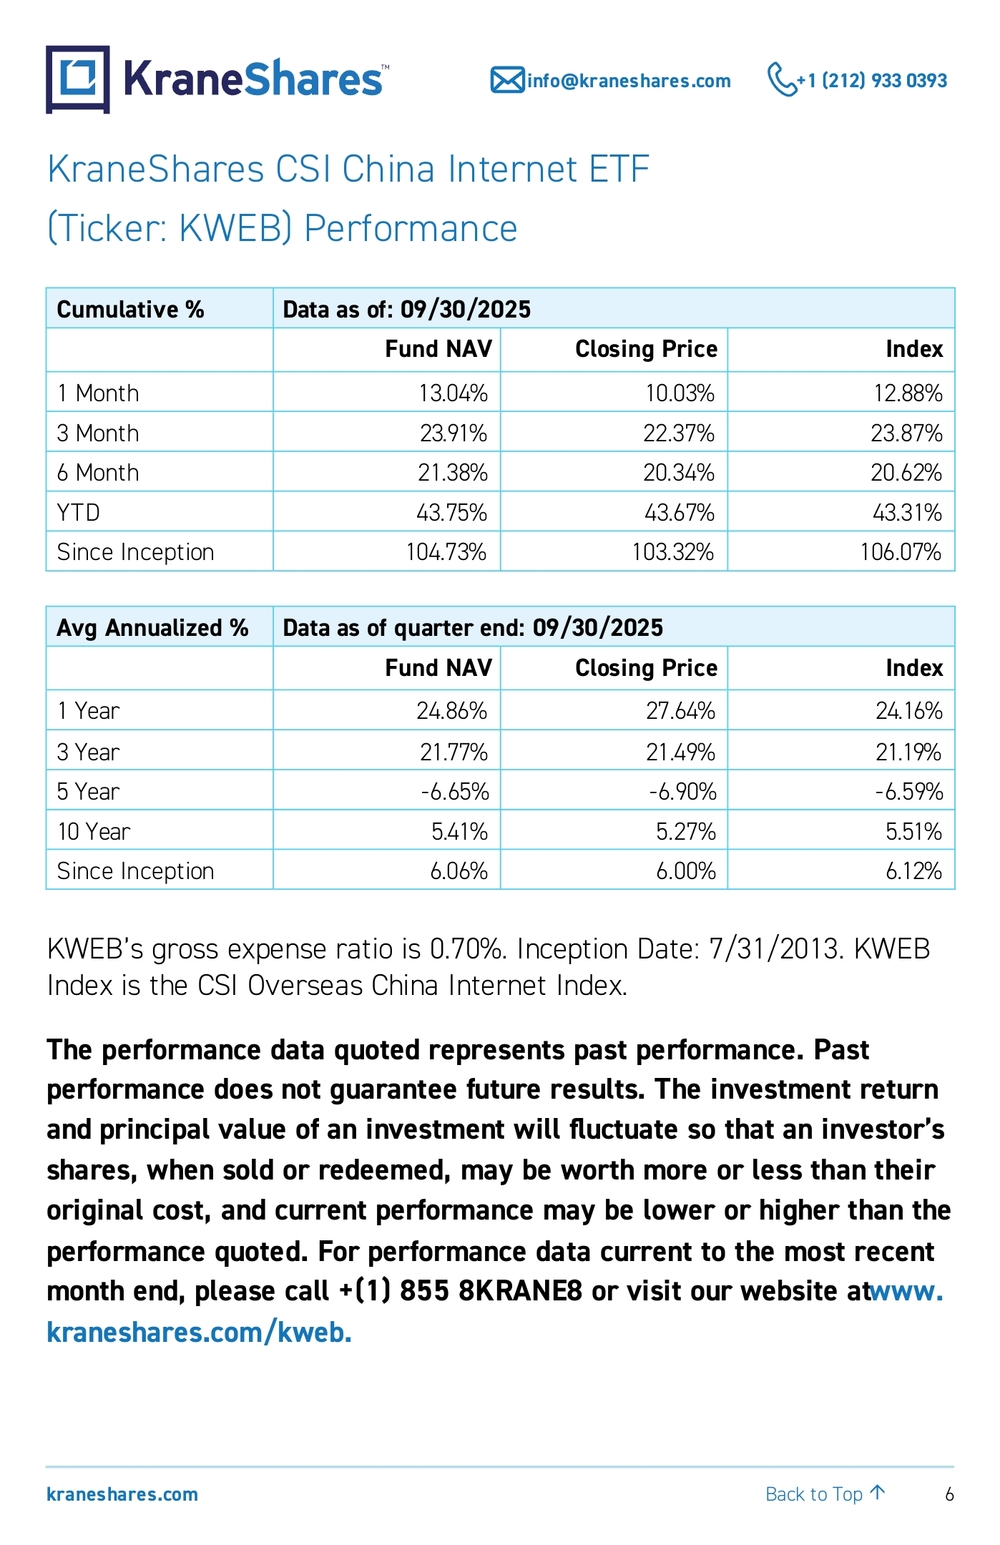
7 kraneshares.com info@kraneshares.com +1 (212) 933 0393 Back to Top ↑KWEB Top 10 Holdings Financials Summary Top 10 KWEB HoldingsKWEB Weight (%)Revenue ($ B)Net Income ($ B)Revenue Growth (%)Net Margin (%)Earnings per Share ($) Tencent 10.00 25.5 7.3 15 29 0.8 Alibaba 8.70 34.3 4.1 2 12 1.7 PDD Holdings 7.29 14.4 4.3 7 30 2.9 Meituan 6.98 12.7 0.2 12 2 0 JD.com 5.92 49.3 0.8 22 2 0.5 Kuaishou 4.37 4.8 0.7 13 15 0.2 Tencent Music 4.22 1.2 0.3 18 25 0.2 NetEase 4.18 3.9 1.2 9 31 1.8 Baidu 3.98 4.5 0.5 -4 11 1.4 Kanzhun 3.94 0.3 0.1 10 33 0.1 Total Weighted Average Total 59.58 125.4 12.2 11 18 9.6 Data as of 06/30/2025. Please see the end of the report for definitions. Figures are adjusted (non-GAAP) and % changes are year-over-year (YoY) unless otherwise indicated. Holdings are subject to change. Please see the end of the report for definitions and KWEB’s top ten holdings as of the most recent quarter-end.
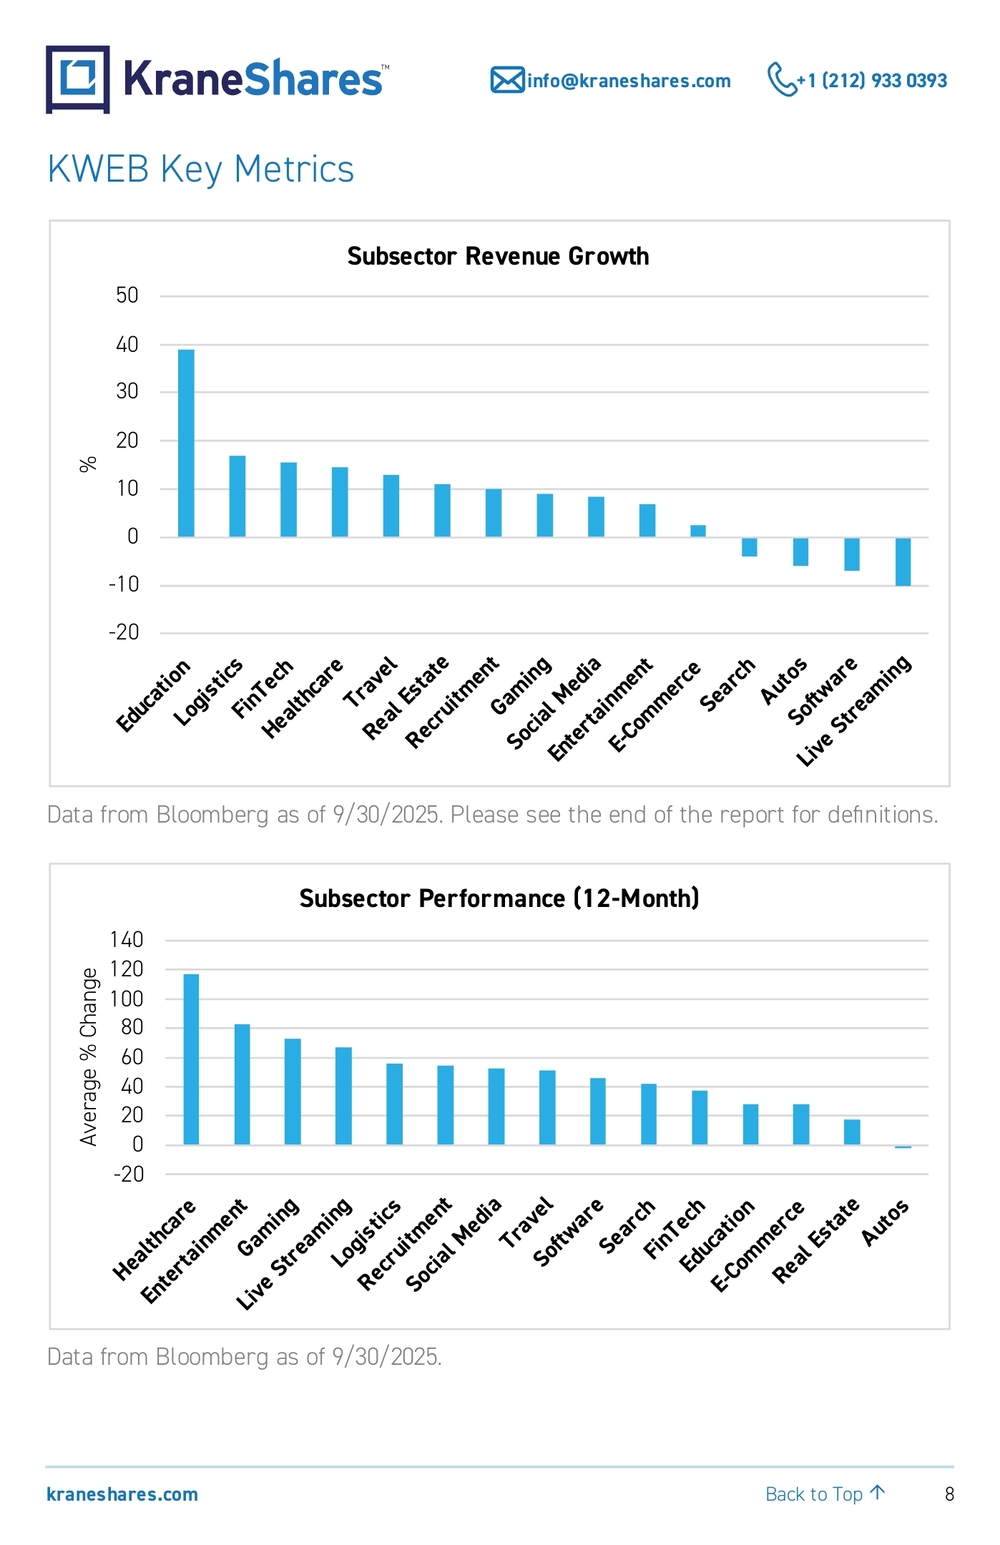
8 kraneshares.com info@kraneshares.com +1 (212) 933 0393 Back to Top ↑KWEB Key Metrics -20-1001020304050 Education Logistics FinTech Healthcare Travel Real Estate Recruitment Gaming Social Media Entertainment E-Commerce Search Autos Software Live Streaming%Subsector Revenue Growth Data from Bloomberg as of 9/30/2025. Please see the end of the report for definitions. -20020406080100120140 Healthcare Entertainment Gaming Live Streaming Logistics Recruitment Social Media Travel Software Search FinTech Education E-Commerce Real Estate AutosAverage % ChangeSubsector Performance (12-Month) Data from Bloomberg as of 9/30/2025.
9 kraneshares.com info@kraneshares.com +1 (212) 933 0393 Back to Top ↑E-Commerce 33% Entertainment 14%Social Media 10%Healthcare 6%Travel 6%FinTech 4%Gaming 4%Search 4%Recruitment 4%Real Estate 4%Logistics 4% Education 3%Software 2%Autos 1% Live Streaming 1%KWEB Breakdown By Subsector Data from KraneShares as of 6/30/2025. 14.019.024.029.034.039.044.0 31-JAN-2023 31-MAR-2023 31-MAY-2023 31-JUL-2023 29-SEP-2023 30-NOV-2023 31-JAN-2024 29-MAR-2024 31-MAY-2024 31-JUL-2024 30-SEP-2024 29-NOV-2024 31-JAN-2025 31-MAR-2025 31-MAY-2025 31-JUL-2025 30-SEP-2025Price to Earnings (P/E) US Internet China Internet Data from FactSet as of 9/30/2025. Please see the end of the report for definitions.
10 kraneshares.com info@kraneshares.com +1 (212) 933 0393 Back to Top ↑Subsector Analysis Sources: Bloomberg, CICC Research, company releases & filings, KraneShares. Changes are year-over-year unless otherwise indicated. Revenue figures are adjusted (non-GAAP). Education technology provider and tutoring company TAL Education increased its revenue by +39% in the second quarter. The company saw robust revenue growth and a strong improvement in profitability across multiple business segments, including tutoring classes and AI learning devices. Logistics provider Full Truck Alliance, sometimes referred to as the “Uber of trucking,” increased revenue +17% as fulfilled orders increased +24%. The platform also increased its profitability during the quarter, as it continues to make adjustments to its commission and subscription models. FinTech platforms increased their revenue +16%, on average, in the second quarter. New regulations capping interest rates on consumer loans at 24% threatened the profitability of some smaller players in the sub-prime lending space. However, Qifu Technology may benefit from consolidation in the space arising from the new regulation. Smaller players had been adding on other services and origination fees to continue to accommodate sub-prime borrowers without increasing their risk tolerance. This will become more difficult in future, as regulators have said that this does not count as complying with the new rule. Healthcare platforms increased revenues by +15% on average, based on their latest semi-annual earnings releases. These platforms only report earnings semi-annually. Ali Health and JD Health continue to benefit
11 kraneshares.com info@kraneshares.com +1 (212) 933 0393 Back to Top ↑from the end of the anti-graft campaign in pharmaceutical sales in their YoY figures. Recently, policy has also become more supportive of the industry outside of the end of the campaign, as health technology has been mentioned in policy papers. However, these papers were mainly focused on biotechnology innovation. Nonetheless, these platforms could be downstream beneficiaries of innovation. Travel platforms increased their revenues by +13% on average in the second quarter. Trip.com led, beating expectations on revenue, adjusted net income, and adjusted earnings per share. Travel platforms benefited from loosened visa rules for foreigners visiting China, improving AI- enabled services, and surging domestic tourism. Real Estate platform KE Holdings increased revenue by +11% and beat estimates on profitability. Home renovation and furnishing services continue to be the main revenue growth driver for the company, though analysts expect growth in this segment to slow in the coming quarters. The revenue growth baton could be passed back to new and used home sales as the real estate market picks up again in China, though the real estate market recovery has been gradual so far. Recruitment platform Kanzhun increased revenue by +11% in the second quarter, benefitting from +17% growth in monthly active users (MAUs), partially driven by the June graduation season. The company also saw profit growth thanks to strong expense controls. Their AI-enabled personalized recommendations can now deliver leads on 150,000 job postings per day.
12 kraneshares.com info@kraneshares.com +1 (212) 933 0393 Back to Top ↑Gaming company NetEase increased revenue by +9% in the second quarter. NetEase continues to benefit from a strong game launch pipeline and steady margin improvements. Online game revenue grew 15%, driven by multiple titles, including those licensed to the company by Microsoft for China distributions. The company’s growth for the quarter aligns with the growth seen in online marketing revenue for short video platforms, also seen during the period, which is covered in this edition’s theme highlight. Social Media platforms increased their revenue by +9%, on average, in the second quarter, as Tencent led over Weibo. Weibo suffered from a relatively high base comparison due to the Olympic Games in 2024 for its lackluster revenue growth, though its profitability was higher than CICC analysts had expected. Entertainment platforms increased revenue by +7%, on average, as Bilibili led the category thanks to strong advertising growth. A strong rebound in advertising and digital marketing services revenue was also reported by Kuaishou, which is covered in this edition’s theme highlight. E-Commerce companies increased revenue by a modest +3%, which was surprising given the surge in instant commerce volumes with consumer subsidies. Meanwhile, analysts had expected E-Commerce margins to have been thinner in the second quarter, but the large players mostly managed to remain profitable. Search engine Baidu decreased revenue by -4% despite strong growth in AI and cloud services as core search continues to be a pain point as queries are increasingly routed through other channels.
13 kraneshares.com info@kraneshares.com +1 (212) 933 0393 Back to Top ↑Auto purchasing platform Autohome decreased revenue by -6% after a consortium of car dealers decided not to renew their contract with the platform for marketing and sales. Nonetheless, CICC analysts believe that the company’s new partnership with Ping An to offer full lifecycle solutions to vehicle and homeowners, including insurance products, could contribute significantly to their future revenue and bottom line. Software company Kingsoft decreased revenue by -7%, mostly due to a high base comparison for some of the company’s game titles. Meanwhile, its office software and enterprise AI solutions performed well, as the company announced multiple new products and features with decent initial uptake. Live Streaming platform Joyy decreased revenue by -10% but CICC analysts noted that its overall profitability continues to improve. Advertising contributed the most to the company’s bottom line, while the recovery in live streaming revenue is proceeding steadily, according to CICC analysts. The company also maintains a high cash position that may be put to use through dividends and buybacks in coming quarters. However, the platform may need to contend with increased competition overseas for its livestreams.
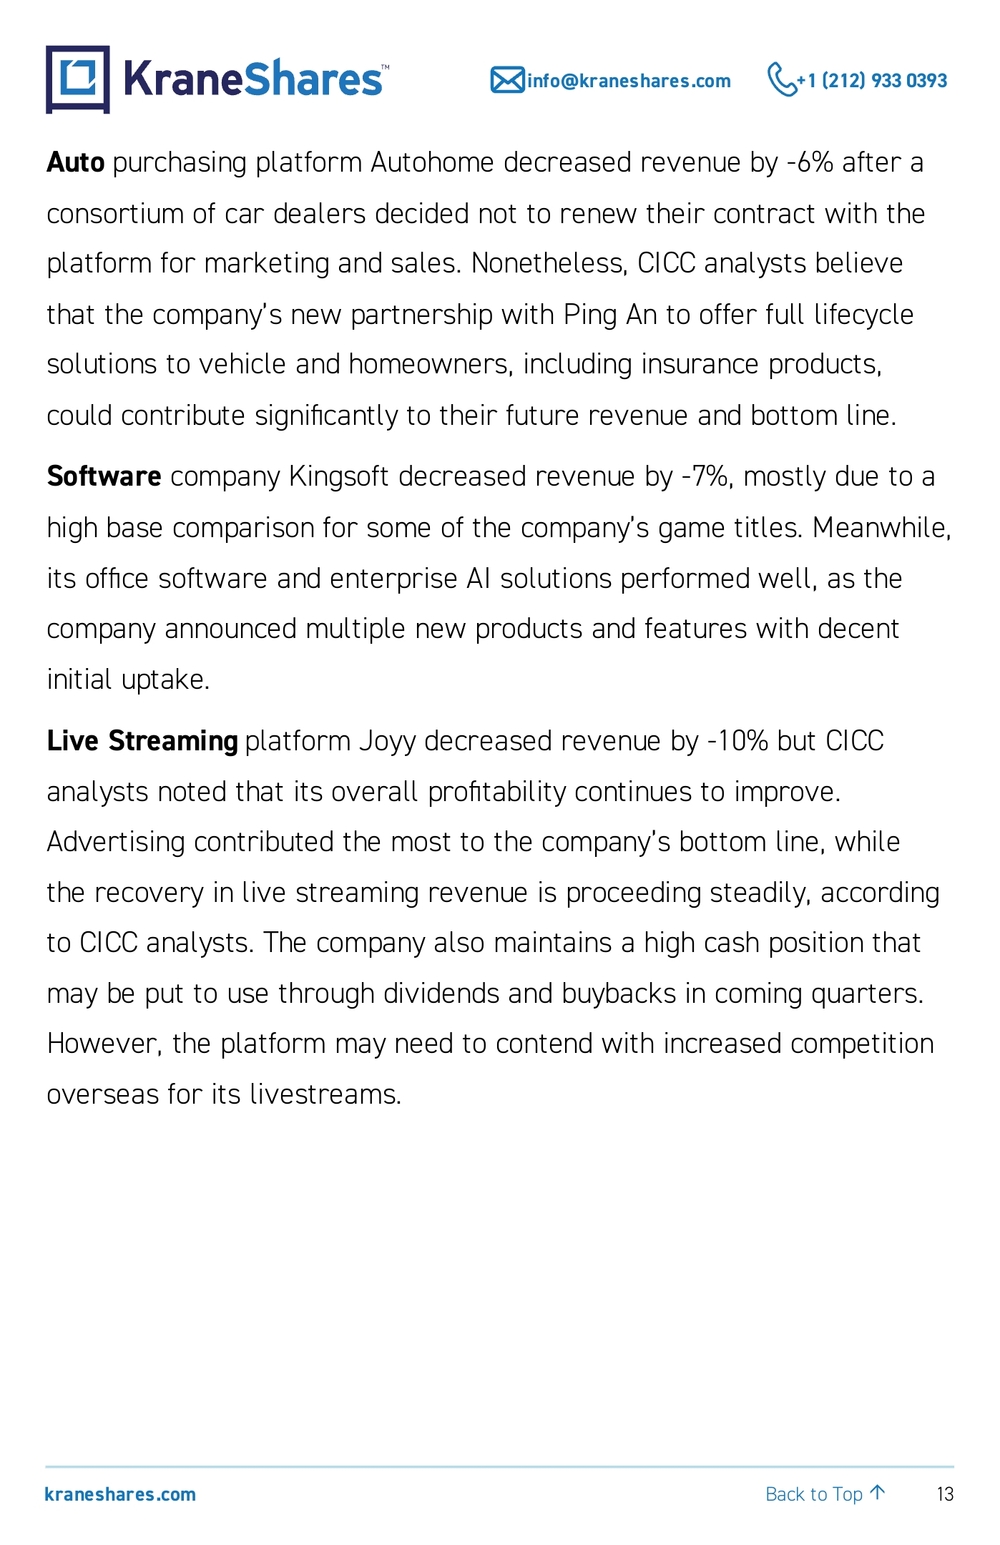
14 kraneshares.com info@kraneshares.com +1 (212) 933 0393 Back to Top ↑Theme Highlight – Kuaishou & Short Video Platforms Take Center Stage In China Internet While China’s E-Commerce giants have been engaged in a price war for the instant commerce wallet, entertainment and short-form video platforms like Kuaishou have been quietly finding success in technology and content subscriptions as well as video-based E-Commerce. By focusing on local content and offering AI editing tools to advertisers worldwide, Kuaishou has distinguished itself in this market shift, becoming competitive with ByteDance’s short-form video giant Douyin, the “TikTok” of China, as well as China’s largest E-Commerce platforms.
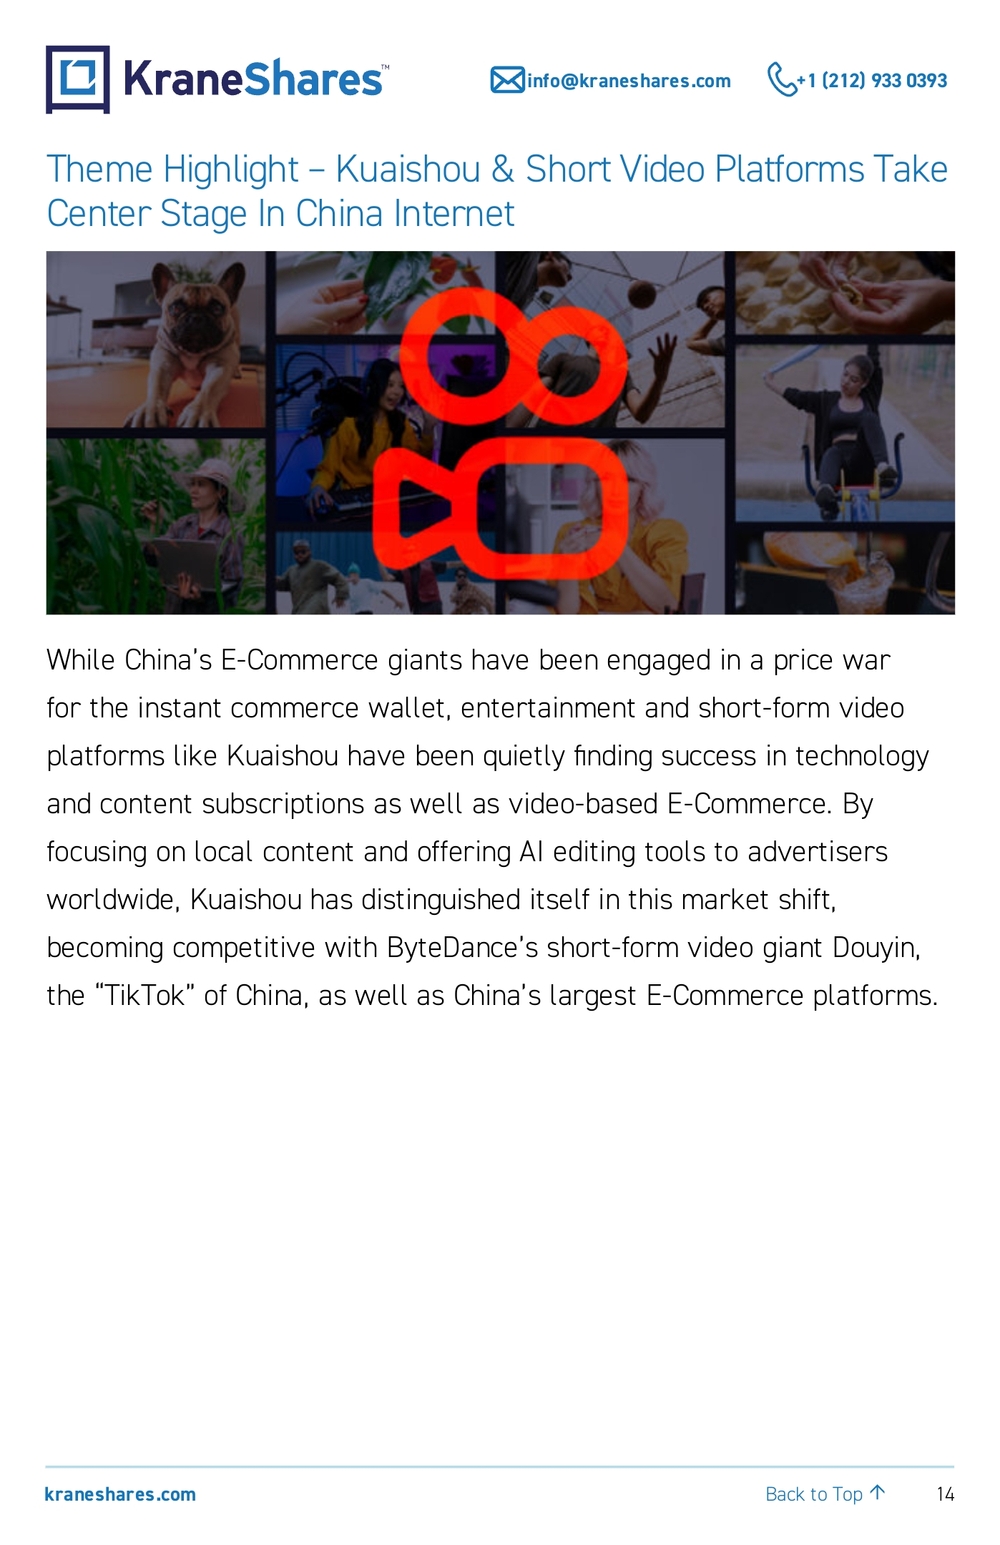
15 kraneshares.com info@kraneshares.com +1 (212) 933 0393 Back to Top ↑8,00010,00012,00014,00016,00018,00020,000 12/31/2024 1/31/2025 2/28/2025 3/31/2025 4/30/2025 5/31/2025 6/30/2025 7/31/2025 8/31/2025Growth of 10,000 unitsKuaishou Performance vs. KWEB KWEB Kuaishou Data from Bloomberg as of 9/30/2025. Past performance does not guarantee future results. Over the past twelve months, Kuaishou has increased its top-line revenue by 13% and tripled its earnings per share (EPS), based on Bloomberg data, compared to the full-year EPS for 2023. To gain a more in-depth perspective on Kuaishou’s latest results, growth, and strategy to compete with Douyin, we spoke to Matthew Zhao, Head of Investor Relations at Kuaishou. Advantages Over Douyin Matthew explained that what differentiates Douyin from other platforms is its local content focus and strong AI video generation capabilities. These strengths are helping the platform expand rapidly in rural areas and lower-tier cities, which are key sources of growth for the internet sector in China. Matthew said that while Douyin is focused on capturing global trends and
16 kraneshares.com info@kraneshares.com +1 (212) 933 0393 Back to Top ↑delivering them to China-based audiences, Kuaishou is focused on local content and offers. This tends to improve their short-video engagement over Douyin. It helps drive platform adoption and engagement in lower- tier cities and rural areas because people in these places might not be so concerned with the “latest Taylor Swift news”, as Matthew put it, but are more concerned with local deals, events, and news. While China’s internet penetration rate is strong, it still lags that of the United States. We believe most of the future growth in internet use will likely come from rural areas and lower-tier cities, so Kuaishou’s strategy could pay off. Kuaishou’s Latest Results: AI & E-Commerce Price War Benefit The Platform Matthew summarized the company’s most recent quarterly results, which indicated yet another quarter of strong revenue and profit growth. Matthew said this can be mainly attributed to domestic online marketing services, which were boosted by new AI tools for merchants. Kuaishou’s Kling AI video generator has been praised for its ability to seamlessly construct video content from complex prompts, become a favorite among advertisers, and is usually the standard-bearer for the company in international markets. The program launched its “Turbo” version 2.5 in September, which is expected to help maintain momentum. Matthew also commented that he believes the recent price war in instant delivery strengthens Kuaishou’s E-Commerce value proposition over both Douyin and E-Commerce giants Alibaba, JD, and Meituan. Matthew explained that, through its focus on lower-tier cities, the platform’s users tend to be willing to wait for products to save money. As such, Kuaishou
17 kraneshares.com info@kraneshares.com +1 (212) 933 0393 Back to Top ↑focuses on deals, rather than the speedy transport of items. Matthew believes that peers may be alienating some value-oriented users with their all-out blitz to market instant commerce services and rush to deliver products, regardless of the cost. Outlook For Kuaishou & Implications For China’s Internet Sector Kuaishou is like YouTube in the United States, but with additional features, including more direct selling and the Kuaishou AI video editing platform. Kuaishou’s revenue is currently lower than YouTube’s, at $19 billion annually compared to $36 billion annually for YouTube, which is owned by American technology giant Alphabet, according to data from Bloomberg and Statista. Nonetheless, Kuaishou has been growing at a faster rate than YouTube since 2020 and has a global revenue base like YouTube. Assuming its current growth rate is maintained, Kuaishou could reach YouTube’s current revenue level in less than five years.
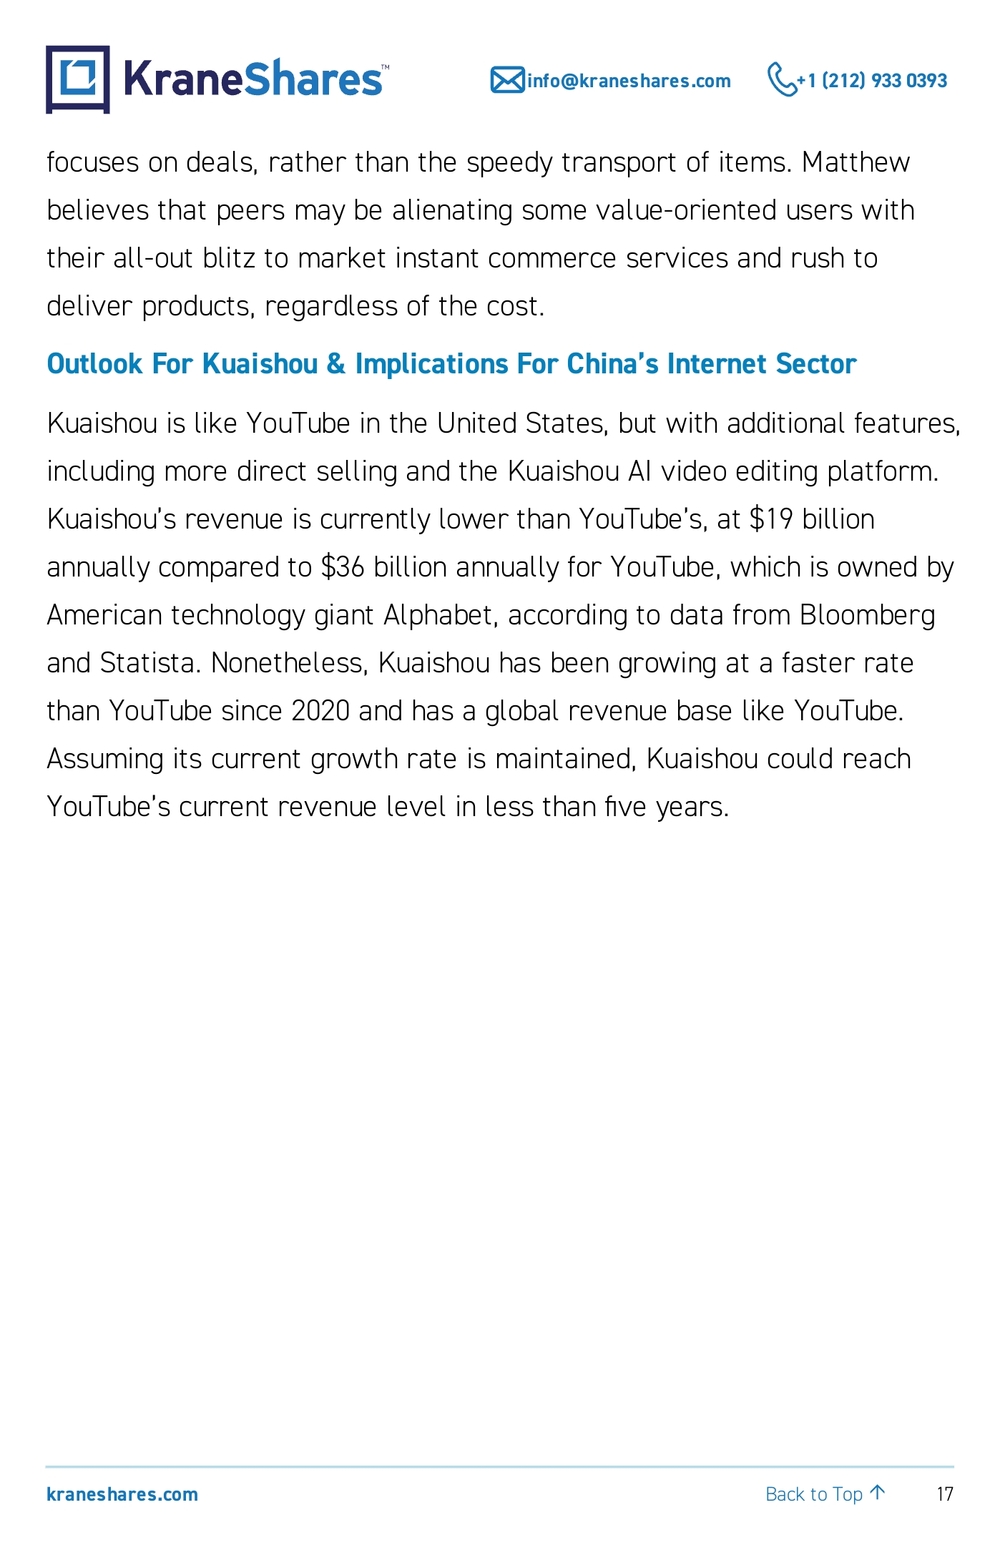
18 kraneshares.com info@kraneshares.com +1 (212) 933 0393 Back to Top ↑12%17% 0%2%4%6%8%10%12%14%16%18%20% 0510152025303540 YouTube (Ads)K uaishou$ BillionsKuaishou vs. YouTube Ads: Total Revenue & Growth Rate (2020 - 2025) 2025 2020 Compound Annual Growth Rate (%) Data from Bloomberg, Statista as of 9/30/2025. Meanwhile, despite Kuaishou’s strong performance so far this year, investors are still paying more than five times as much for shares in the earnings of YouTube’s parent Alphabet. As such, Kuaishou offers higher growth in the video segment at a lower earnings multiple.
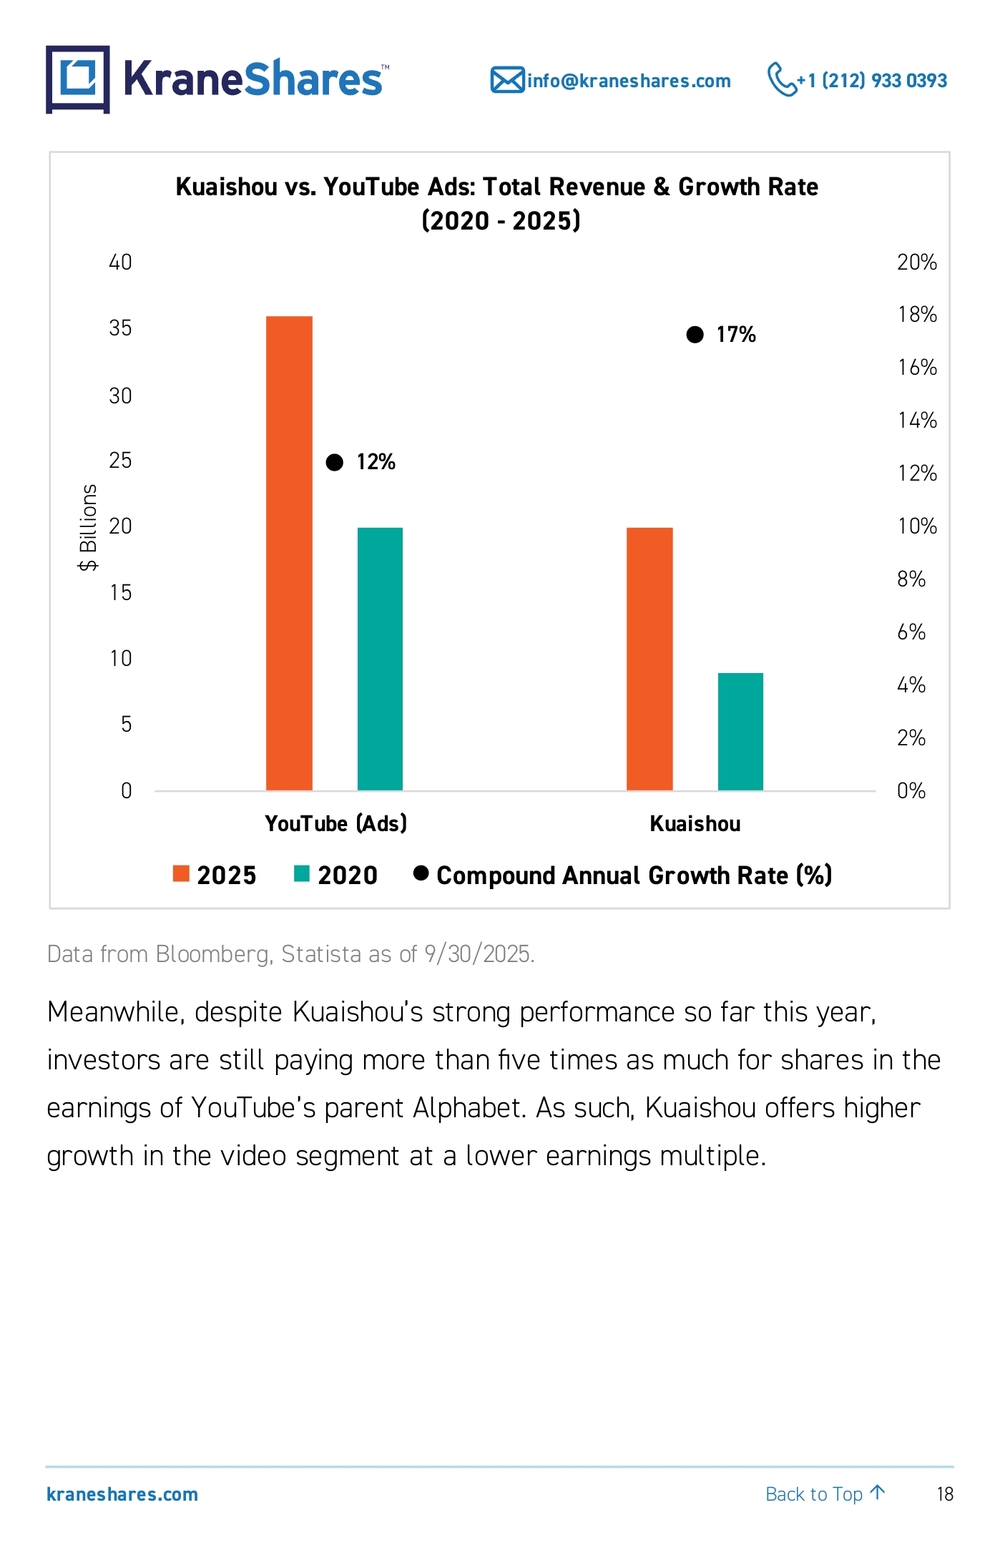
19 kraneshares.com info@kraneshares.com +1 (212) 933 0393 Back to Top ↑28.6 5.6 05101520253035 Alphabet KuaishouPrice-to-Earnings (P/E) Data from Bloomberg as of 9/30/2025. 024681012141618 Revenue Growth 3 Ye ar (%)R evenue Growth 1 Ye ar (%)Revenue Growth Comparison E-Commerce Entertainment Data from Bloomberg as of 6/30/2025. Revenue Growth is the average of the KWEB holdings in each of the indicated subsectors based on the latest earnings releases. Please see the end of the report for definitions. Kuaishou, Douyin, and others are now competing directly with E-Commerce giants in their own game, and consumers are increasingly flocking to these platforms to make purchases, not just watch videos.
20 kraneshares.com info@kraneshares.com +1 (212) 933 0393 Back to Top ↑The outperformance of Kuaishou and the entertainment subsector demonstrates the dynamism of China’s internet sector. Consumers and businesses can change quickly in new and unpredictable ways, and this is especially true in China. These subsectors are currently outpacing E-Commerce giants, but this could also reverse itself quickly, especially as instant commerce price wars subside. Conclusion China’s internet sector continues to evolve, and E-Commerce is no longer its fastest-growing subsector. Entertainment platforms are expected to account for a larger share of the sector’s growth in the medium term, after outpacing E-Commerce in the second quarter of 2025 and capturing a greater share of the consumer wallet. With a focus on locally relevant content and advanced AI-powered video editing tools for global advertisers, Kuaishou has successfully differentiated itself in this evolving landscape. As a result, Kuaishou is now a strong contender with ByteDance’s Douyin as well as some of the country’s largest E-Commerce platforms. KWEB Top 10 Holdings Earnings Update Sources: Bloomberg, CICC Research, company releases & filings, KraneShares. % changes are year-over-year unless otherwise indicated. Revenue figures are adjusted (non-GAAP). Tencent Tencent is a diversi fied consumer technology company with businesses in social media, cloud services, payments, and online advertising. Tencent’s most well-known product is WeChat, one of China’s premier social media platforms, which has over one billion monthly active users (MAUs).
21 kraneshares.com info@kraneshares.com +1 (212) 933 0393 Back to Top ↑Tencent By The Numbers (Q2 2025) •Revenue +15% to 182.1B ($25.5B) •Net Income RMB 52.1B ($7.3B) •Net Margin 29% •Earnings per Share RMB 5.7 ($0.8) In the second quarter, Tencent beat analyst estimates on its top and bottom lines. Analysts had expected a slight hit to profit growth due to AI investments, but the company managed to exceed expectations and came out ahead. The company also released multiple new AI-enabled features within games and WeChat, as well as the third version of Tencent Cloud’s AI agents. Top-line revenue growth accelerated slightly quarter-over- quarter, despite analysts' expectations of a slowdown from the first to the second quarter, driven by AI-targeted advertising. Also, Tencent’s Yuanbao AI chatbot recently ranked among the top three AI-native applications in China. Alibaba Alibaba is a conglomerate primarily engaged in E-Commerce. The company operates an online marketplace offering a wide variety of consumer goods. The company has also expanded beyond E-Commerce and is now a consortium of six businesses, covering cloud, domestic E-Commerce, global digital commerce, media, logistics, and local services. Alibaba By The Numbers (Q2 2025) •Revenue +2% to RMB 244.9B ($34.3B) •Net Income RMB 29.3B ($4.1B)
22 kraneshares.com info@kraneshares.com +1 (212) 933 0393 Back to Top ↑ •Net Margin 12% •Earnings per Share RMB 12.1 ($1.7) Alibaba’s results missed analyst expectations on the top and bottom lines. However, the revenue “miss” was a misnomer because of the sale of supermarket chain Sun Art and department store chain Intime. Revenue from these businesses was included in last year’s quarterly revenue, so the YoY comparison is weak. Excluding revenue from these businesses in the comparison, Alibaba's revenue increased 10%. The company was more profitable than expected, especially considering the high spending on consumer subsidies for instant commerce during the quarter. Taobao’s monthly active users grew 25%, as instant commerce users grew to 300 million. The company projected RMB 1 trillion in gross merchandise value (GMV) for instant commerce within the next three years. AI and cloud computing services also increased revenue by 26%. PDD Holdings PDD is an innovative global E-Commerce platform focused on the user experience. It was one of the fi rst to embrace a social media-like model for online shopping. The company’s apps are known for their group- buying capabilities, inserting gaming into shopping and earning coupons, and rock-bottom prices for private-label goods. PDD is also famous for pioneering the lowering of overhead costs through an on-demand manufacturing model. PDD operates under the name “Pinduoduo” in China and “Temu” in the rest of the world.
23 kraneshares.com info@kraneshares.com +1 (212) 933 0393 Back to Top ↑PDD By The Numbers (Q2 2025) •Revenue +7% RMB 102.8B ($14.4B) •Net Income RMB 30.7B ($4.3B) •Net Margin 30% •Earnings per Share RMB 20.7 ($2.9) PDD had an excellent quarter, despite growth slowing, as profitability increased substantially quarter-over-quarter. During the earnings call, management acknowledged the fierce competition in the E-Commerce space in China. “Revenue growth further moderated this quarter amid intense competition,” said Ms. Jun Liu, Vice President of Finance. Management also maintained its reputation for being exceedingly direct, saying: "We do not believe this quarter's profit levels are sustainable and fluctuations in profitability are likely to continue in the coming quarters." Meituan Meituan is an E-Commerce company that specializes in food delivery and other local services. The company operates many business lines, including general retail, restaurant booking, and travel booking services, and it serves over 600 million registered users. Meituan is one of China’s leading “super apps” that offer a wide variety of services, including those from third parties. Meituan By The Numbers (Q2 2025) •Revenue +12% to RMB 90.7B ($12.7B) •Net Income RMB 1.4B ($0.2B) •Net Margin 2% •Earnings per Share RMB 0 ($0)
24 kraneshares.com info@kraneshares.com +1 (212) 933 0393 Back to Top ↑Meituan’s net margin was slim during the quarter, plummeting from the nearly 10% margin achieved in the first quarter. The main culprit was increased spending on promotions to defend its food delivery market share from increasing competition. Meituan’s recent push into international markets, particularly Saudi Arabia, could present an opportunity to access more profitable markets as its profitability in China declines. However, significant investment in these operations is needed for them to become a profit center for the company. South African technology investor Prosus recently sold its long-term $4 billion stake in the company. JD.com JD.com is one of the largest E-Commerce platforms in China. JD owns a large and growing marketplace for a wide variety of goods and offers its own logistics service. JD offers its services to over 500 million users. JD.com By The Numbers (Q2 2025) •Revenue +22% to RMB 354.1B ($49.3B) •Net Income RMB 5.8B ($0.8B) •Net Margin 2% •Earnings per Share RMB 3.6 ($0.5) JD demonstrated strong top-line growth in the second quarter, driven primarily by its continued leadership in the electronics and home appliances categories, as well as the rapid expansion of its instant commerce business. JD continued to be profitable in the second quarter, though its margin was down -50% due to high spending on promotions for instant commerce.
25 kraneshares.com info@kraneshares.com +1 (212) 933 0393 Back to Top ↑JD acquired a Hong Kong supermarket chain during the quarter. JD also recently became the logistics partner for Puerto Rican singer-songwriter Bad Bunny’s global merchandise. Kuaishou Kuaishou, which translates literally as “quick hand”, is a leading short- form video and live streaming content platform in China, akin to YouTube in the United States. More than a sharing and viewing platform, Kuaishou also provides advanced tools for creators and businesses to edit their videos and increase their reach. Kuaishou By The Numbers (Q2 2025) •Revenue +13% to RMB ($4.8B) •Net Income RMB 5.0B ($0.7B) •Net Margin 15% •Earnings per Share $0.2 (RMB 1.4) Kuaishou’s daily users reached an all-time high of 409 million in the second quarter, as users spent an average of 2 hours per day on the app, a record high in terms of engagement. The company is monetizing this popularity through online marketing services, revenue from which increased by +55%, and live streaming, whose revenue increased by +30%. Kuaishou launched a new version (2.1) of its Kling AI video generation program.
26 kraneshares.com info@kraneshares.com +1 (212) 933 0393 Back to Top ↑Tencent Music Tencent Music Entertainment Group (TME) is China's largest online music and audio entertainment platform with over 500 million monthly active users (MAUs) across multiple streaming services, including QQ Music, Kugou Music, Kuwo Music, and the karaoke app WeSing. The company offers a comprehensive digital music ecosystem, providing music streaming, interactive karaoke, live streaming, and music-related video content to hundreds of millions of users. Tencent Music By The Numbers (Q2 2025) •Revenue +18% to RMB 8.6B ($1.2B) •Net Income RMB 2.1B ($0.3B) •Net Margin 25% •Earnings per Share RMB 1.4 ($0.2) Tencent Music beat analyst estimates in the second quarter, driven by premium subscription growth. “Super VIPs” make up 12% of the company’s total paying subscribers. The company has increased its profitability significantly since 2021, nearly doubling its net margin. Better user monetization has been a long-term goal for management, and it appears that they have more than delivered on this goal. However, some analysts expect a slowing of profit growth in coming quarters. NetEase NetEase is a consumer information technology company primarily dealing in online, PC, and mobile games. It is one of the largest gaming companies in the world, and its titles include Knives Out and Naraka: Bladepoint.
27 kraneshares.com info@kraneshares.com +1 (212) 933 0393 Back to Top ↑NetEase By The Numbers (Q2 2025) •Revenue +9% to RMB 27.8B ($3.9B) •Net Income RMB 8.6B ($1.2B) •Net Margin 31% •Earnings per Share RMB 12.9B ($1.8) NetEase missed estimates for total revenue and slightly missed estimates for earnings per share. The new agreement with Microsoft, formerly with Blizzard Games, should help with profitability, though, over the long term. The company’s staple titles performed well during the second quarter. NetEase, a long-time dividend star within China’s internet sector, paid an exceptionally attractive dividend in the second quarter, accounting for one-third of net profits, while buybacks slowed, a trend also observed across the internet as share prices recover. Baidu Baidu is a technology company with substantial businesses in arti ficial intelligence, search engines, cloud computing, mobility solutions, and more. Baidu operates China’s most popular search engine. Meanwhile, Baidu’s ERNIE AI chatbot has over 100 million users, and its Apollo program operates the world’s largest fl eet of robo-taxis. Baidu By The Numbers (Q2 2025) •Revenue -4% to RMB 32.1B ($4.5B) •Net Income RMB 3.6B ($0.5B) •Net Margin 11% •Earnings per Share RMB 0.7 ($0.1)
28 kraneshares.com info@kraneshares.com +1 (212) 933 0393 Back to Top ↑Baidu’s revenue decline in the second quarter was expected. Its results were in line with analyst expectations, as revenue and profitability were just slight misses. AI Cloud was a bright spot, though the weakness in core search is ongoing. Short video platforms and AI chat bots continue to erode Baidu’s ability to monetize its search traffic. While Baidu has never paid a dividend, it did spin off its stake in video platform iQiyi to shareholders. The company has $29 billion in cash on hand, which is significant considering its $47 billion market capitalization. Kanzhun Founded in 2014, Kanzhun operates “BOSS Zhipin”, which has become the largest online recruitment platform in China, as measured by monthly active users. The platform connects enterprises and individual job seekers in a seamless and interactive manner through its mobile- first application. Kanzhun By The Numbers (Q2 2025) •Revenue +10% to RMB 2.1B ($0.3B) •Net Income RMB 0.7B ($0.1B) •Net Margin 33% •Earnings per Share RMB 0.7 ($0.1) Kanzhun beat analyst estimates on its top and bottom lines in the second quarter, thanks to strong growth in MAUs, up +17%, and improvements to its recommendation AI. BOSS Zhipin remains a premier job search application in China. CICC analysts were positively surprised by the company’s expense management during the quarter. However, the company’s revenue comparison quarter-over-quarter through to the third quarter might be low as the effect from the summer hiring season dissipates.
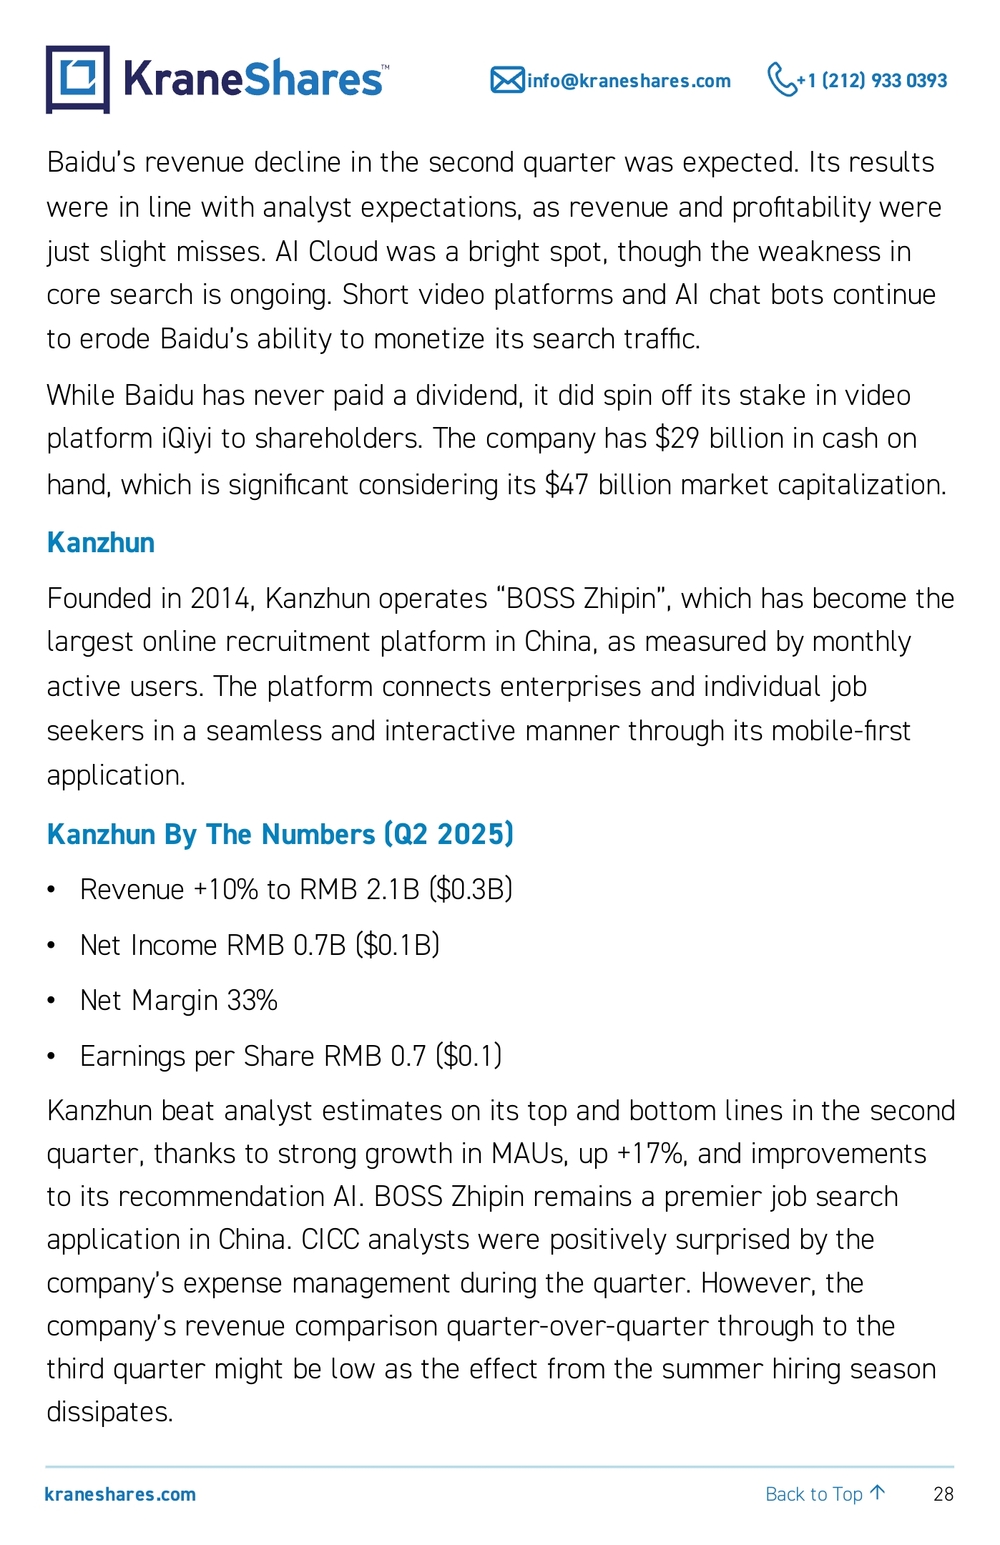
29 kraneshares.com info@kraneshares.com +1 (212) 933 0393 Back to Top ↑KWEB Top 10 Holdings as of 9/30/2025:
- Alibaba (11.36% of KWEB Net Assets)
- Tencent (10.65% of KWEB Net Assets)
- PDD Holdings (7.43% of KWEB Net Assets)
- JD.com (5.18% of KWEB Net Assets)
- Baidu (5.13% of KWEB Net Assets)
- Meituan (4.72% of KWEB Net Assets)
- JD Health (4.70% of KWEB Net Assets)
- Kuaishou (4.69% of KWEB Net Assets)
- Kanzhun (4.14% of KWEB Net Assets)
- Tencent Music Entertainment (4.07% of KWEB Net Assets) Citations
- Data from Bloomberg as of 9/23/2025.
- Data from FactSet as of 9/23/2025.
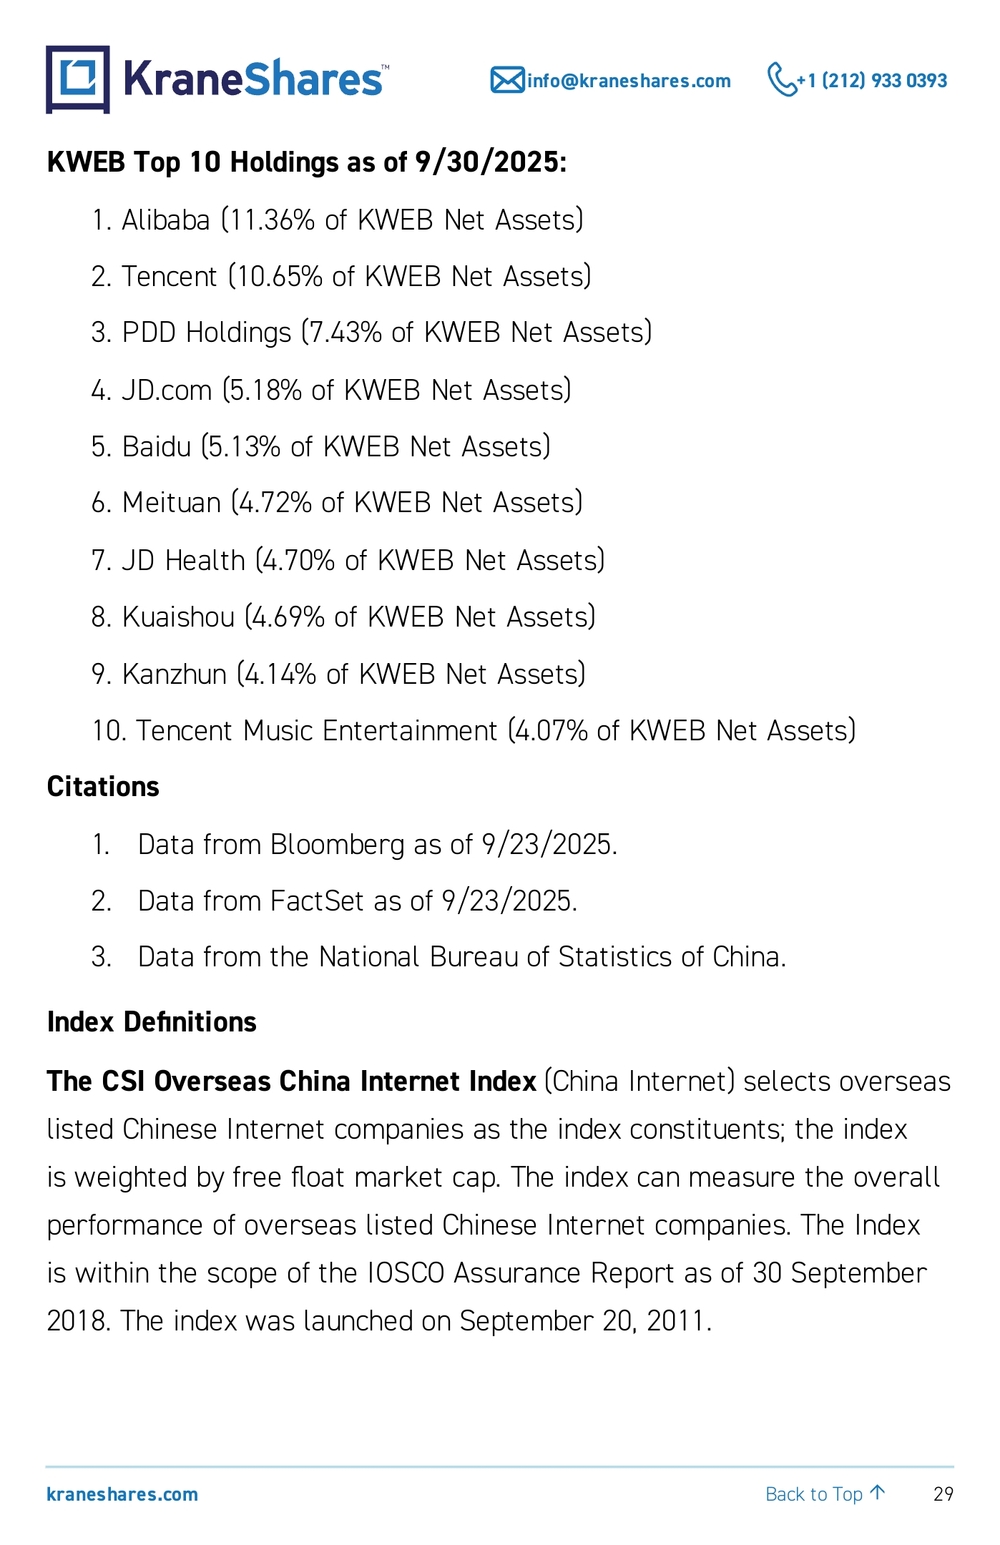
- Data from the National Bureau of Statistics of China. Index Definitions The CSI Overseas China Internet Index (China Internet) selects overseas listed Chinese Internet companies as the index constituents; the index is weighted by free float market cap. The index can measure the overall performance of overseas listed Chinese Internet companies. The Index is within the scope of the IOSCO Assurance Report as of 30 September
- The index was launched on September 20, 2011.
30 kraneshares.com info@kraneshares.com +1 (212) 933 0393 Back to Top ↑The Dow Jones US Internet Composite Index (US Internet) is designed to measure the performance of the 40 largest and most actively traded stocks of U.S. companies in the internet industry. To be eligible for the index, a company must derive at least 50% of cash flows from the internet. The index was launched on February 18, 1999. Nasdaq 100 Index: The Nasdaq-100 is a stock market index made up of equity securities issued by 100 of the largest non-financial companies listed on the Nasdaq stock exchange. It is a modified capitalization- weighted index. The index waslaunched on January 31, 1985. Revenue: The amount of cash compensation a company receives for selling goods and/or services over a certain period before the deduction of any expenses. Net Income: The amount of money left over from a company's revenue after the deduction of expenses, i.e. profit. Revenue Growth: The change in a company's revenue from one period to another. Net Margin: A company's net income divided by its total revenue. Earnings per Share (EPS): A company's net income divided by its total shares outstanding. Price to Earnings (P/E): A company's price per share divided by its earnings per share; a measure of how undervalued or overvalued a company is based on its share price.