2025_03_kspy_report
by Kraneshares
info@kraneshares.com +1 (212) 933 0393KSPY REPORT Navigating Rising Volatility As Inflation & Interest Rate Uncertainty Persist, How KSPY Can Help
2 kraneshares.com info@kraneshares.com +1 (212) 933 0393 Back to Top ↑Table of Contents KSPY Performance 3 Navigating Rising Volatility As Inflation & Interest Rate Uncertainty Persist, How KSPY Can Help4 Conclusion 9 Citations 10 Definitions 11 Disclosures 12
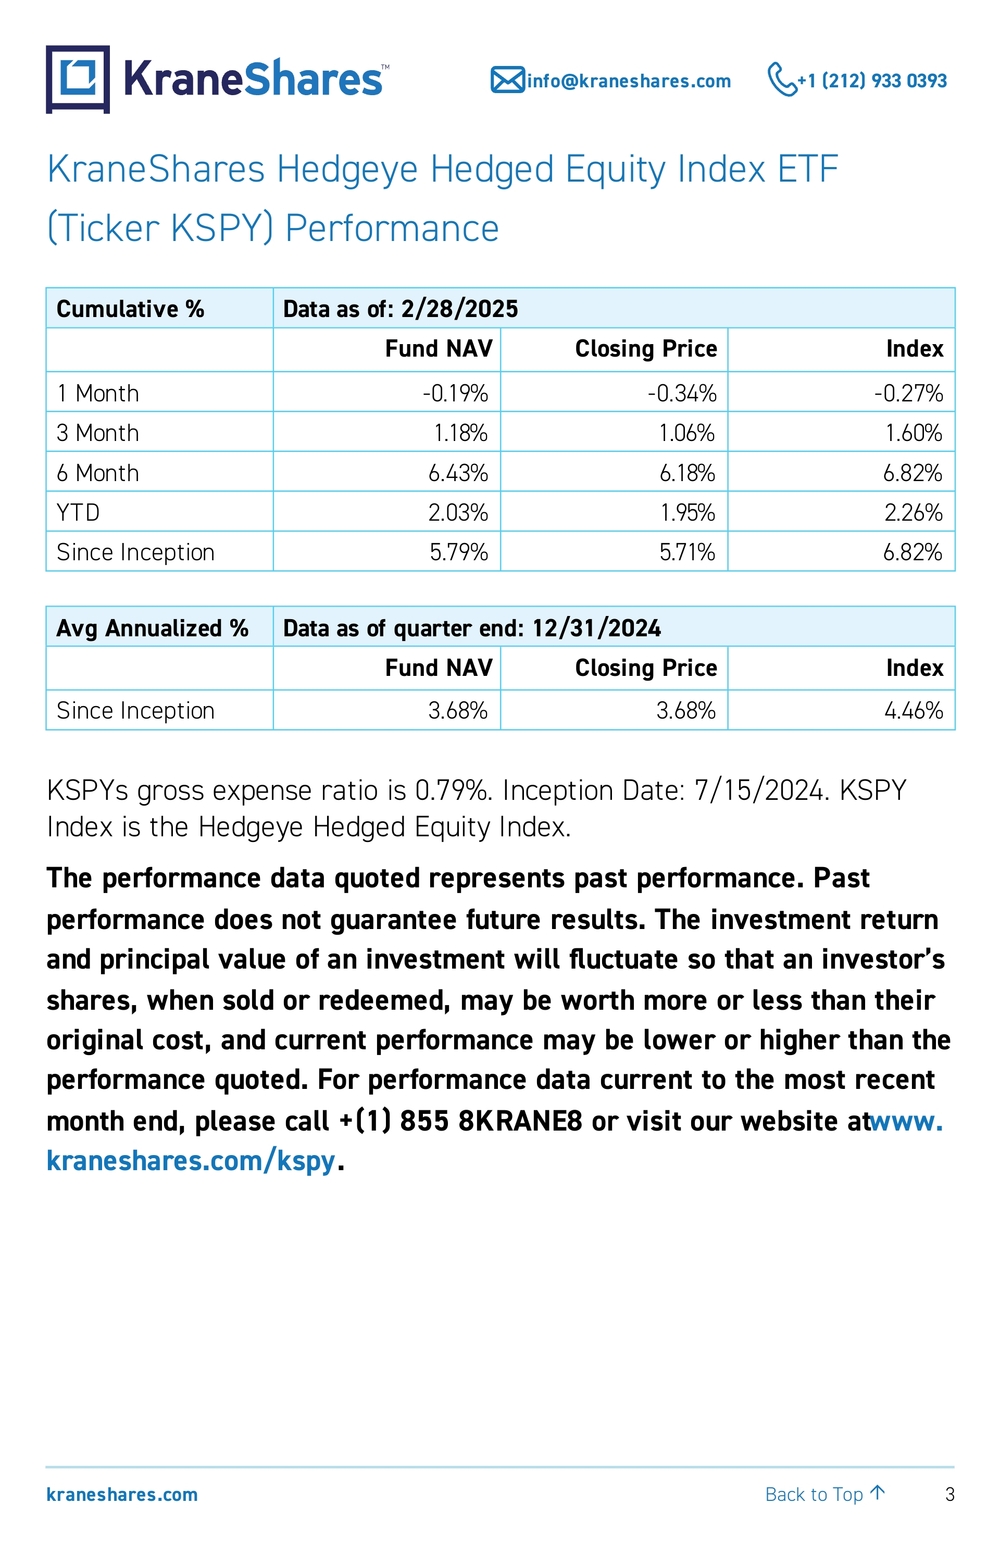
3 kraneshares.com info@kraneshares.com +1 (212) 933 0393 Back to Top ↑KraneShares Hedgeye Hedged Equity Index ETF (Ticker KSPY) Performance Cumulative % Data as of: 2/28/2025 Fund NAV Closing Price Index 1 Month -0.19% -0.34% -0.27% 3 Month 1.18% 1.06% 1.60% 6 Month 6.43% 6.18% 6.82% YTD 2.03% 1.95% 2.26% Since Inception 5.79% 5.71% 6.82% Avg Annualized % Data as of quarter end: 12/31/2024 Fund NAV Closing Price Index Since Inception 3.68% 3.68% 4.46% KSPYs gross expense ratio is 0.79%. Inception Date: 7/15/2024. KSPY Index is the Hedgeye Hedged Equity Index. The performance data quoted represents past performance. Past performance does not guarantee future results. The investment return and principal value of an investment will fluctuate so that an investor’s shares, when sold or redeemed, may be worth more or less than their original cost, and current performance may be lower or higher than the performance quoted. For performance data current to the most recent month end, please call +(1) 855 8KRANE8 or visit our website at www. kraneshares.com/kspy .
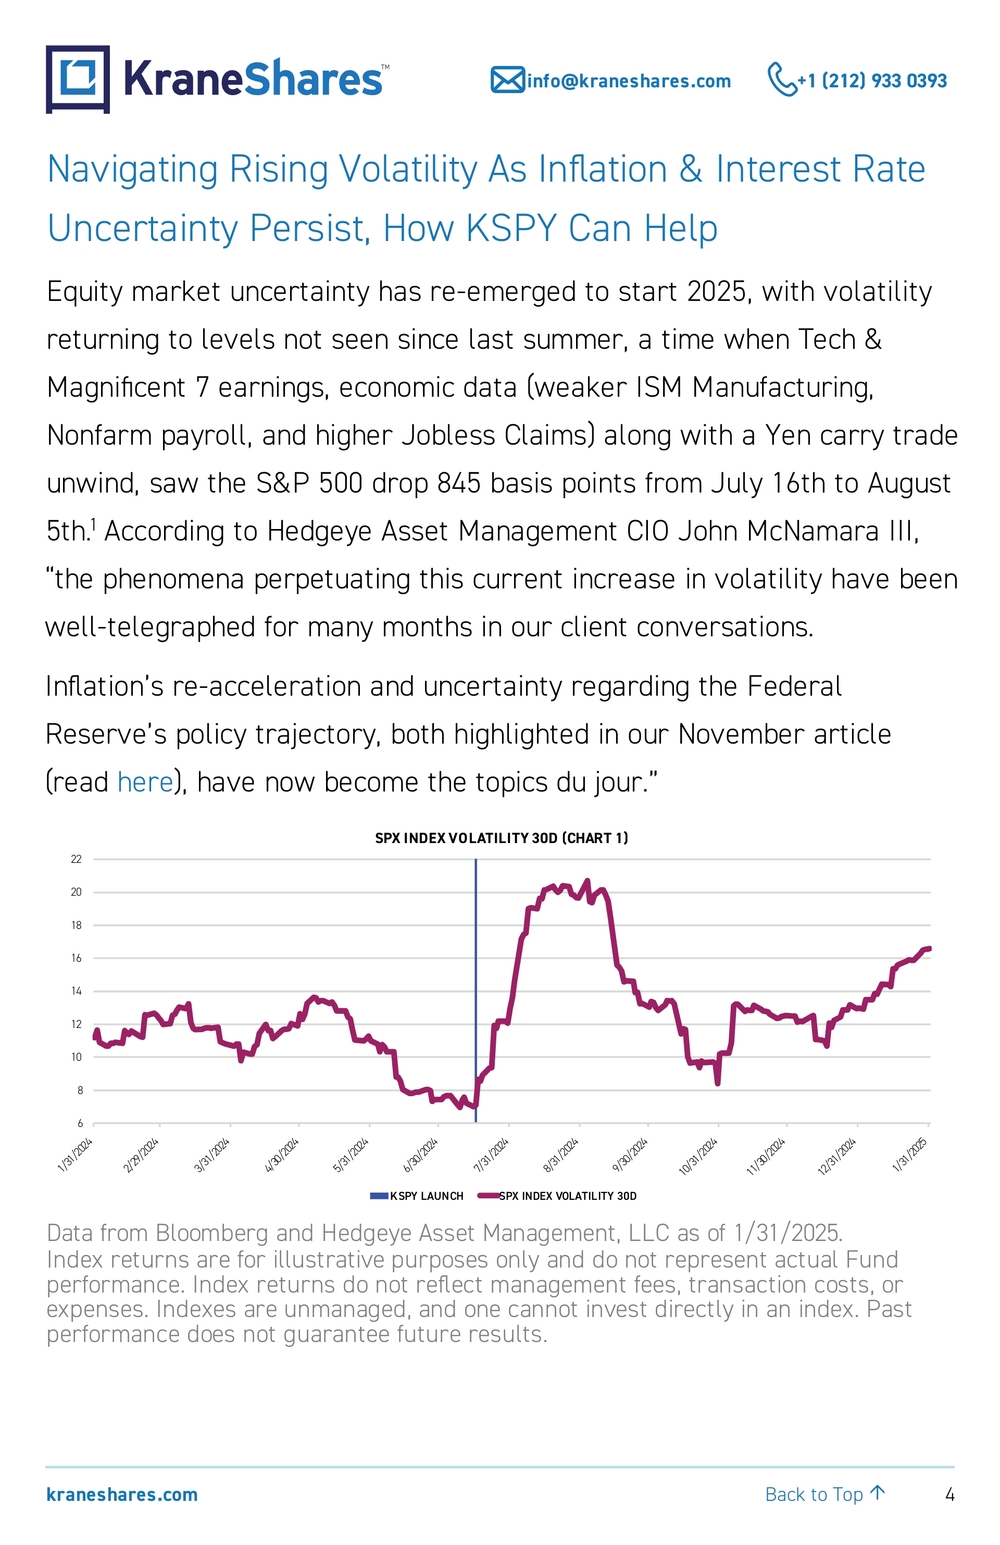
4 kraneshares.com info@kraneshares.com +1 (212) 933 0393 Back to Top ↑Navigating Rising Volatility As Inflation & Interest Rate Uncertainty Persist, How KSPY Can Help Equity market uncertainty has re-emerged to start 2025, with volatility returning to levels not seen since last summer, a time when Tech & Magnificent 7 earnings, economic data (weaker ISM Manufacturing, Nonfarm payroll, and higher Jobless Claims) along with a Yen carry trade unwind, saw the S&P 500 drop 845 basis points from July 16th to August 5th.1 According to Hedgeye Asset Management CIO John McNamara III, “the phenomena perpetuating this current increase in volatility have been well-telegraphed for many months in our client conversations. Inflation’s re-acceleration and uncertainty regarding the Federal Reserve’s policy trajectory, both highlighted in our November article (read here ), have now become the topics du jour.” 6810121416182022 1/31/2024 2/29/2024 3/31/2024 4/30/2024 5/31/2024 6/30/2024 7/31/2024 8/31/2024 9/30/2024 10/31/2024 11/30/2024 12/31/2024 1/31/2025SPX INDEX VOLATILITY 30D (CHART 1) KSPY LAUNCH SPX INDEX VO LATILITY 30D Data from Bloomberg and Hedgeye Asset Management, LLC as of 1/31/2025. Index returns are for illustrative purposes only and do not represent actual Fund performance. Index returns do not reflect management fees, transaction costs, or expenses. Indexes are unmanaged, and one cannot invest directly in an index. Past performance does not guarantee future results.
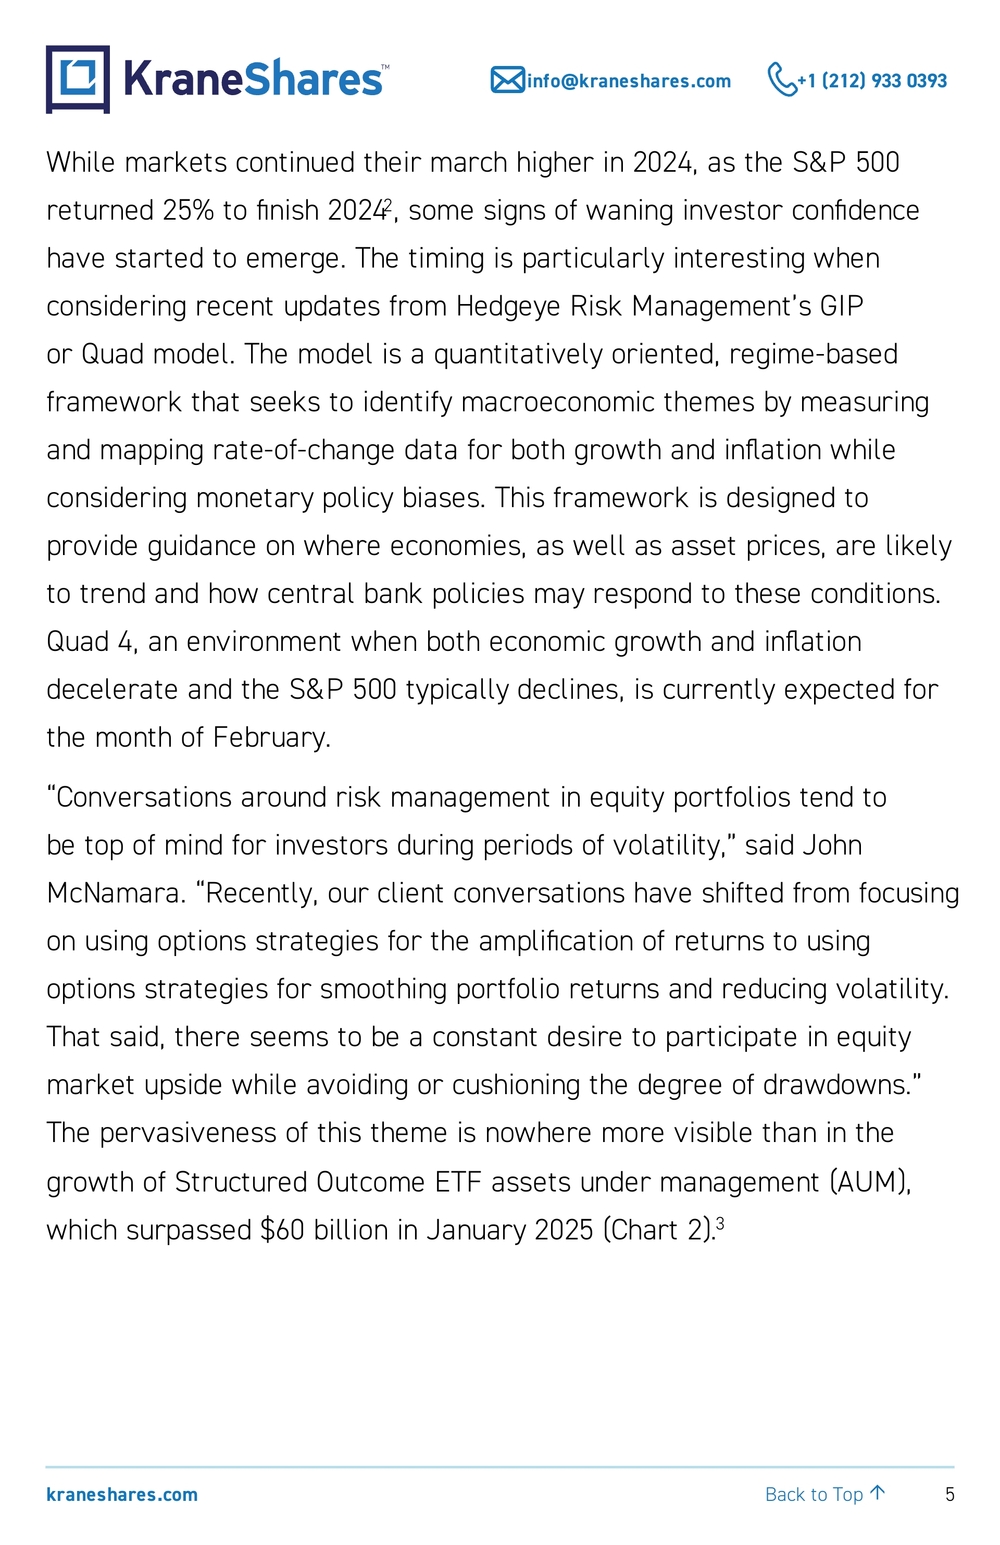
5 kraneshares.com info@kraneshares.com +1 (212) 933 0393 Back to Top ↑While markets continued their march higher in 2024, as the S&P 500 returned 25% to finish 20242, some signs of waning investor confidence have started to emerge. The timing is particularly interesting when considering recent updates from Hedgeye Risk Management’s GIP or Quad model. The model is a quantitatively oriented, regime-based framework that seeks to identify macroeconomic themes by measuring and mapping rate-of-change data for both growth and inflation while considering monetary policy biases. This framework is designed to provide guidance on where economies, as well as asset prices, are likely to trend and how central bank policies may respond to these conditions. Quad 4, an environment when both economic growth and inflation decelerate and the S&P 500 typically declines, is currently expected for the month of February. “Conversations around risk management in equity portfolios tend to be top of mind for investors during periods of volatility,” said John McNamara. “Recently, our client conversations have shifted from focusing on using options strategies for the amplification of returns to using options strategies for smoothing portfolio returns and reducing volatility. That said, there seems to be a constant desire to participate in equity market upside while avoiding or cushioning the degree of drawdowns.” The pervasiveness of this theme is nowhere more visible than in the growth of Structured Outcome ETF assets under management (AUM), which surpassed $60 billion in January 2025 (Chart 2).3
6 kraneshares.com info@kraneshares.com +1 (212) 933 0393 Back to Top ↑$0.00$5.00$10.00$15.00$20.00$25.00$30.00$35.00$40.00$45.00$50.00$55.00$60.00$65.00 Apr 19 Jul 19 Oct 19 Jan 20 Apr 20 Jul 20 Oct 20 Jan 21 Apr 21 Jul 21 Oct 21 Jan 22 Apr 22 Jul 22Oct 22 Jan 23 Apr 23 Jul 23 Oct 23 Jan 24 Apr 24 Jul 24 Oct 24 Jan 25STRUCTURED OUTCOME ETF Assets Under Management in $Billions (CHART 2) Data from Bloomberg and Hedgeye Asset Management, LLC as of 1/31/2025. Against this backdrop, KraneShares partnered with Hedgeye Asset Management to launch the KraneShares Hedgeye Hedged Equity Index ETF (Ticker: KSPY) , which seeks to help investors navigate volatility while still participating in the upside potential of U.S. equity markets. KraneShares believes that KSPY is a potentially unique tool with a dynamic approach that differentiates the strategy when compared to incumbent “Hedged” or “Buffered” products. Taking a look specifically at how KSPY’s Index compares to incumbent “Hedged” or “Buffered” products, we would note the ability to dynamically adjust portfolio delta through a systematic framework based on the utilization of Hedgeye’s Risk Range™ Signals. Similar to Hedgeye’s GIP or Quad model, these signals were developed by ex-hedge fund manager and current Hedgeye CEO Keith McCullough, with the goal of providing a quantitative risk management tool to augment fundamental views. The proprietary Risk Range™ model analyzes price, volume, and volatility to help market participants identify entry and exit points. Since 2015, the S&P 500 has closed within Hedgeye’s daily published Risk Range™
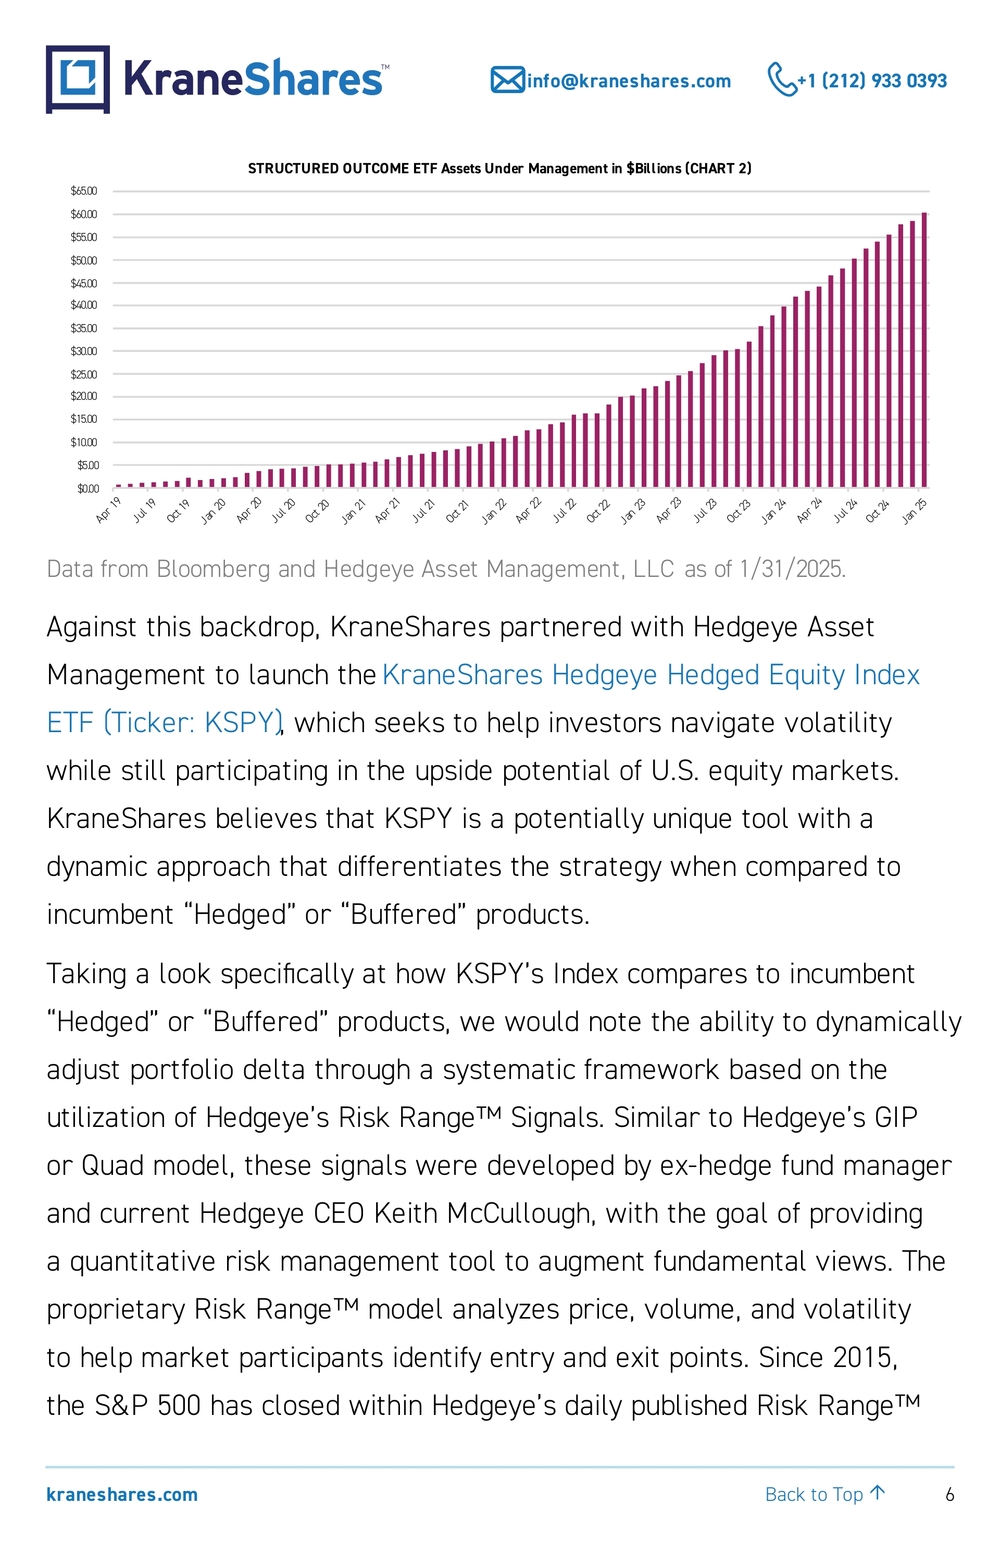
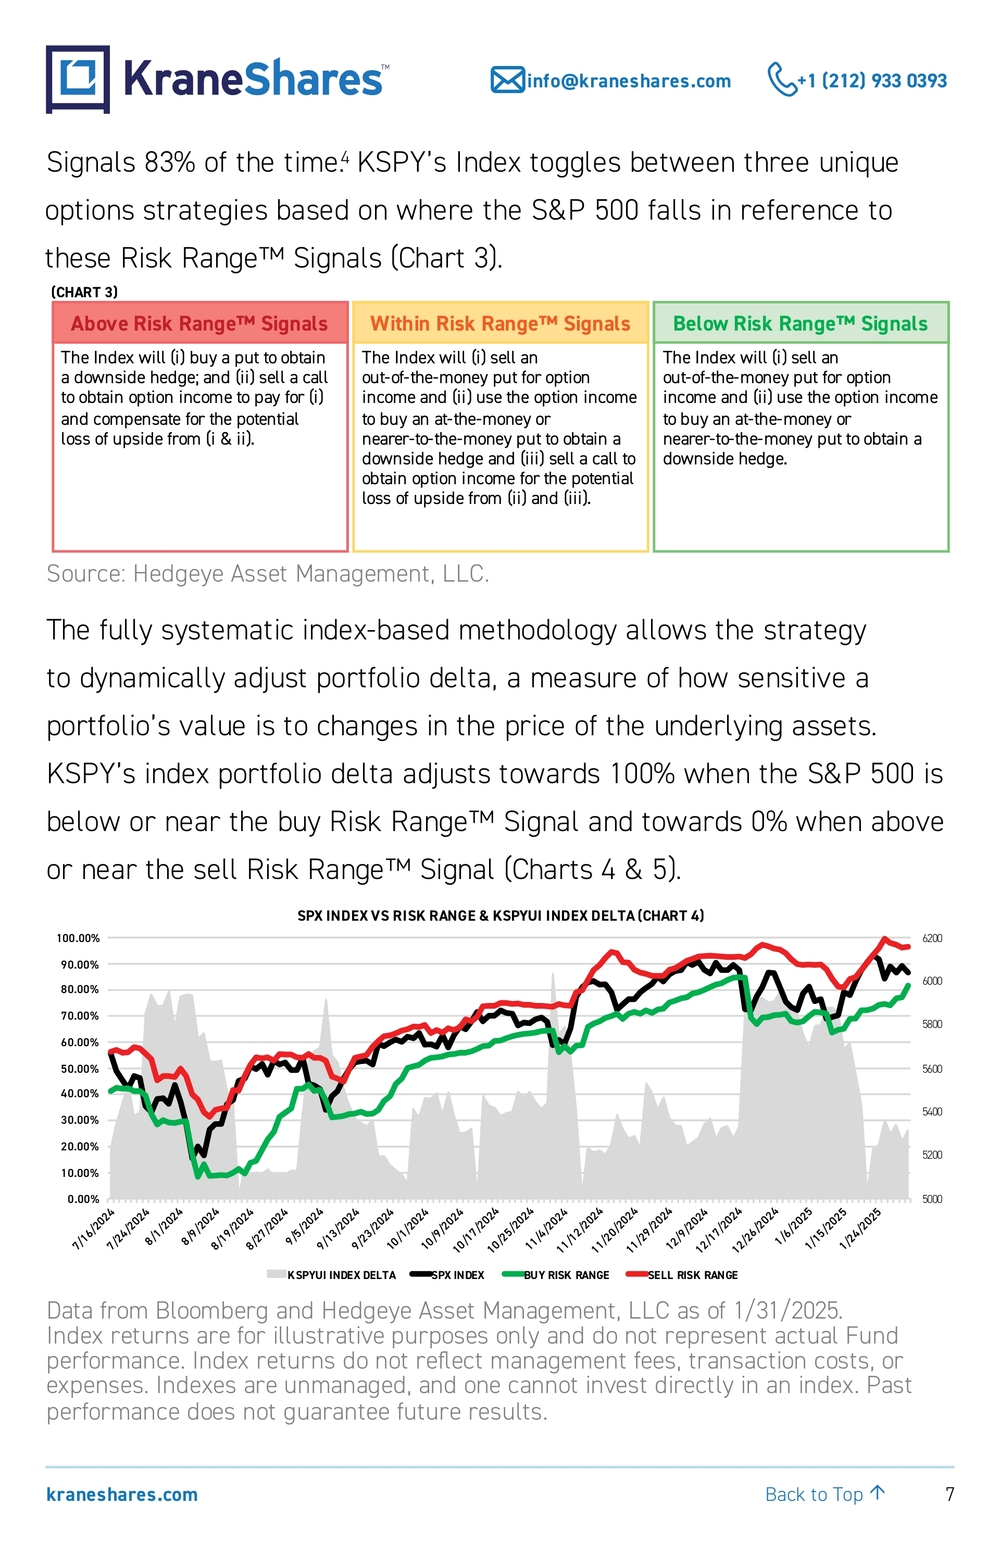
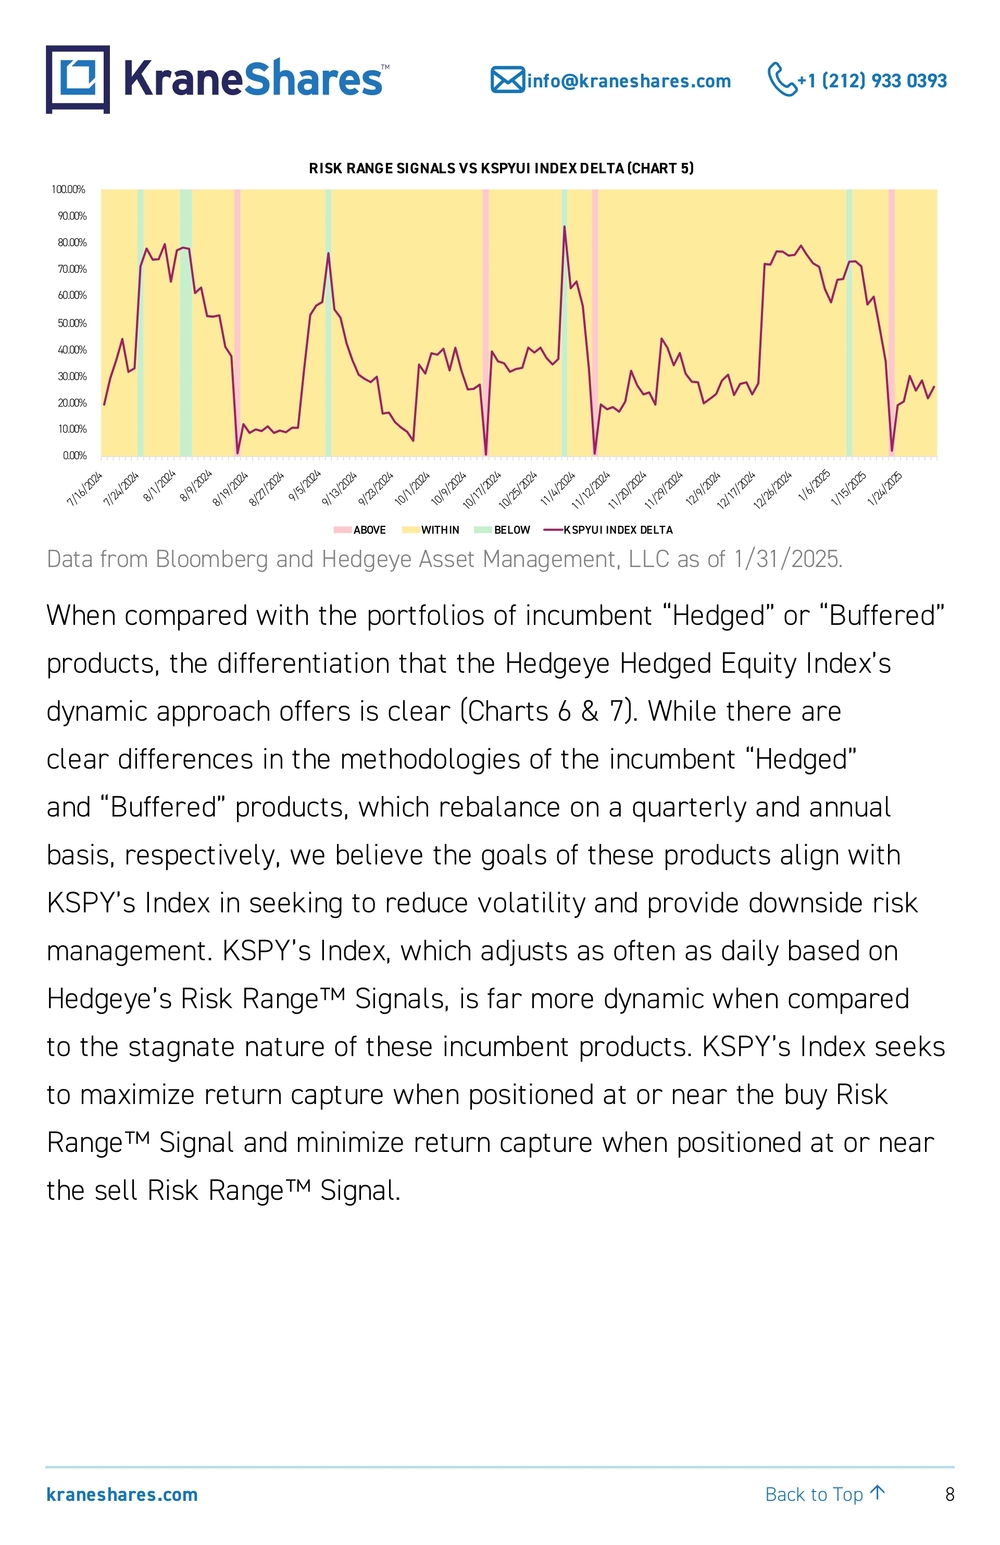
7 kraneshares.com info@kraneshares.com +1 (212) 933 0393 Back to Top ↑Signals 83% of the time.4 KSPY’s Index toggles between three unique options strategies based on where the S&P 500 falls in reference to these Risk Range™ Signals (Chart 3). Above Risk Rang e™ Signals Within Risk Rang e™ Signals Below Risk Rang e™ Signals The Inde x will (i) buy a put to obtain a downside hedge; and (ii) sell a call to obtain option income to pay for (i) and compensate for the potential loss of upside from (i & ii).The Inde x will (i) sell an out-of-the-money put for option income and (ii) use the option income to buy an at-the-money or nearer-to-the-money put to obtain a downside hedge and (iii) sell a call to obtain option income for the potential loss of upside from (ii) and (iii).The Inde x will (i) sell an out-of-the-money put for option income and (ii) use the option income to buy an at-the-money or nearer-to-the-money put to obtain a downside hedge.(CHART 3) Source: Hedgeye Asset Management, LLC. The fully systematic index-based methodology allows the strategy to dynamically adjust portfolio delta, a measure of how sensitive a portfolio’s value is to changes in the price of the underlying assets. KSPY’s index portfolio delta adjusts towards 100% when the S&P 500 is below or near the buy Risk Range™ Signal and towards 0% when above or near the sell Risk Range™ Signal (Charts 4 & 5). 5000520054005600580060006200 0.00%10.00%20.00%30.00%40.00%50.00%60.00%70.00%80.00%90.00%100.00% 7/16/2024 7/24/2024 8/1/2024 8/9/2024 8/19/2024 8/27/2024 9/5/2024 9/13/2024 9/23/2024 10/1/2024 10/9/2024 10/17/2024 10/25/2024 11/4/2024 11/12/2024 11/20/2024 11/29/2024 12/9/2024 12/17/2024 12/26/2024 1/6/2025 1/15/2025 1/24/2025SPX INDEX VS RISK RANGE & KSPYUI INDEX DELTA (CHART 4) KSPYUI INDEX DE LTA SPX INDEX BUY RISK RANGE SELL RI SK RANGE Data from Bloomberg and Hedgeye Asset Management, LLC as of 1/31/2025. Index returns are for illustrative purposes only and do not represent actual Fund performance. Index returns do not reflect management fees, transaction costs, or expenses. Indexes are unmanaged, and one cannot invest directly in an index. Past performance does not guarantee future results.
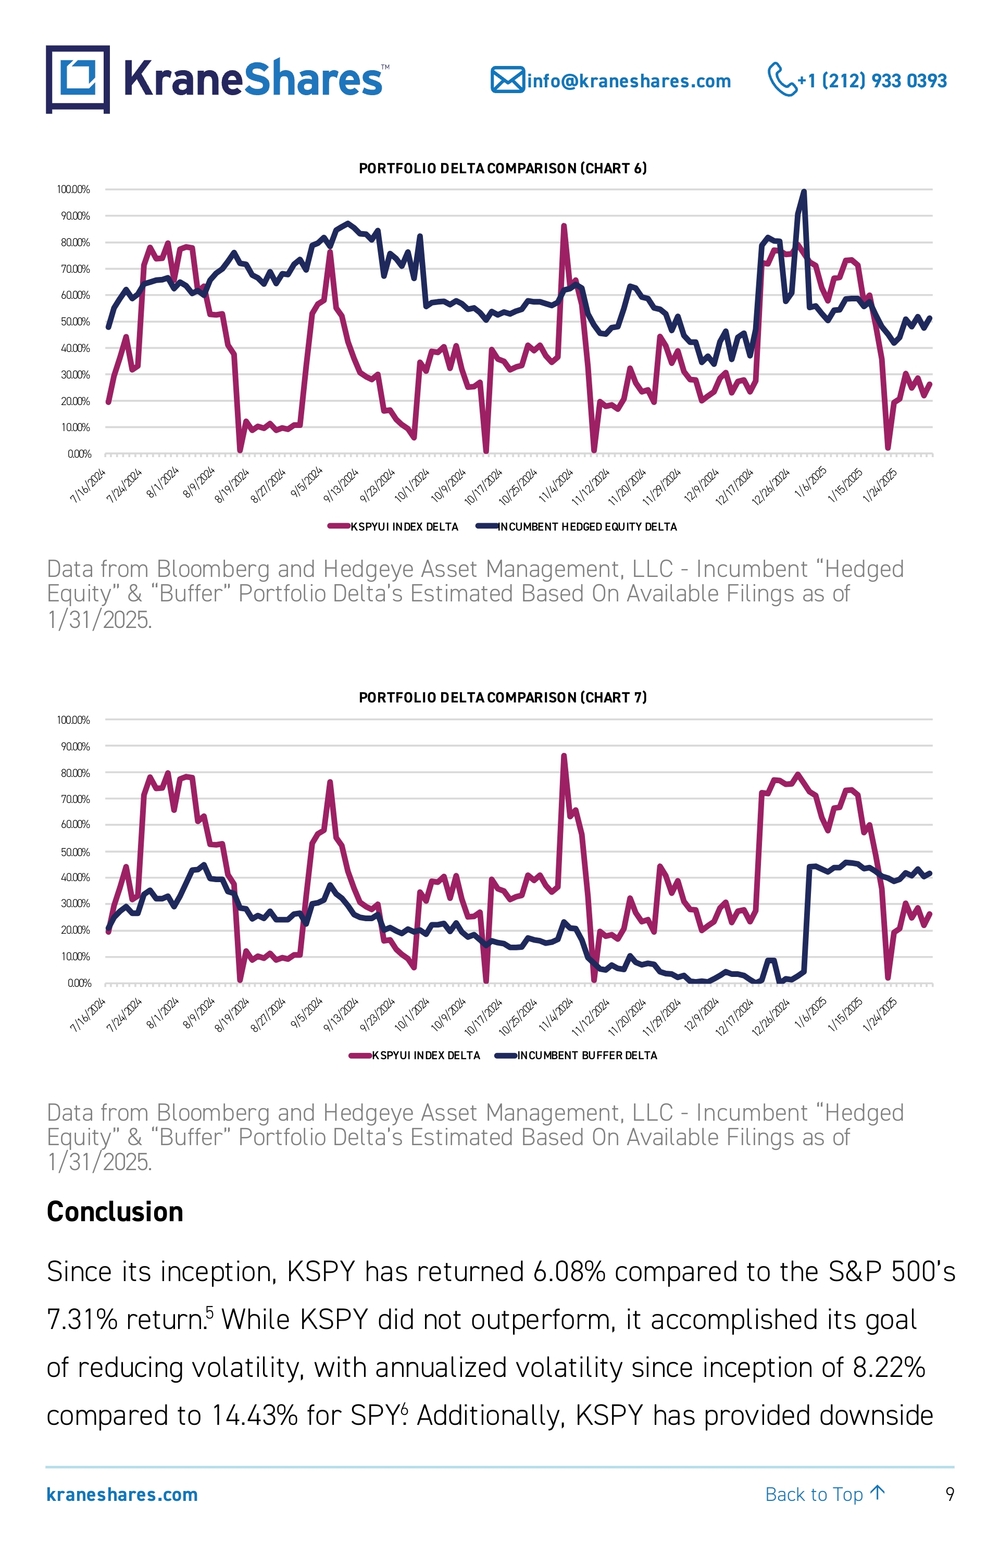
8 kraneshares.com info@kraneshares.com +1 (212) 933 0393 Back to Top ↑Data from Bloomberg and Hedgeye Asset Management, LLC as of 1/31/2025. When compared with the portfolios of incumbent “Hedged” or “Buffered” products, the differentiation that the Hedgeye Hedged Equity Index’s dynamic approach offers is clear (Charts 6 & 7). While there are clear differences in the methodologies of the incumbent “Hedged” and “Buffered” products, which rebalance on a quarterly and annual basis, respectively, we believe the goals of these products align with KSPY’s Index in seeking to reduce volatility and provide downside risk management. KSPY’s Index, which adjusts as often as daily based on Hedgeye’s Risk Range™ Signals, is far more dynamic when compared to the stagnate nature of these incumbent products. KSPY’s Index seeks to maximize return capture when positioned at or near the buy Risk Range™ Signal and minimize return capture when positioned at or near the sell Risk Range™ Signal.0.00%10.00%20.00%30.00%40.00%50.00%60.00%70.00%80.00%90.00%100.00% 7/16/2024 7/24/20248/1/2024 8/9/20248/19/2024 8/27/20249/5/20249/13/2024 9/23/2024 10/1/2024 10/9/202410/17/2024 10/25/202411/4/202411/12/2024 11/20/2024 11/29/202412/9/202412/17/2024 12/26/20241/6/20251/15/2025 1/24/2025RISK RANGE SIGNALS VS KSPYUI INDEX DELTA (CHART 5) ABOVE WITHIN BELOW KSPYUI INDEX DELTA
9 kraneshares.com info@kraneshares.com +1 (212) 933 0393 Back to Top ↑0.00%10.00%20.00%30.00%40.00%50.00%60.00%70.00%80.00%90.00%100.00% 7/16/2024 7/24/2024 8/1/2024 8/9/2024 8/19/2024 8/27/2024 9/5/2024 9/13/2024 9/23/2024 10/1/2024 10/9/2024 10/17/2024 10/25/2024 11/4/2024 11/12/2024 11/20/2024 11/29/2024 12/9/2024 12/17/2024 12/26/2024 1/6/2025 1/15/2025 1/24/2025PORTFOLIO DELTA COMPARISON (CHART 6) KSPYUI INDEX DELTA INCUMBENT HEDGED EQUITY DELTA Data from Bloomberg and Hedgeye Asset Management, LLC - Incumbent “Hedged Equity” & “Buffer” Portfolio Delta’s Estimated Based On Available Filings as of 1/31/2025. 0.00%10.00%20.00%30.00%40.00%50.00%60.00%70.00%80.00%90.00%100.00% 7/16/2024 7/24/2024 8/1/2024 8/9/2024 8/19/2024 8/27/2024 9/5/2024 9/13/2024 9/23/2024 10/1/2024 10/9/2024 10/17/2024 10/25/2024 11/4/2024 11/12/2024 11/20/2024 11/29/2024 12/9/2024 12/17/2024 12/26/2024 1/6/2025 1/15/2025 1/24/2025PORTFOLIO DELTA COMPARISON (CHART 7) KSPYUI INDEX DELTA INCUMBENT BUFFER DELTA Data from Bloomberg and Hedgeye Asset Management, LLC - Incumbent “Hedged Equity” & “Buffer” Portfolio Delta’s Estimated Based On Available Filings as of 1/31/2025. Conclusion Since its inception, KSPY has returned 6.08% compared to the S&P 500’s 7.31% return.5 While KSPY did not outperform, it accomplished its goal of reducing volatility, with annualized volatility since inception of 8.22% compared to 14.43% for SPY.6 Additionally, KSPY has provided downside
10 kraneshares.com info@kraneshares.com +1 (212) 933 0393 Back to Top ↑risk management, with downside capture since inception of 45.91% vs. SPY and upside capture of 50.57%.6 We believe KSPY can serve as a tool for investors seeking to participate in equity market upside while avoiding or cushioning the degree of drawdowns. The performance data quoted represents past performance. Past performance does not guarantee future results. The investment return and principal value of an investment will fluctuate so that an investor’s shares, when redeemed or sold, may be worth more or less than the original cost. Current performance may be lower or higher than the performance quoted. For performance data current to the last month- end, please visit kraneshares.com/kspy . For KSPY top 10 holdings, risks, and other fund information, please click kraneshares.com/kspy . Citations
- Data from Bloomberg as of 1/31/2025.
- Data from Bloomberg as of 1/31/2025.
- Data from Bloomberg and Hedgeye Asset Management LLC as of 1/31/2025.
- Data from Hedgeye Asset Management LLC as of 1/31/2025.
- Data from Bloomberg and Hedgeye Asset Management LLC as of 1/31/2025.
- Data from Bloomberg and Hedgeye Asset Management LLC as of 1/31/2025.
11 kraneshares.com info@kraneshares.com +1 (212) 933 0393 Back to Top ↑Index Definitions Hedgeye Hedged Equity Index (Ticker: KSPYUI Index): The Hedgeye Hedged Equity Index provides exposure to the S&P 500 while actively reducing volatility and providing downside risk management. The Index is managed by Hedgeye Asset Management, LLC and utilizes a model based on Hedgeye’s proprietary Risk Range™ Signals that analyze the daily trading range of the S&P 500. The Index toggles between three options strategies based on where the S&P 500 falls within these ranges. These options strategies are intended to provide downside risk management, option income, and potential compensation for the loss of upside. Depending on market conditions, the Index can change options strategies as frequently as daily. S&P 500 Index (Ticker: SPX Index): The S&P 500 is a stock market index that tracks the stock performance of 500 of the largest companies listed on stock exchanges in the United States. Term Definitions Portfolio delta: A measure of how sensitive a portfolio’s value is to changes in the price of the underlying assets. It’s a key tool for managing risk and assessing portfolio performance in different market conditions.
12 kraneshares.com info@kraneshares.com +1 (212) 933 0393 Back to Top ↑Carefully consider the Funds’ investment objectives, risk factors, charges, and expenses before investing. This and additional information can be found in the Funds’ full and summary prospectus, which may be obtained by visiting www.kraneshares.com/kspy. Read the prospectus carefully before investing. Risk Disclosures: Investing involves risk, including possible loss of principal. There can be no assurance that a Fund will achieve its stated objectives. Indices are unmanaged and do not include the effect of fees. One cannot invest directly in an index. This information should not be relied upon as research, investment advice, or a recommendation regarding any products, strategies, or any security in particular. This material is strictly for illustrative, educational, or informational purposes and is subject to change. Certain content represents an assessment of the market environment at a specific time and is not intended to be a forecast of future events or a guarantee of future results; material is as of the dates noted and is subject to change without notice. KSPY may invest in derivatives, which are often more volatile than other investments and may magnify KSPY’s gains or losses. A derivative (i.e., futures/ forward contracts, swaps, and options) is a contract that derives its value from the performance of an underlying asset. The primary risk of derivatives is that changes in the asset’s market value and the derivative may not be proportionate, and some derivatives can have the potential for unlimited losses. Derivatives are also subject to liquidity and counterparty risk. KSPY is subject to liquidity risk, meaning that certain investments may become difficult to purchase or sell at a reasonable time and price. If a transaction for these securities is large, it may not be possible to initiate, which may cause KSPY to suffer losses. Counterparty risk is the risk of loss in the event that the counterparty to an agreement fails to make required payments or otherwise comply with the terms of the derivative. Hedges may have imperfect matching
13 kraneshares.com info@kraneshares.com +1 (212) 933 0393 Back to Top ↑between the derivative and the underlying security; there is no assurance that hedging will be effective. Hedging may reduce or eliminate losses or gains. KSPY will use FLEX options from the Options Clearing Corporation (OCC). There’s a risk of the OCC failing to meet its obligations. KSPY may face challenges in less liquid FLEX options markets and have difficulty closing positions at desired times and prices. In the unlikely event the OCC becomes insolvent, KSPY could suffer losses. Failure by market participants to enter into FLEX options transactions that reflect market value could result in losses. Some FLEX options may expire worthless. Hedgeye Risk Management, LLC’s (“HRM”) ability to publish daily Risk Range™ signals is heavily dependent on the manual activities of a single individual, HRM’S CEO and founder (“Key Man”). In Key Man’s absence, the Risk Range™ signals will be published by another individual (“Secondary Calculator”). The formula utilized by the Secondary Calculator is based on a formula that incorporates the same factors as the formula used by the Key Man but this formula is not identical to the formula utilized by the Key Man. If the Key Man were to leave HRM or is unable to calculate the Risk Range™ signals, the Risk Range™ signals and the Underlying Index may not function as designed and adversely impact KSPY. KSPY is new and does not yet have a significant number of shares outstanding. If KSPY does not grow in size, it will be at greater risk than larger funds of wider bid-ask spreads for its shares, trading at a greater premium or discount to NAV, liquidation and/or a trading halt. Narrowly focused investments typically exhibit higher volatility. KSPY’s assets are expected to be concentrated in a sector, industry, market, or group of concentrations to the extent that the Underlying Index has such concentrations. The securities or futures in that concentration could react similarly to market developments. Thus, KSPY is subject to loss due to adverse occurrences that affect that concentration. Large capitalization companies may struggle to adapt fast, impacting their
14 kraneshares.com info@kraneshares.com +1 (212) 933 0393 Back to Top ↑growth compared to smaller firms, especially in expansive times. This could result in lower stock returns than investing in smaller and mid-sized companies. The Hedgeye® Hedged Equity Index (the “Index”) is a product of HAM which has contracted with S&P Opco, LLC (a subsidiary of S&P Dow Jones Indices LLC) (“SPDJI”) to license the S&P 500 Index in connection with the Index. The S&P 500 Index, S&P®, S&P 500®, the 500, US 500 are the property of SPDJI and/or its affiliates (“S&P Dow Jones Indices”) and/or their third party licensors. S&P®, S&P 500®, the 500, US 500 are registered trademarks of S&P Global Inc. and/ or its affiliates, Dow Jones® is a registered trademark of Dow Jones Trademark Holdings LLC (“Dow Jones”); and these trademarks have been licensed to S&P Dow Jones Indices and have been sublicensed for use for certain purposes by HAM. S&P Dow Jones Indices and its third party licensors shall have no liability for any errors or omissions in the S&P 500 Index and the Index is not owned, endorsed, or approved by or associated with S&P Dow Jones Indices. KSPY is based on the Index and is not sponsored, endorsed, sold or promoted by S&P Dow Jones Indices or its third party licensors. Neither S&P Dow Jones Indices nor its third party licensors make any representation or warranty, express or implied, to the owners of KSPY or any member of the public regarding the advisability of investing in securities generally or in KSPY particularly or the ability of the Index and/or the S&P 500 Index to track general market performance. S&P Dow Jones Indices’ only relationship to Hedgeye Asset Management, LLC with respect to the Index is the licensing of the S&P 500 Index and certain trademarks, service marks and trade names of S&P Dow Jones Indices or its third party licensors. S&P Dow Jones Indices and its third party licensors are not responsible for and have not participated in the determination of the prices and amount of KSPY or the timing of the issuance or sale of KSPY or in the determination or calculation of the equation by which KSPY may convert into cash or other redemption mechanics. S&P Dow Jones
15 kraneshares.com info@kraneshares.com +1 (212) 933 0393 Back to Top ↑Indices and its third party licensors have no obligation or liability in connection with the administration, marketing or trading of KSPY. There is no assurance that investment products based on the Index will accurately track index performance or provide positive investment returns. S&P Dow Jones Indices LLC is not an investment adviser, commodity trading advisory, commodity pool operator, broker dealer, fiduciary, “promoter” (as defined in the Investment Company Act of 1940, as amended), “expert” as enumerated within 15 U.S.C. § 77k(a) or tax advisor. Inclusion of a security, commodity, crypto currency or other asset within an index is not a recommendation by S&P Dow Jones Indices to buy, sell, or hold such security, commodity, crypto currency or other asset, nor is it considered to be investment advice or commodity trading advice. NONE OF S&P DOW JONES INDICES, ITS THIRD PARTY LICENSORS, HEDGEYE OR KRANE GUARANTEES THE ADEQUACY, ACCURACY, TIMELINESS AND/ OR THE COMPLETENESS OF THE S&P 500 INDEX, THE INDEX OR ANY DATA RELATED THERETO OR ANY COMMUNICATION, INCLUDING BUT NOT LIMITED TO, ORAL OR WRITTEN COMMUNICATION (INCLUDING ELECTRONIC COMMUNICATIONS) WITH RESPECT THERETO. S&P DOW JONES INDICES AND ITS THIRD PARTY LICENSORS SHALL NOT BE SUBJECT TO ANY DAMAGES OR LIABILITY FOR ANY ERRORS, OMISSIONS, OR DELAYS THEREIN. S&P DOW JONES INDICES AND ITS THIRD PARTY LICENSORS MAKES NO EXPRESS OR IMPLIED WARRANTIES, AND EXPRESSLY DISCLAIMS ALL WARRANTIES, OF MERCHANTABILITY OR FITNESS FOR A PARTICULAR PURPOSE OR USE OR AS TO RESULTS TO BE OBTAINED BY HEDGEYE, OWNERS OF THE HEDGEYE HEDGED EQUITY ETF, OR ANY OTHER PERSON OR ENTITY FROM THE USE OF THE S&P 500 INDEX, INDEX OR WITH RESPECT TO ANY DATA RELATED THERETO. WITHOUT LIMITING ANY OF THE FOREGOING, IN NO EVENT WHATSOEVER SHALL S&P DOW JONES INDICES OR ITS THIRD PARTY LICENSORS BE LIABLE FOR ANY INDIRECT, SPECIAL, INCIDENTAL, PUNITIVE, OR CONSEQUENTIAL DAMAGES INCLUDING BUT NOT LIMITED TO, LOSS OF PROFITS, TRADING LOSSES, LOST TIME OR GOODWILL, EVEN IF THEY
16 kraneshares.com info@kraneshares.com +1 (212) 933 0393 Back to Top ↑HAVE BEEN ADVISED OF THE POSSIBILITY OF SUCH DAMAGES, WHETHER IN CONTRACT, TORT, STRICT LIABILITY, OR OTHERWISE. S&P DOW JONES INDICES HAS NOT REVIEWED, PREPARED AND/OR CERTIFIED ANY PORTION OF, NOR DOES S&P DOW JONES INDICES HAVE ANY CONTROL OVER, THE LICENSEE PRODUCT REGISTRATION STATEMENT, PROSPECTUS OR OTHER OFFERING MATERIALS. THERE ARE NO THIRD-PARTY BENEFICIARIES OF ANY AGREEMENTS OR ARRANGEMENTS BETWEEN S&P DOW JONES INDICES AND HEDGEYE, OTHER THAN THE LICENSORS OF S&P DOW JONES INDICES. Hedgeye Asset Management, LLC (“HAM”) is not affiliated with the Trust, Krane, the Trust’s administrator, custodian, transfer agent or Distributor, or any of their respective affiliates. Krane and HAM have entered into an index provider agreement (the “Agreement”) pursuant to which HAM has licensed the exclusive use of the Index and certain related marks to Krane for a fee, and Krane is permitted to sublicense such rights to KSPY and uses the marks for the purpose of promoting and marketing KSPY. Under the Agreement, HAM is compensated, in part, on the asset size of KSPY and therefore benefits directly from investments in KSPY. HAM is a subsidiary of HRM. HRM provides Hedgeye Risk Range™ signals to HAM under a licensing agreement. As such, HRM benefits directly from investments in KSPY. KSPY is not in any way advised, managed, sponsored, endorsed, sold or promoted by HAM or HRM, and neither HAM nor HRM make any claim, prediction, warranty or representation whatsoever, expressly or impliedly, either as to (i) the results to be obtained from the use of the Index, (ii) the performance or price of the Index at any particular time on any particular day or otherwise, or (iii) the merchantability, fitness or suitability of the Index for the particular purpose to which it is being put in connection with KSPY. Neither HAM nor HRM has provided, nor do they provide, any financial or investment advice or recommendation in relation to the Index to Krane or its affiliates, including KSPY. All rights in the Index vest in HAM other than those licensed to
17 kraneshares.com info@kraneshares.com +1 (212) 933 0393 Back to Top ↑Krane under the Agreement. Neither HAM nor HRM makes any warranty, express or implied, as to results to be obtained by Krane or its affiliates, owners of shares of KSPY or any other person or entity from the use of the Index or any data included therein. Without limiting any of the foregoing, in no event shall HAM or HRM have any liability for any special, punitive, indirect or consequential damages (including lost profits) resulting from the use of the Index or any data included therein, even if notified of the possibility of such damages. HRM sells financial research to financial institutions and investors, including the Hedgeye Risk Range™ signals which are a critical input of the Index provided to KSPY by HRM subsidiary, HAM. HRM publishes Hedgeye Risk Range™ signals direct to its subscribers who will receive the Risk Range™ signals before KSPY due to processing time between publication and receipt of the Risk Range™ signals by KSPY. Solactive AG (“Solactive”) is the calculation agent of the Index. The financial instrument that is referencing the Index is not sponsored, endorsed, promoted, sold or supported by Solactive in any way and Solactive makes no express or implied representation, guarantee or assurance with regard to: (a) the advisability in investing in the financial instruments; (b) the quality, accuracy and/or completeness of the Index; and/or (c) the results obtained or to be obtained by any person or entity from the use of the Index. Solactive does not guarantee the accuracy and/or the completeness of the Index and shall not have any liability for any errors or omissions with respect thereto. KSPY is non-diversified. ETF shares are bought and sold on an exchange at market price (not NAV) and are not individually redeemed from the Fund. However, shares may be redeemed at NAV directly by certain authorized broker-dealers (Authorized Participants) in very large creation/redemption units. The returns shown do not represent the returns you would receive if you traded shares at other times.
18 kraneshares.com info@kraneshares.com +1 (212) 933 0393 Back to Top ↑Shares may trade at a premium or discount to their NAV in the secondary market. Brokerage commissions will reduce returns. Beginning 12/23/2020, market price returns are based on the official closing price of an ETF share or, if the official closing price isn’t available, the midpoint between the national best bid and national best offer (“NBBO”) as of the time the ETF calculates the current NAV per share. Prior to that date, market price returns were based on the midpoint between the Bid and Ask price. NAVs are calculated using prices as of 4:00 PM Eastern Time. The KraneShares ETFs and KFA Funds ETFs are distributed by SEI Investments Distribution Company (SIDCO), 1 Freedom Valley Drive, Oaks, PA 19456, which is not affiliated with Krane Funds Advisors, LLC, the Investment Adviser for the Funds, or any sub-advisers for the Funds.
ABOUT KRANESHARES Krane Funds Advisors, LLC is the investment manager for KraneShares ETFs. KraneShares offers innovative investment solutions tailored to three key pillars: China, Climate, and Uncorrelated Assets. Our team is determined to provide industry- leading, differentiated, and high-conviction investment strategies that offer access to key market trends. Our mission is to empower investors with the knowledge and tools necessary to capture the importance of these themes as an essential element of a well- designed investment portfolio. ABOUT CICC In 2017, China International Capital Corporation (CICC) formed a strategic partnership with Krane Funds Advisors, LLC, becoming the largest shareholder. CICC is a leading, publicly traded, Chinese financial services company with expertise in research, asset management, investment banking, private equity, and wealth management. Founded as the first Sino-US joint venture investment bank in 1995 with Morgan Stanley and China Construction Bank as the largest initial shareholders. Today CICC is majority owned by China Investment Corporation (CIC), the second largest sovereign wealth fund with roughly $1 trillion AUM. In 2020, The CICC Research Team ranked #1 in Institutional Investor’s All-China Research Category for the eighth year in a row. CICC has over 200 branches across Mainland China, with offices in Hong Kong, Singapore, New York, San Francisco, and London.info@kraneshares.com +1 (212) 933 0393