Managed Futures ETF Overview | KMLM : Managed Futures
by Kraneshares
Trend Following and Uncorrelated Assets – A Strategy for Uncertain Times
KraneShares Mount Lucas Managed Futures Index Strategy ETF (Ticker: KMLM)
KMLM | 3/31/2026
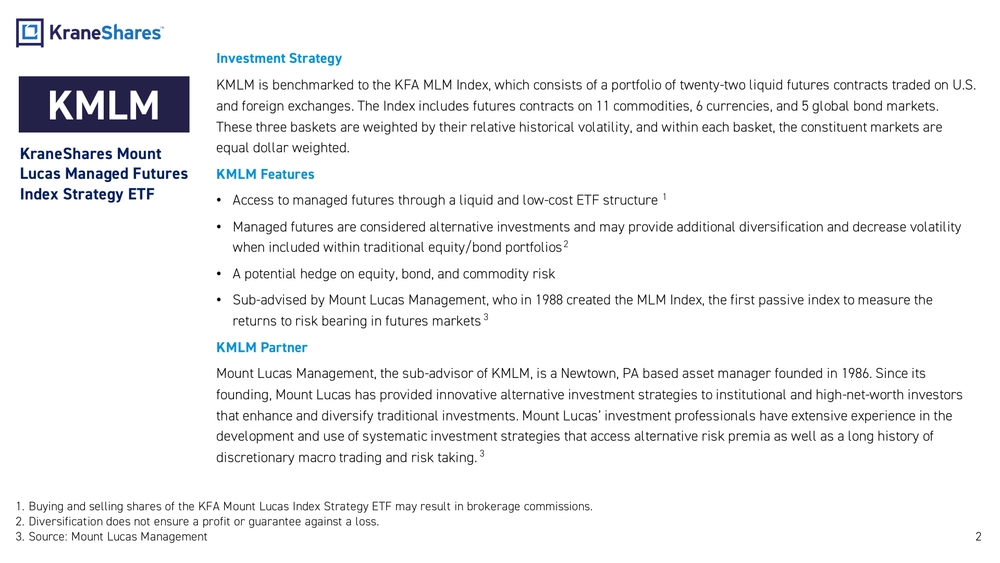
Investment Strategy
KMLM is benchmarked to the KFA MLM Index, which consists of a portfolio of twenty-two liquid futures contracts traded on U.S. and foreign exchanges. The Index includes futures contracts on 11 commodities, 6 currencies, and 5 global bond markets. These three baskets are weighted by their relative historical volatility, and within each basket, the constituent markets are equal dollar weighted.
KMLM Features
- Access to managed futures through a liquid and low-cost ETF structure
- Managed futures are considered alternative investments and may provide additional diversification and decrease volatility when included within traditional equity/bond portfolios
- A potential hedge on equity, bond, and commodity risk
- Sub-advised by Mount Lucas Management, who in 1988 created the MLM Index, the first passive index to measure the returns to risk bearing in futures markets
KMLM Partner
Mount Lucas Management, the sub-advisor of KMLM, is a Newtown, PA based asset manager founded in 1986. Since its founding, Mount Lucas has provided innovative alternative investment strategies to institutional and high-net-worth investors that enhance and diversify traditional investments. Mount Lucas' investment professionals have extensive experience in the development and use of systematic investment strategies that access alternative risk premia as well as a long history of discretionary macro trading and risk taking.
MT LUCAS
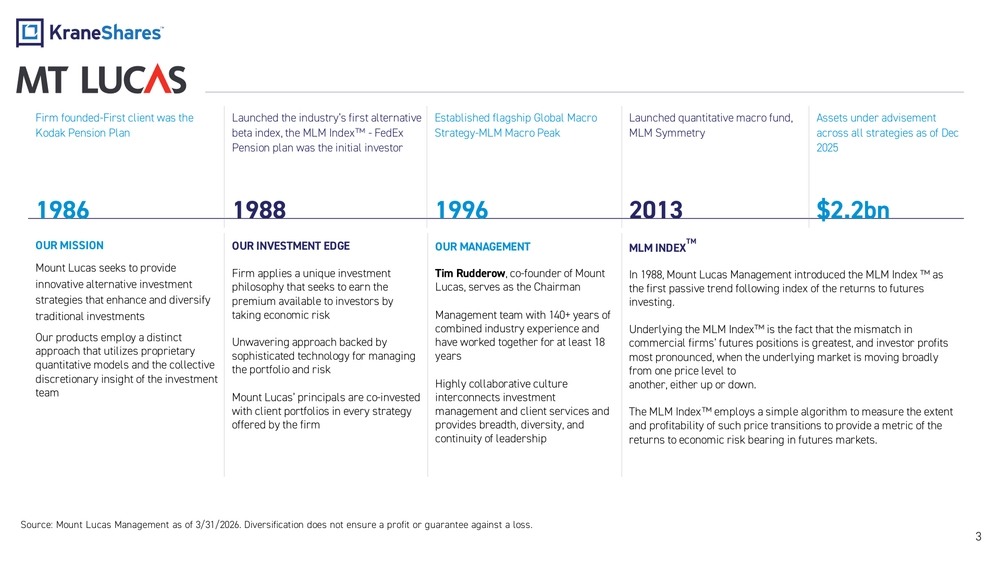
Company Timeline
| Year | Milestone |
|---|---|
| 1986 | Firm founded – First client was the Kodak Pension Plan |
| 1988 | Launched the industry's first alternative beta index, the MLM Index – FedEx Pension plan was the initial investor |
| 1996 | Established flagship Global Macro Strategy – MLM Macro Peak |
| 2013 | Launched quantitative macro fund, MLM Symmetry |
| $2.2bn | Assets under advisement across all strategies as of Dec 2025 |
OUR MISSION
Mount Lucas seeks to provide innovative alternative investment strategies that enhance and diversify traditional investments.
Our products employ a distinct approach that utilizes proprietary quantitative models and the collective discretionary insight of the investment team.
OUR INVESTMENT EDGE
Firm applies a unique investment philosophy that seeks to earn the premium available to investors by taking economic risk.
Unwavering approach backed by sophisticated technology for managing the portfolio and risk.
Mount Lucas' principals are co-invested with client portfolios in every strategy offered by the firm.
OUR MANAGEMENT
Tim Rudderow, co-founder of Mount Lucas, serves as the Chairman.
Management team with 140+ years of combined industry experience and have worked together for at least 18 years.
Highly collaborative culture interconnects investment management and client services and provides breadth, diversity, and continuity of leadership.
MLM INDEX™
In 1988, Mount Lucas Management introduced the MLM Index as the first passive trend following index of the returns to futures investing.
Underlying the MLM Index is the fact that the mismatch in commercial firms' futures positions is greatest, and investor profits most pronounced, when the underlying market is moving broadly from one price level to another, either up or down.
The MLM Index employs a simple algorithm to measure the extent and profitability of such price transitions to provide a metric of the returns to economic risk bearing in futures markets.
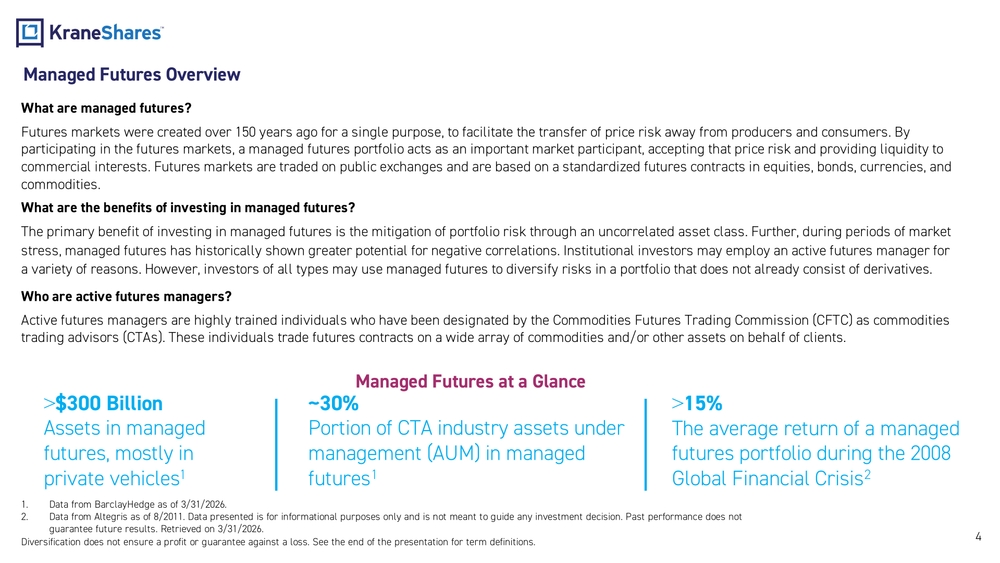
Managed Futures Overview
What are managed futures?
Futures markets were created over 150 years ago for a single purpose, to facilitate the transfer of price risk away from producers and consumers. By participating in the futures markets, a managed futures portfolio acts as an important market participant, accepting that price risk and providing liquidity to commercial interests. Futures markets are traded on public exchanges and are based on a standardized futures contracts in equities, bonds, currencies, and commodities.
What are the benefits of investing in managed futures?
The primary benefit of investing in managed futures is the mitigation of portfolio risk through an uncorrelated asset class. Further, during periods of market stress, managed futures has historically shown greater potential for negative correlations. Institutional investors may employ an active futures manager for a variety of reasons. However, investors of all types may use managed futures to diversify risks in a portfolio that does not already consist of derivatives.
Who are active futures managers?
Active futures managers are highly trained individuals who have been designated by the Commodities Futures Trading Commission (CFTC) as commodities trading advisors (CTAs). These individuals trade futures contracts on a wide array of commodities and/or other assets on behalf of clients.
Managed Futures at a Glance
- >$300 Billion – Assets in managed futures, mostly in private vehicles
- ~30% – Portion of CTA industry assets under management (AUM) in managed futures
- >15% – The average return of a managed futures portfolio during the 2008 Global Financial Crisis
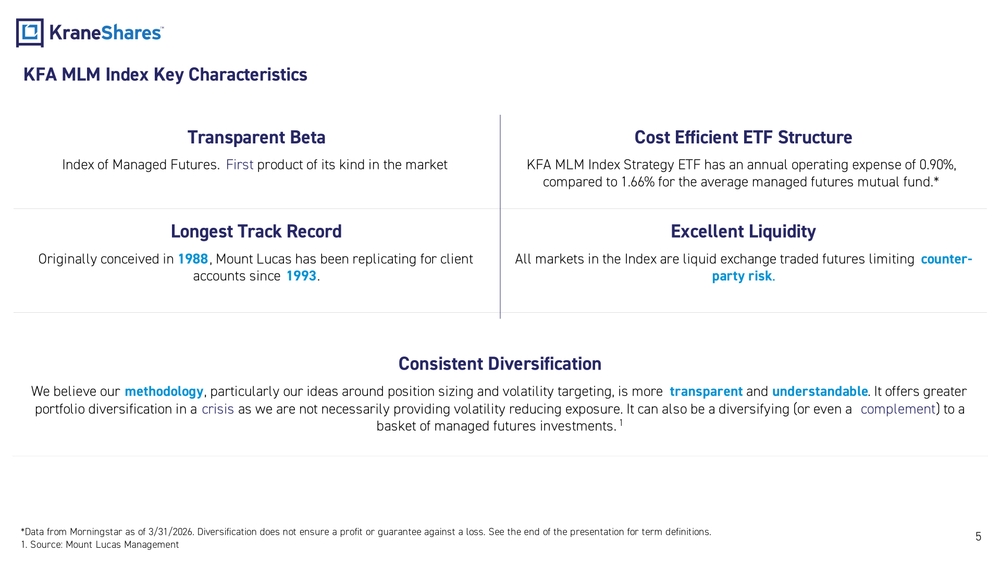
KFA MLM Index Key Characteristics
Transparent Beta
Index of Managed Futures. First product of its kind in the market.
Cost Efficient ETF Structure
KFA MLM Index Strategy ETF has an annual operating expense of 0.90%, compared to 1.66% for the average managed futures mutual fund.
Longest Track Record
Originally conceived in 1988, Mount Lucas has been replicating for client accounts since 1993.
Excellent Liquidity
All markets in the Index are liquid exchange traded futures limiting counterparty risk.
Consistent Diversification
We believe our methodology, particularly our ideas around position sizing and volatility targeting, is more transparent and understandable. It offers greater portfolio diversification in a crisis as we are not necessarily providing volatility reducing exposure. It can also be a diversifying (or even a complement) to a basket of managed futures investments.
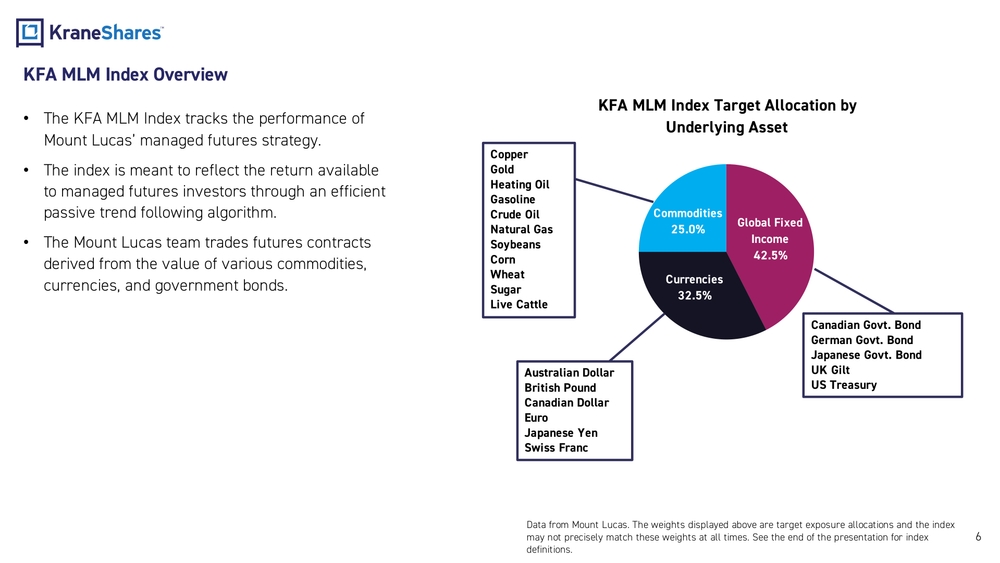
KFA MLM Index Overview
- The KFA MLM Index tracks the performance of Mount Lucas' managed futures strategy.
- The index is meant to reflect the return available to managed futures investors through an efficient passive trend following algorithm.
- The Mount Lucas team trades futures contracts derived from the value of various commodities, currencies, and government bonds.
KFA MLM Index Target Allocation by Underlying Asset
| Asset Class | Allocation |
|---|---|
| Global Fixed Income | 42.5% |
| Currencies | 32.5% |
| Commodities | 25.0% |
Commodities
Copper, Gold, Heating Oil, Gasoline, Crude Oil, Natural Gas, Soybeans, Corn, Wheat, Sugar, Live Cattle
Currencies
Australian Dollar, British Pound, Canadian Dollar, Euro, Japanese Yen, Swiss Franc
Global Fixed Income
Canadian Govt. Bond, German Govt. Bond, Japanese Govt. Bond, UK Gilt, US Treasury
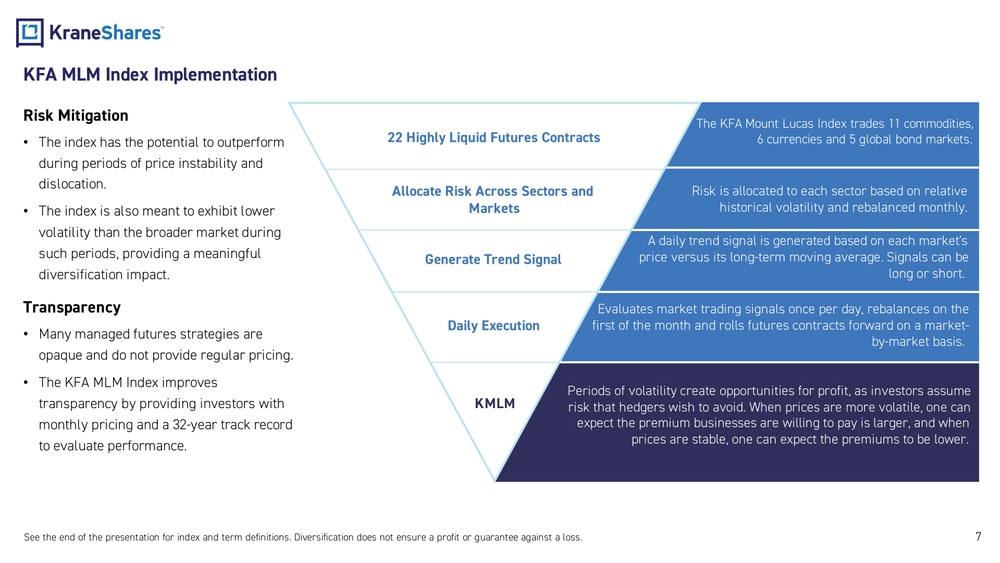
KFA MLM Index Implementation
Risk Mitigation
- The index has the potential to outperform during periods of price instability and dislocation.
- The index is also meant to exhibit lower volatility than the broader market during such periods, providing a meaningful diversification impact.
Transparency
- Many managed futures strategies are opaque and do not provide regular pricing.
- The KFA MLM Index improves transparency by providing investors with monthly pricing and a 32-year track record to evaluate performance.
Implementation Steps
| Step | Description |
|---|---|
| 22 Highly Liquid Futures Contracts | The KFA Mount Lucas Index trades 11 commodities, 6 currencies and 5 global bond markets. |
| Allocate Risk Across Sectors and Markets | Risk is allocated to each sector based on relative historical volatility and rebalanced monthly. |
| Generate Trend Signal | A daily trend signal is generated based on each market's price versus its long-term moving average. Signals can be long or short. |
| Daily Execution | Evaluates market trading signals once per day, rebalances on the first of the month and rolls futures contracts forward on a market-by-market basis. |
| KMLM | Periods of volatility create opportunities for profit, as investors assume risk that hedgers wish to avoid. When prices are more volatile, one can expect the premium businesses are willing to pay is larger, and when prices are stable, one can expect the premiums to be lower. |
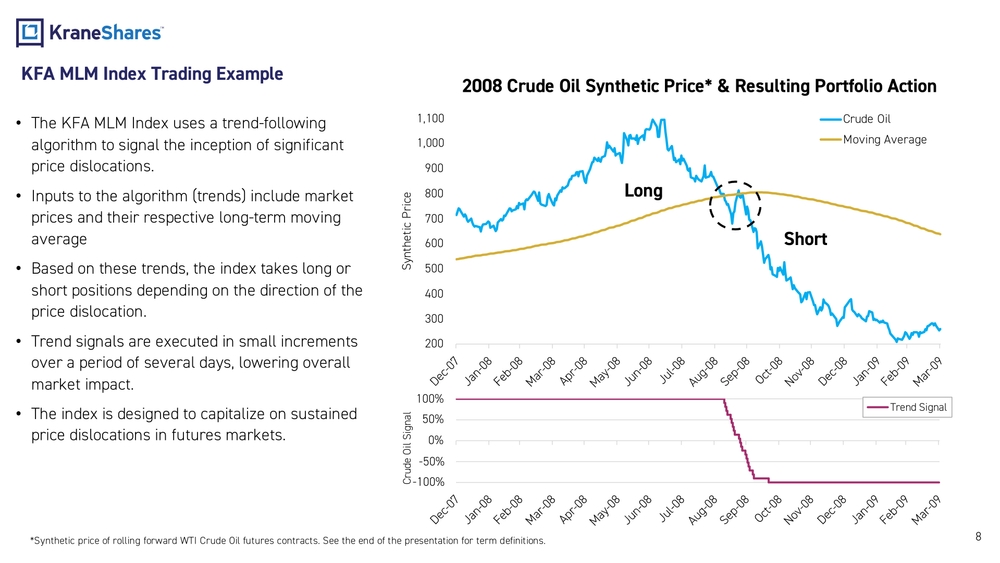
KFA MLM Index Trading Example
2008 Crude Oil Synthetic Price & Resulting Portfolio Action
- The KFA MLM Index uses a trend-following algorithm to signal the inception of significant price dislocations.
- Inputs to the algorithm (trends) include market prices and their respective long-term moving average.
- Based on these trends, the index takes long or short positions depending on the direction of the price dislocation.
- Trend signals are executed in small increments over a period of several days, lowering overall market impact.
- The index is designed to capitalize on sustained price dislocations in futures markets.
The chart illustrates the 2008 Crude Oil synthetic price with the moving average, showing a Long position during the price rise and a Short position after the price crossed below the moving average in September 2008, with the Crude Oil Signal (Trend Signal) shifting from 0% to -100%.
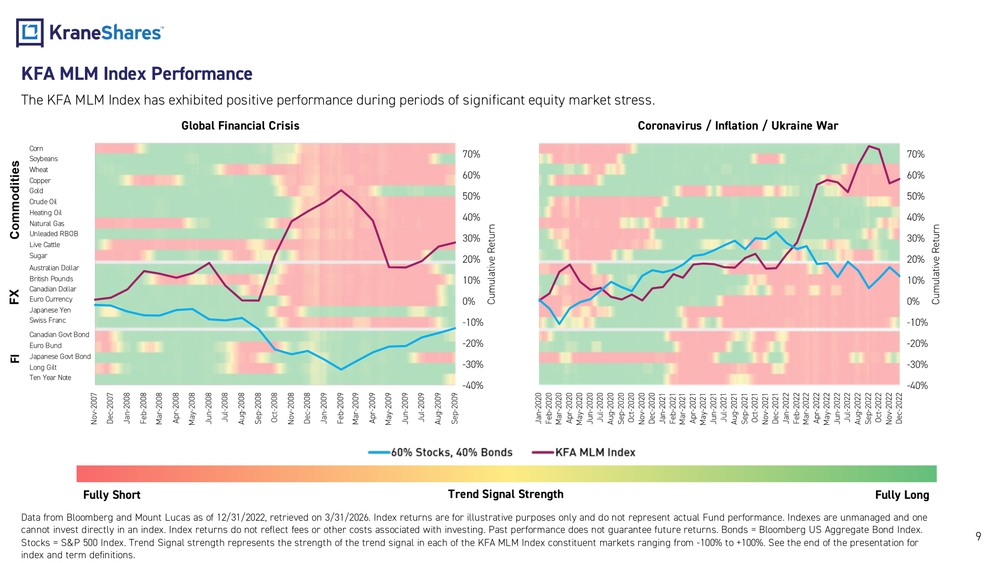
KFA MLM Index Performance
The KFA MLM Index has exhibited positive performance during periods of significant equity market stress.
Global Financial Crisis (Nov 2007 – Sep 2009)
The KFA MLM Index showed positive cumulative returns (peaking near 60%) while the 60% Stocks / 40% Bonds portfolio declined significantly (approaching -40%).
Coronavirus / Inflation / Ukraine War (Jan 2020 – Dec 2022)
The KFA MLM Index again outperformed the 60% Stocks / 40% Bonds portfolio, reaching approximately 60% cumulative return while the traditional portfolio remained near 0% or negative.
Trend Signal Strength Heatmap
The heatmap displays trend signal strength for each constituent market (Commodities, FX, FI) ranging from Fully Short to Fully Long across both crisis periods.
Constituent Markets Tracked:
Commodities: Corn, Soybeans, Wheat, Copper, Gold, Crude Oil, Heating Oil, Natural Gas, Unleaded RBOB, Live Cattle, Sugar
FX: Australian Dollar, British Pounds, Canadian Dollar, Euro Currency, Japanese Yen, Swiss Franc
FI: Canadian Govt Bond, Euro Bund, Japanese Govt Bond, Long Gilt, Ten Year Note
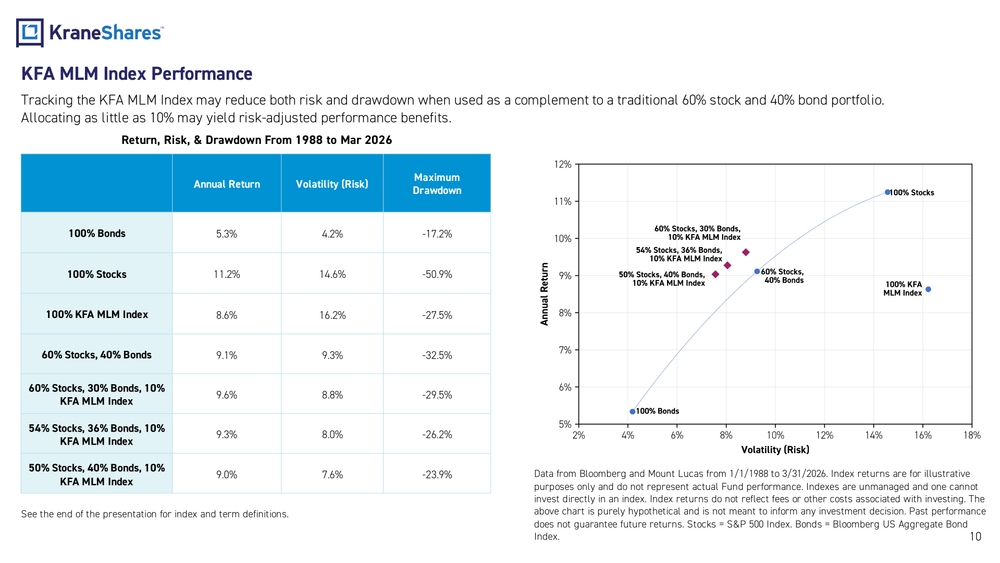
KFA MLM Index Performance
Tracking the KFA MLM Index may reduce both risk and drawdown when used as a complement to a traditional 60% stock and 40% bond portfolio. Allocating as little as 10% may yield risk-adjusted performance benefits.
Return, Risk, & Drawdown From 1988 to Mar 2026
| Portfolio | Annual Return | Volatility (Risk) | Maximum Drawdown |
|---|---|---|---|
| 100% Bonds | 5.3% | 4.2% | -17.2% |
| 100% Stocks | 11.2% | 14.6% | -50.9% |
| 100% KFA MLM Index | 8.6% | 16.2% | -27.5% |
| 60% Stocks, 40% Bonds | 9.1% | 9.3% | -32.5% |
| 60% Stocks, 30% Bonds, 10% KFA MLM Index | 9.6% | 8.8% | -29.5% |
| 54% Stocks, 36% Bonds, 10% KFA MLM Index | 9.3% | 8.0% | -26.2% |
| 50% Stocks, 40% Bonds, 10% KFA MLM Index | 9.0% | 7.6% | -23.9% |
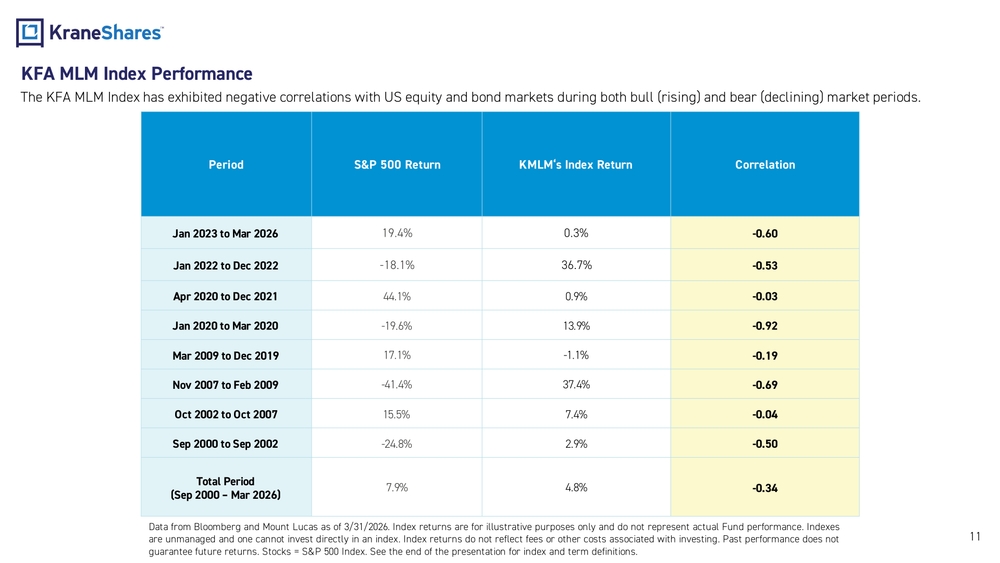
KFA MLM Index Performance
The KFA MLM Index has exhibited negative correlations with US equity and bond markets during both bull (rising) and bear (declining) market periods.
| Period | S&P 500 Return | KMLM's Index Return | Correlation |
|---|---|---|---|
| Jan 2023 to Mar 2026 | 19.4% | 0.3% | -0.60 |
| Jan 2022 to Dec 2022 | -18.1% | 36.7% | -0.53 |
| Apr 2020 to Dec 2021 | 44.1% | 0.9% | -0.03 |
| Jan 2020 to Mar 2020 | -19.6% | 13.9% | -0.92 |
| Mar 2009 to Dec 2019 | 17.1% | -1.1% | -0.19 |
| Nov 2007 to Feb 2009 | -41.4% | 37.4% | -0.69 |
| Oct 2002 to Oct 2007 | 15.5% | 7.4% | -0.04 |
| Sep 2000 to Sep 2002 | -24.8% | 2.9% | -0.50 |
| Total Period (Sep 2000 – Mar 2026) | 7.9% | 4.8% | -0.34 |
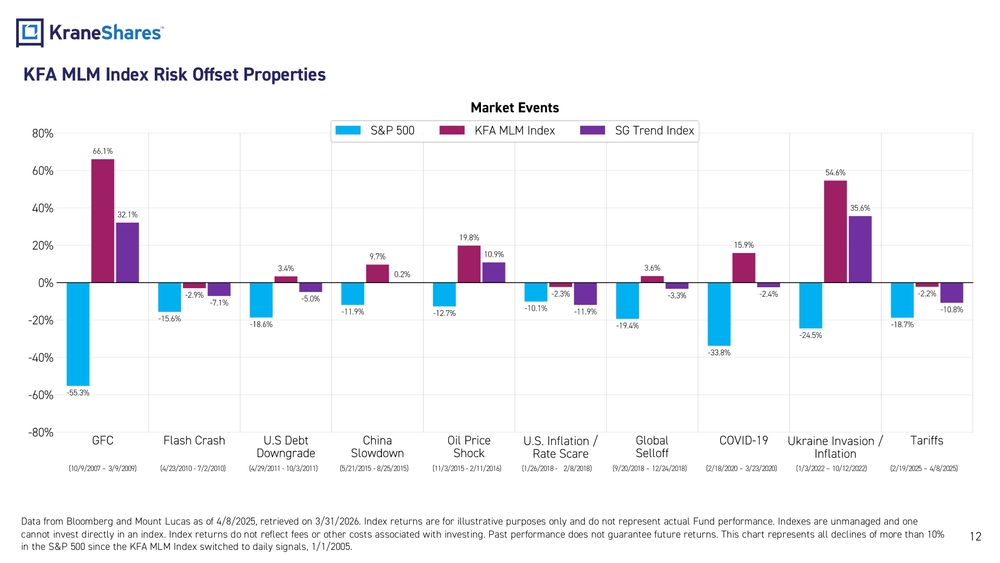
KFA MLM Index Risk Offset Properties
Market Events
Bar chart comparing S&P 500, KFA MLM Index, and SG Trend Index performance during major market downturns:
| Event | Period | S&P 500 | KFA MLM Index | SG Trend Index |
|---|---|---|---|---|
| GFC | 10/9/2007 – 3/9/2009 | -55.3% | 66.1% | 32.1% |
| Flash Crash | 4/23/2010 - 7/2/2010 | -15.6% | -2.9% | -7.1% |
| U.S Debt Downgrade | 4/29/2011 - 10/3/2011 | -18.6% | 3.4% | -5.0% |
| China Slowdown | 5/21/2015 - 8/25/2015 | -11.9% | 9.7% | 0.2% |
| Oil Price Shock | 11/3/2015 - 2/11/2016 | -12.7% | 19.8% | 10.9% |
| U.S. Inflation / Rate Scare | 1/26/2018 - 2/8/2018 | -10.1% | -2.3% | -11.9% |
| Global Selloff | 9/20/2018 – 12/24/2018 | -19.4% | -3.3% | -11.9% |
| COVID-19 | 2/18/2020 – 3/23/2020 | -33.8% | 15.9% | -2.4% |
| Ukraine Invasion / Inflation | 1/3/2022 – 10/12/2022 | -24.5% | 54.6% | 35.6% |
| Tariffs | 2/19/2025 – 4/8/2025 | -18.7% | -2.2% | -10.8% |
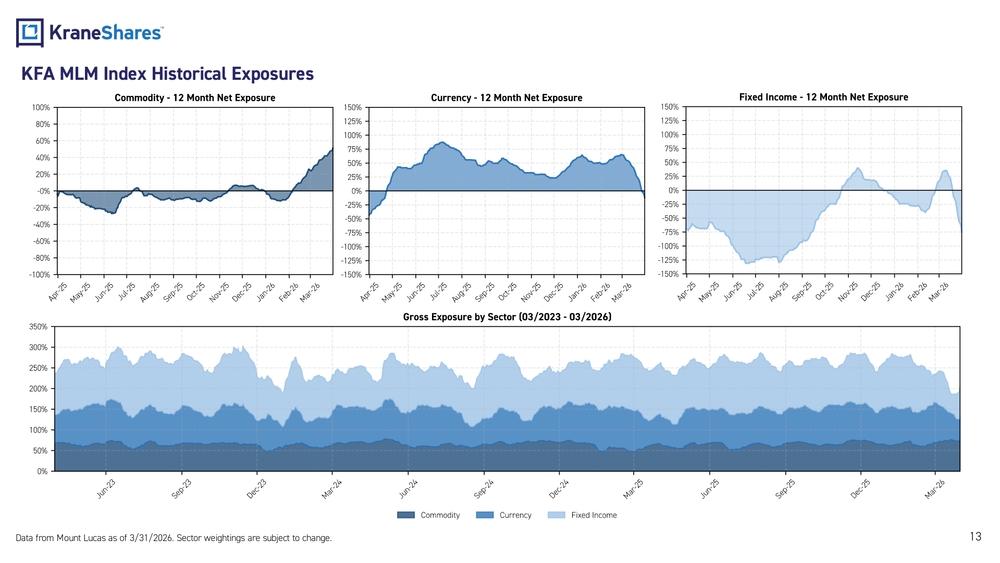
KFA MLM Index Historical Exposures
Commodity - 12 Month Net Exposure
Chart showing commodity net exposure from Apr-25 to Mar-26, ranging between approximately -40% and +20%.
Currency - 12 Month Net Exposure
Chart showing currency net exposure from Apr-25 to Mar-26, ranging between approximately -25% and +75%.
Fixed Income - 12 Month Net Exposure
Chart showing fixed income net exposure from Apr-25 to Mar-26, ranging between approximately -125% and +25%.
Gross Exposure by Sector (03/2023 - 03/2026)
Stacked area chart showing gross exposure by sector (Commodity, Currency, Fixed Income) from June 2023 to March 2026, with total gross exposure ranging between approximately 150% and 300%.
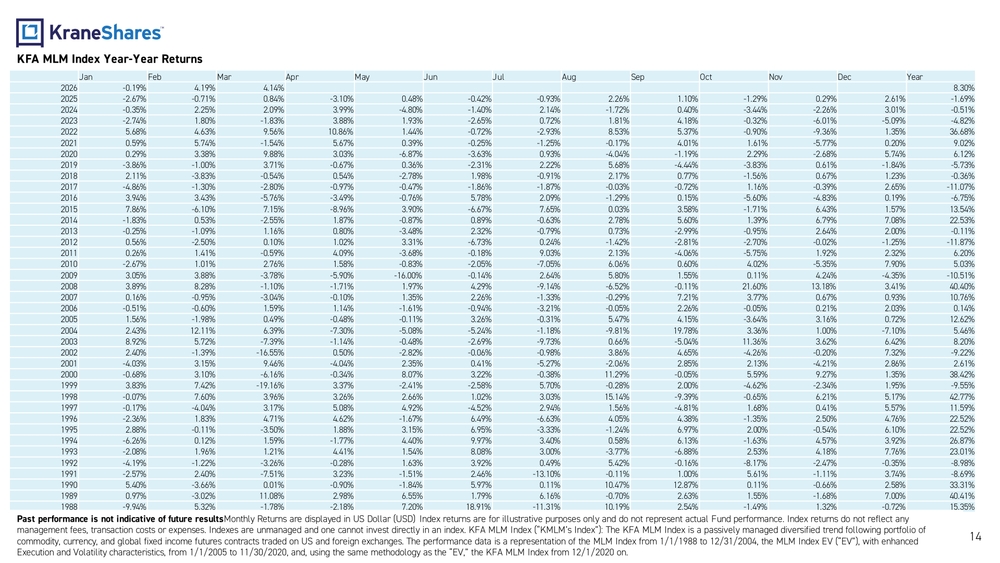
KFA MLM Index Year-Year Returns
Monthly and annual returns table (USD) from 1988 to 2026:
| Year | Jan | Feb | Mar | Apr | May | Jun | Jul | Aug | Sep | Oct | Nov | Dec | Year |
|---|---|---|---|---|---|---|---|---|---|---|---|---|---|
| 2026 | -0.19% | 4.19% | 4.14% | 8.30% | |||||||||
| 2025 | -2.67% | -0.71% | 0.84% | -3.10% | 0.48% | -0.42% | -0.93% | 2.26% | 1.10% | -1.29% | 0.29% | 2.61% | -1.69% |
| 2024 | -0.35% | 2.25% | 2.09% | 3.99% | -4.80% | -1.40% | 2.14% | -1.72% | 0.40% | -3.44% | -2.26% | 3.01% | -0.51% |
| 2023 | -2.74% | 1.80% | -1.83% | 3.88% | 1.93% | -2.65% | 0.72% | 1.81% | 4.18% | -0.32% | -6.01% | -5.09% | -4.82% |
| 2022 | 5.68% | 4.63% | 9.56% | 10.86% | 1.44% | -0.72% | -2.93% | 8.53% | 5.37% | -0.90% | -9.36% | 1.35% | 36.68% |
| 2021 | 0.59% | 5.74% | -1.54% | 5.67% | 0.39% | -0.25% | -1.25% | -0.17% | 4.01% | 1.61% | -5.77% | 0.20% | 9.02% |
| 2020 | 0.29% | 3.38% | 9.88% | 3.03% | -6.87% | -3.63% | 0.93% | -4.04% | -1.19% | 2.29% | -2.68% | 5.74% | 6.12% |
| 2019 | -3.86% | -1.00% | 3.71% | -0.67% | 0.36% | -2.31% | 2.22% | 5.68% | -4.44% | -3.83% | 0.61% | -1.84% | -5.73% |
| 2018 | 2.11% | -3.83% | -0.54% | 0.54% | -2.78% | 1.98% | -0.91% | 2.17% | 0.77% | -1.56% | 0.67% | 1.23% | -0.36% |
| 2017 | -4.86% | -1.30% | -2.80% | -0.97% | -0.47% | -1.86% | -1.87% | -0.03% | -0.72% | 1.16% | -0.39% | 2.65% | -11.07% |
| 2016 | 3.94% | 3.43% | -5.76% | -3.49% | -0.76% | 5.78% | 2.09% | -1.29% | 0.15% | -5.60% | -4.83% | 0.19% | -6.75% |
| 2015 | 7.86% | -6.10% | 7.15% | -8.96% | 3.90% | -6.67% | 7.65% | 0.03% | 3.58% | -1.71% | 6.43% | 1.57% | 13.54% |
| 2014 | -1.83% | 0.53% | -2.55% | 1.87% | -0.87% | 0.89% | -0.63% | 2.78% | 5.60% | 1.39% | 6.79% | 7.08% | 22.53% |
| 2013 | -0.25% | -1.09% | 1.16% | 0.80% | -3.48% | 2.32% | -0.79% | 0.73% | -2.99% | -0.95% | 2.64% | 2.00% | -0.11% |
| 2012 | 0.56% | -2.50% | 0.10% | 1.02% | 3.31% | -6.73% | 0.24% | -1.42% | -2.81% | -2.70% | -0.02% | -1.25% | -11.87% |
| 2011 | 0.26% | 1.41% | -0.59% | 4.09% | -3.68% | -0.18% | 9.03% | 2.13% | -4.06% | -5.75% | 1.92% | 2.32% | 6.20% |
| 2010 | -2.67% | 1.01% | 2.76% | 1.58% | -0.83% | -2.05% | -7.05% | 6.06% | 0.60% | 4.02% | -5.35% | 7.90% | 5.03% |
| 2009 | 3.05% | 3.88% | -3.78% | -5.90% | -16.00% | -0.14% | 2.64% | 5.80% | 1.55% | 0.11% | 4.24% | -4.35% | -10.51% |
| 2008 | 3.89% | 8.28% | -1.10% | -1.71% | 1.97% | 4.29% | -9.14% | -6.52% | -0.11% | 21.60% | 13.18% | 3.41% | 40.40% |
| 2007 | 0.16% | -0.95% | -3.04% | -0.10% | 1.35% | 2.26% | -1.33% | -0.29% | 7.21% | 3.77% | 0.67% | 0.93% | 10.76% |
| 2006 | -0.51% | -0.60% | 1.59% | 1.14% | -1.61% | -0.94% | -3.21% | -0.05% | 2.26% | -0.05% | 0.21% | 2.03% | 0.14% |
| 2005 | 1.56% | -1.98% | 0.49% | -0.48% | -0.11% | 3.26% | -0.31% | 5.47% | 4.15% | -3.64% | 3.16% | 0.72% | 12.62% |
| 2004 | 2.43% | 12.11% | 6.39% | -7.30% | -5.08% | -5.24% | -1.18% | -9.81% | 19.78% | 3.36% | 1.00% | -7.10% | 5.46% |
| 2003 | 8.92% | 5.72% | -7.39% | -1.14% | -0.48% | -2.69% | -9.73% | 0.66% | -5.04% | 11.36% | 3.62% | 6.42% | 8.20% |
| 2002 | 2.40% | -1.39% | -16.55% | 0.50% | -2.82% | -0.06% | -0.98% | 3.86% | 4.65% | -4.26% | -0.20% | 7.32% | -9.22% |
| 2001 | -4.03% | 3.15% | 9.46% | -4.04% | 2.35% | 0.41% | -5.27% | -2.06% | 2.85% | 2.13% | -4.21% | 2.86% | 2.61% |
| 2000 | -0.68% | 3.10% | -6.16% | -0.34% | 8.07% | 3.22% | -0.38% | 11.29% | -0.05% | 5.59% | 9.27% | 1.35% | 38.42% |
| 1999 | 3.83% | 7.42% | -19.16% | 3.37% | -2.41% | -2.58% | 5.70% | -0.28% | 2.00% | -4.62% | -2.34% | 1.95% | -9.55% |
| 1998 | -0.07% | 7.60% | 3.96% | 3.26% | 2.66% | 1.02% | 3.03% | 15.14% | -9.39% | -0.65% | 6.21% | 5.17% | 42.77% |
| 1997 | -0.17% | -4.04% | 3.17% | 5.08% | 4.92% | -4.52% | 2.94% | 1.56% | -4.81% | 1.68% | 0.41% | 5.57% | 11.59% |
| 1996 | -2.36% | 1.83% | 4.71% | 4.62% | -1.67% | 6.49% | -6.63% | 4.05% | 4.38% | -1.35% | 2.50% | 4.76% | 22.52% |
| 1995 | 2.88% | -0.11% | -3.50% | 1.88% | 3.15% | 6.95% | -3.33% | -1.24% | 6.97% | 2.00% | -0.54% | 6.10% | 22.52% |
| 1994 | -6.26% | 0.12% | 1.59% | -1.77% | 4.40% | 9.97% | 3.40% | 0.58% | 6.13% | -1.63% | 4.57% | 3.92% | 26.87% |
| 1993 | -2.08% | 1.96% | 1.21% | 4.41% | 1.54% | 8.08% | 3.00% | -3.77% | -6.88% | 2.53% | 4.18% | 7.76% | 23.01% |
| 1992 | -4.19% | -1.22% | -3.26% | -0.28% | 1.63% | 3.92% | 0.49% | 5.42% | -0.16% | -8.17% | -2.47% | -0.35% | -8.98% |
| 1991 | -2.57% | 2.40% | -7.51% | 3.23% | -1.51% | 2.46% | -13.10% | -0.11% | 1.00% | 5.61% | -1.11% | 3.74% | -8.69% |
| 1990 | 5.40% | -3.66% | 0.01% | -0.90% | -1.84% | 5.97% | 0.11% | 10.47% | 12.87% | 0.11% | -0.66% | 2.58% | 33.31% |
| 1989 | 0.97% | -3.02% | 11.08% | 2.98% | 6.55% | 1.79% | 6.16% | -0.70% | 2.63% | 1.55% | -1.68% | 7.00% | 40.41% |
| 1988 | -9.94% | 5.32% | -1.78% | -2.18% | 7.20% | 18.91% | -11.31% | 10.19% | 2.54% | -1.49% | 1.32% | -0.72% | 15.35% |
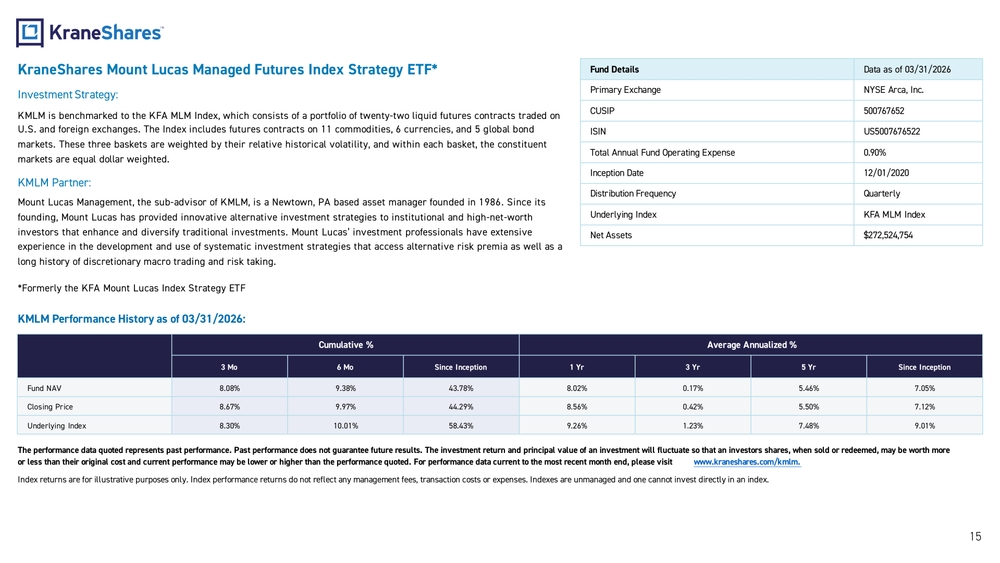
KraneShares Mount Lucas Managed Futures Index Strategy ETF*
Investment Strategy:
KMLM is benchmarked to the KFA MLM Index, which consists of a portfolio of twenty-two liquid futures contracts traded on U.S. and foreign exchanges. The Index includes futures contracts on 11 commodities, 6 currencies, and 5 global bond markets. These three baskets are weighted by their relative historical volatility, and within each basket, the constituent markets are equal dollar weighted.
KMLM Partner:
Mount Lucas Management, the sub-advisor of KMLM, is a Newtown, PA based asset manager founded in 1986. Since its founding, Mount Lucas has provided innovative alternative investment strategies to institutional and high-net-worth investors that enhance and diversify traditional investments. Mount Lucas' investment professionals have extensive experience in the development and use of systematic investment strategies that access alternative risk premia as well as a long history of discretionary macro trading and risk taking.
*Formerly the KFA Mount Lucas Index Strategy ETF
Fund Details (Data as of 03/31/2026)
| Detail | Value |
|---|---|
| Primary Exchange | NYSE Arca, Inc. |
| CUSIP | 500767652 |
| ISIN | US5007676522 |
| Total Annual Fund Operating Expense | 0.90% |
| Inception Date | 12/01/2020 |
| Distribution Frequency | Quarterly |
| Underlying Index | KFA MLM Index |
| Net Assets | $272,524,754 |
KMLM Performance History as of 03/31/2026:
| Cumulative % | Average Annualized % | ||||||
|---|---|---|---|---|---|---|---|
| 3 Mo | 6 Mo | Since Inception | 1 Yr | 3 Yr | 5 Yr | Since Inception | |
| Fund NAV | 8.08% | 9.38% | 43.78% | 8.02% | 0.17% | 5.46% | 7.05% |
| Closing Price | 8.67% | 9.97% | 44.29% | 8.56% | 0.42% | 5.50% | 7.12% |
| Underlying Index | 8.30% | 10.01% | 58.43% | 9.26% | 1.23% | 7.48% | 9.01% |
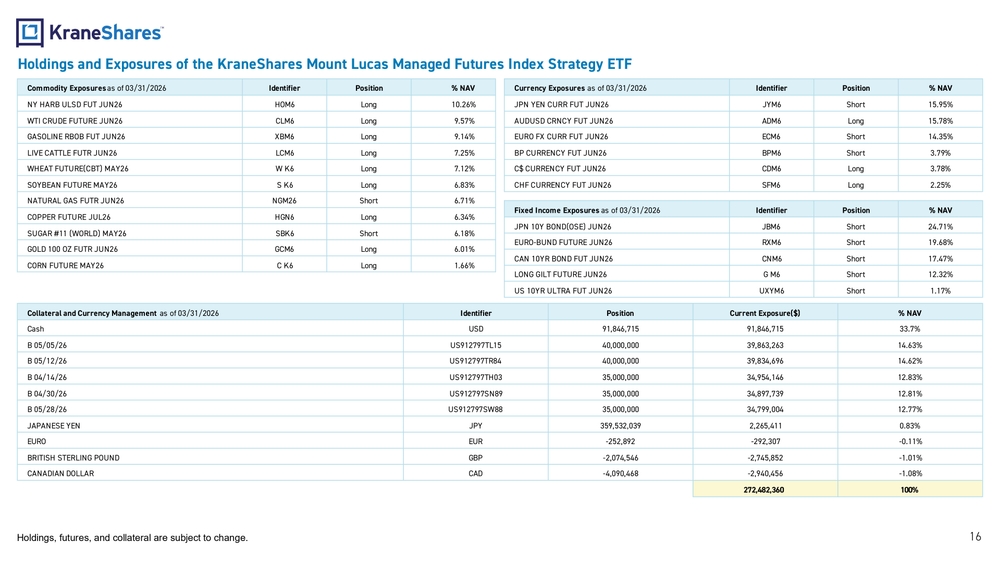
Holdings and Exposures of the KraneShares Mount Lucas Managed Futures Index Strategy ETF
Commodity Exposures as of 03/31/2026
| Contract | Identifier | Position | % NAV |
|---|---|---|---|
| NY HARB ULSD FUT JUN26 | HOM6 | Long | 10.26% |
| WTI CRUDE FUTURE JUN26 | CLM6 | Long | 9.57% |
| GASOLINE RBOB FUT JUN26 | XBM6 | Long | 9.14% |
| LIVE CATTLE FUTR JUN26 | LCM6 | Long | 7.25% |
| WHEAT FUTURE(CBT) MAY26 | W K6 | Long | 7.12% |
| SOYBEAN FUTURE MAY26 | S K6 | Long | 6.83% |
| NATURAL GAS FUTR JUN26 | NGM26 | Short | 6.71% |
| COPPER FUTURE JUL26 | HGN6 | Long | 6.34% |
| SUGAR #11 (WORLD) MAY26 | SBK6 | Short | 6.18% |
| GOLD 100 OZ FUTR JUN26 | GCM6 | Long | 6.01% |
| CORN FUTURE MAY26 | C K6 | Long | 1.66% |
Currency Exposures as of 03/31/2026
| Contract | Identifier | Position | % NAV |
|---|---|---|---|
| JPN YEN CURR FUT JUN26 | JYM6 | Short | 15.95% |
| AUDUSD CRNCY FUT JUN26 | ADM6 | Long | 15.78% |
| EURO FX CURR FUT JUN26 | ECM6 | Short | 14.35% |
| BP CURRENCY FUT JUN26 | BPM6 | Short | 3.79% |
| C$ CURRENCY FUT JUN26 | CDM6 | Long | 3.78% |
| CHF CURRENCY FUT JUN26 | SFM6 | Long | 2.25% |
Fixed Income Exposures as of 03/31/2026
| Contract | Identifier | Position | % NAV |
|---|---|---|---|
| JPN 10Y BOND(OSE) JUN26 | JBM6 | Short | 24.71% |
| EURO-BUND FUTURE JUN26 | RXM6 | Short | 19.68% |
| CAN 10YR BOND FUT JUN26 | CNM6 | Short | 17.47% |
| LONG GILT FUTURE JUN26 | G M6 | Short | 12.32% |
| US 10YR ULTRA FUT JUN26 | UXYM6 | Short | 1.17% |
Collateral and Currency Management as of 03/31/2026
| Holding | Identifier | Position | Current Exposure($) | % NAV |
|---|---|---|---|---|
| Cash | USD | 91,846,715 | 91,846,715 | 33.7% |
| B 05/05/26 | US912797TL15 | 40,000,000 | 39,863,263 | 14.63% |
| B 05/12/26 | US912797TR84 | 40,000,000 | 39,834,696 | 14.62% |
| B 04/14/26 | US912797TH03 | 35,000,000 | 34,954,146 | 12.83% |
| B 04/30/26 | US912797SN89 | 35,000,000 | 34,897,739 | 12.81% |
| B 05/28/26 | US912797SW88 | 35,000,000 | 34,799,004 | 12.77% |
| JAPANESE YEN | JPY | 359,532,039 | 2,265,411 | 0.83% |
| EURO | EUR | -252,892 | -292,307 | -0.11% |
| BRITISH STERLING POUND | GBP | -2,074,546 | -2,745,852 | -1.01% |
| CANADIAN DOLLAR | CAD | -4,090,468 | -2,940,456 | -1.08% |
| Total | 272,482,360 | 100% |
Introduction to KraneShares
About KraneShares
Krane Funds Advisors, LLC is a specialist investment manager focused on China, Climate, and Alternative assets. KraneShares seeks to provide innovative, high conviction, and first to market strategies. The firm was founded in 2013 and manages for institutions and individuals globally. In 2017, KraneShares formed a strategic partnership with China International Capital Corporation (CICC) when they acquired a majority ownership stake. The firm is a signatory of the United Nations-supported Principles for Responsible Investment (UN PRI).
Sign up to our daily (or weekly) note on China's capital markets: www.chinalastnight.com
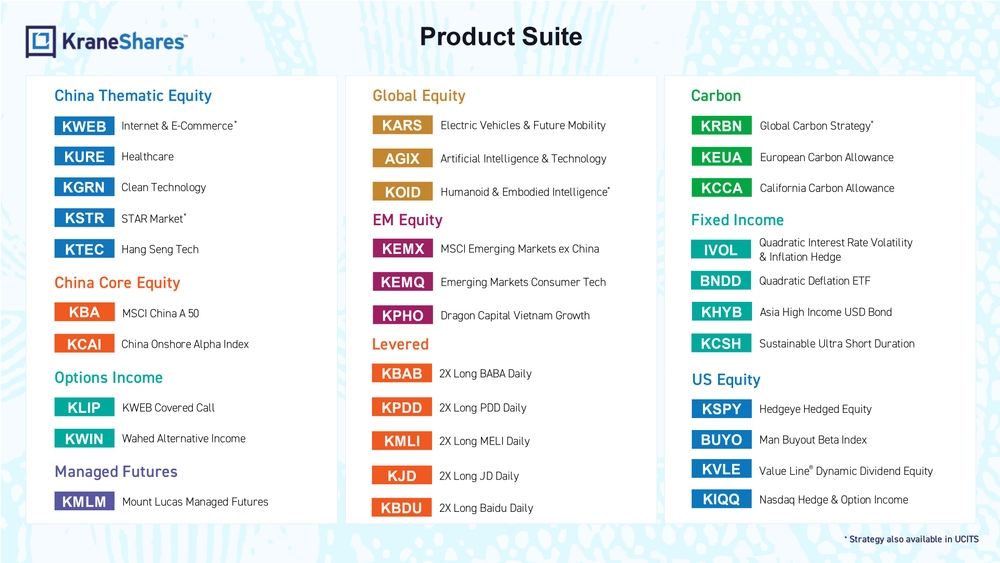
Product Suite
China Thematic Equity
- KWEB - Internet & E-Commerce*
- KURE - Healthcare
- KGRN - Clean Technology
- KSTR - STAR Market*
- KTEC - Hang Seng Tech
China Core Equity
- KBA - MSCI China A 50
- KCAI - China Onshore Alpha Index
Options Income
- KLIP - KWEB Covered Call
- KWIN - Wahed Alternative Income
Managed Futures
- KMLM - Mount Lucas Managed Futures
Global Equity
- KARS - Electric Vehicles & Future Mobility
- AGIX - Artificial Intelligence & Technology
- KOID - Humanoid & Embodied Intelligence*
EM Equity
- KEMX - MSCI Emerging Markets ex China
- KEMQ - Emerging Markets Consumer Tech
- KPHO - Dragon Capital Vietnam Growth
Levered
- KBAB - 2X Long BABA Daily
- KPDD - 2X Long PDD Daily
- KMLI - 2X Long MELI Daily
- KJD - 2X Long JD Daily
- KBDU - 2X Long Baidu Daily
Carbon
- KRBN - Global Carbon Strategy*
- KEUA - European Carbon Allowance
- KCCA - California Carbon Allowance
Fixed Income
- IVOL - Quadratic Interest Rate Volatility & Inflation Hedge
- BNDD - Quadratic Deflation ETF
- KHYB - Asia High Income USD Bond
- KCSH - Sustainable Ultra Short Duration
US Equity
- KSPY - Hedgeye Hedged Equity
- BUYO - Man Buyout Beta Index
- KVLE - Value Line® Dynamic Dividend Equity
- KIQQ - Nasdaq Hedge & Option Income
*Strategy also available in UCITS
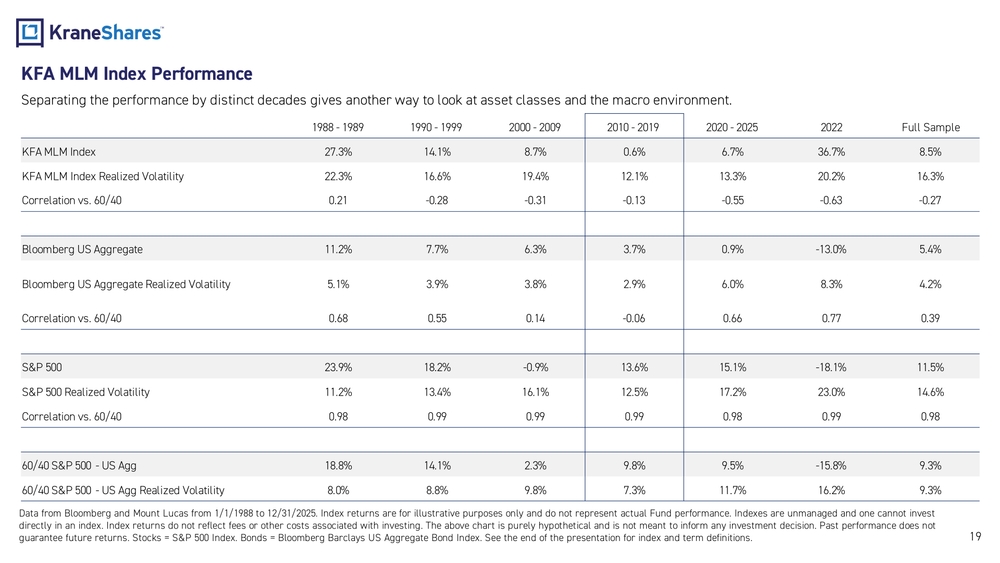
KFA MLM Index Performance
Separating the performance by distinct decades gives another way to look at asset classes and the macro environment.
| 1988-1989 | 1990-1999 | 2000-2009 | 2010-2019 | 2020-2025 | 2022 | Full Sample | |
|---|---|---|---|---|---|---|---|
| KFA MLM Index | 27.3% | 14.1% | 8.7% | 0.6% | 6.7% | 36.7% | 8.5% |
| KFA MLM Index Realized Volatility | 22.3% | 16.6% | 19.4% | 12.1% | 13.3% | 20.2% | 16.3% |
| Correlation vs. 60/40 | 0.21 | -0.28 | -0.31 | -0.13 | -0.55 | -0.63 | -0.27 |
| Bloomberg US Aggregate | 11.2% | 7.7% | 6.3% | 3.7% | 0.9% | -13.0% | 5.4% |
| Bloomberg US Aggregate Realized Volatility | 5.1% | 3.9% | 3.8% | 2.9% | 6.0% | 8.3% | 4.2% |
| Correlation vs. 60/40 | 0.68 | 0.55 | 0.14 | -0.06 | 0.66 | 0.77 | 0.39 |
| S&P 500 | 23.9% | 18.2% | -0.9% | 13.6% | 15.1% | -18.1% | 11.5% |
| S&P 500 Realized Volatility | 11.2% | 13.4% | 16.1% | 12.5% | 17.2% | 23.0% | 14.6% |
| Correlation vs. 60/40 | 0.98 | 0.99 | 0.99 | 0.99 | 0.98 | 0.99 | 0.98 |
| 60/40 S&P 500 - US Agg | 18.8% | 14.1% | 2.3% | 9.8% | 9.5% | -15.8% | 9.3% |
| 60/40 S&P 500 - US Agg Realized Volatility | 8.0% | 8.8% | 9.8% | 7.3% | 11.7% | 16.2% | 9.3% |
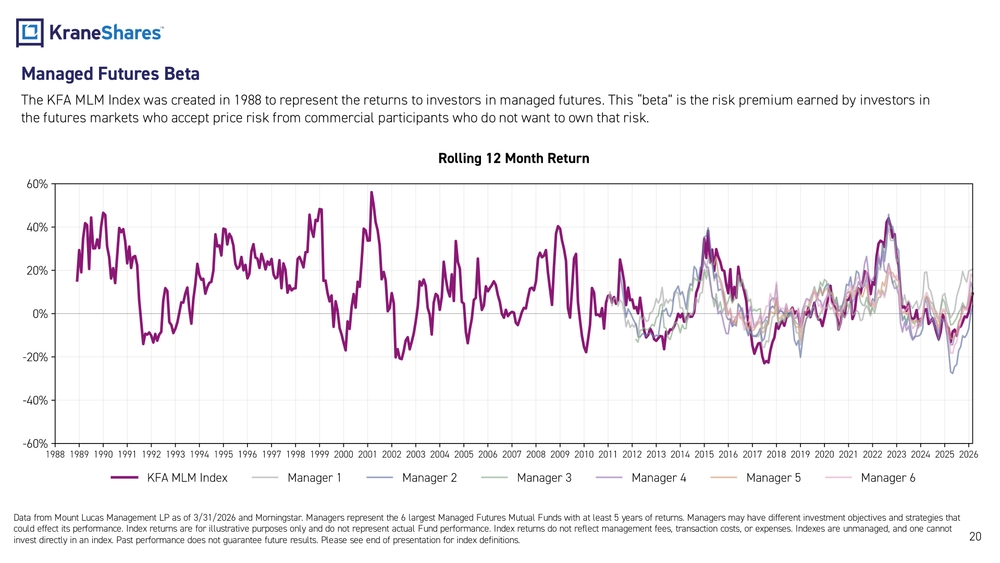
Managed Futures Beta
The KFA MLM Index was created in 1988 to represent the returns to investors in managed futures. This "beta" is the risk premium earned by investors in the futures markets who accept price risk from commercial participants who do not want to own that risk.
Rolling 12 Month Return
Line chart comparing the KFA MLM Index rolling 12-month returns against 6 managed futures mutual fund managers (Manager 1 through Manager 6) from 1988 to 2026. The KFA MLM Index (shown in dark purple) demonstrates a long track record dating back to 1988, while the 6 managers only appear from approximately 2010 onwards, representing the 6 largest Managed Futures Mutual Funds with at least 5 years of returns.
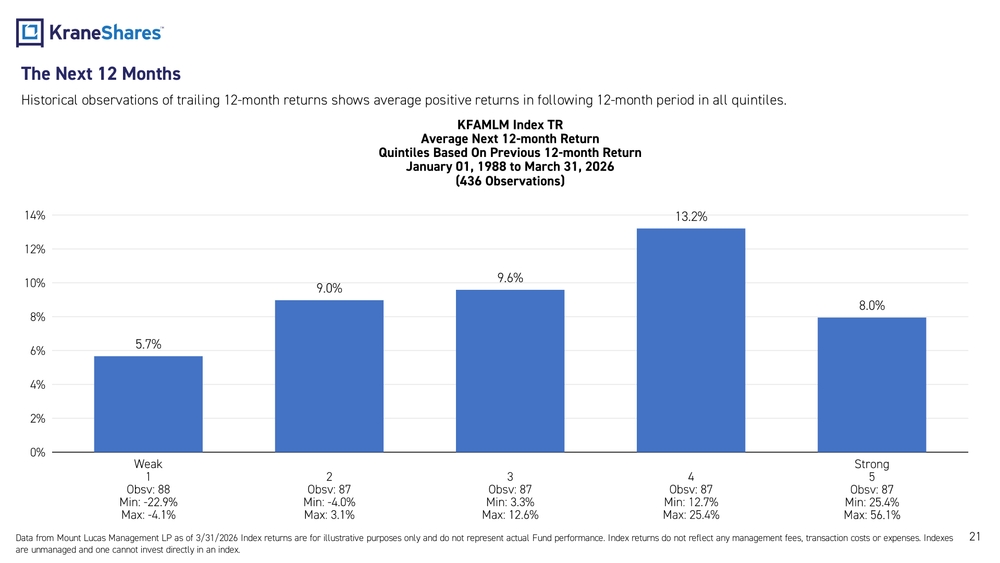
The Next 12 Months
Historical observations of trailing 12-month returns shows average positive returns in following 12-month period in all quintiles.
KFAMLM Index TR
Average Next 12-month Return
Quintiles Based On Previous 12-month Return
January 01, 1988 to March 31, 2026
(436 Observations)
| Quintile | Avg Next 12-Month Return | Observations | Min | Max |
|---|---|---|---|---|
| Weak 1 | 5.7% | 88 | -22.9% | -4.1% |
| 2 | 9.0% | 87 | -4.0% | 3.1% |
| 3 | 9.6% | 87 | 3.3% | 12.6% |
| 4 | 13.2% | 87 | 12.7% | 25.4% |
| Strong 5 | 8.0% | 87 | 25.4% | 56.1% |
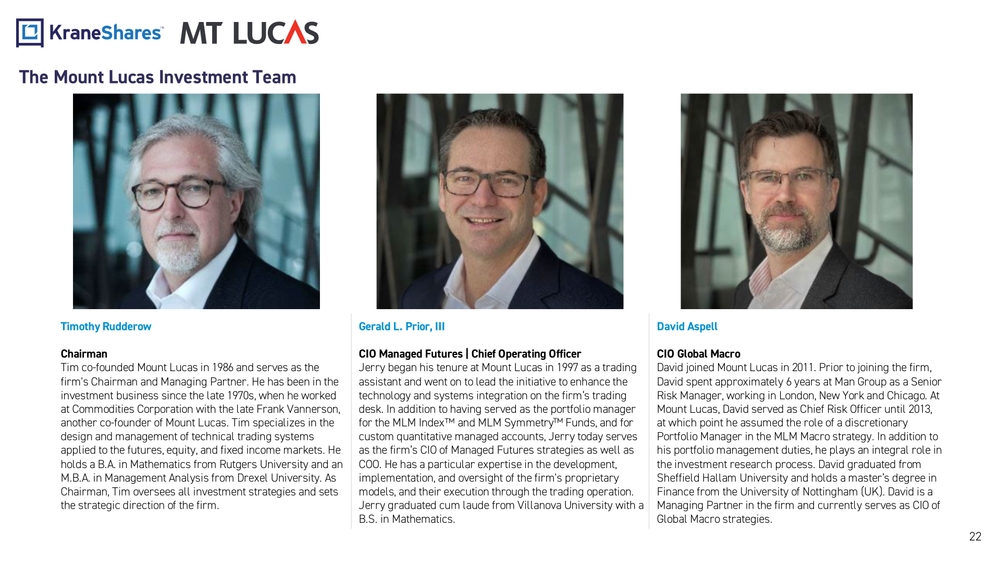
The Mount Lucas Investment Team
Timothy Rudderow
Chairman
Tim co-founded Mount Lucas in 1986 and serves as the firm's Chairman and Managing Partner. He has been in the investment business since the late 1970s, when he worked at Commodities Corporation with the late Frank Vannerson, another co-founder of Mount Lucas. Tim specializes in the design and management of technical trading systems applied to the futures, equity, and fixed income markets. He holds a B.A. in Mathematics from Rutgers University and an M.B.A. in Management Analysis from Drexel University. As Chairman, Tim oversees all investment strategies and sets the strategic direction of the firm.
Gerald L. Prior, III
CIO Managed Futures | Chief Operating Officer
Jerry began his tenure at Mount Lucas in 1997 as a trading assistant and went on to lead the initiative to enhance the technology and systems integration on the firm's trading desk. In addition to having served as the portfolio manager for the MLM Index and MLM Symmetry Funds, and for custom quantitative managed accounts, Jerry today serves as the firm's CIO of Managed Futures strategies as well as COO. He has a particular expertise in the development, implementation, and oversight of the firm's proprietary models, and their execution through the trading operation. Jerry graduated cum laude from Villanova University with a B.S. in Mathematics.
David Aspell
CIO Global Macro
David joined Mount Lucas in 2011. Prior to joining the firm, David spent approximately 6 years at Man Group as a Senior Risk Manager, working in London, New York and Chicago. At Mount Lucas, David served as Chief Risk Officer until 2013, at which point he assumed the role of a discretionary Portfolio Manager in the MLM Macro strategy. In addition to his portfolio management duties, he plays an integral role in the investment research process. David graduated from Sheffield Hallam University and holds a master's degree in Finance from the University of Nottingham (UK). David is a Managing Partner in the firm and currently serves as CIO of Global Macro strategies.
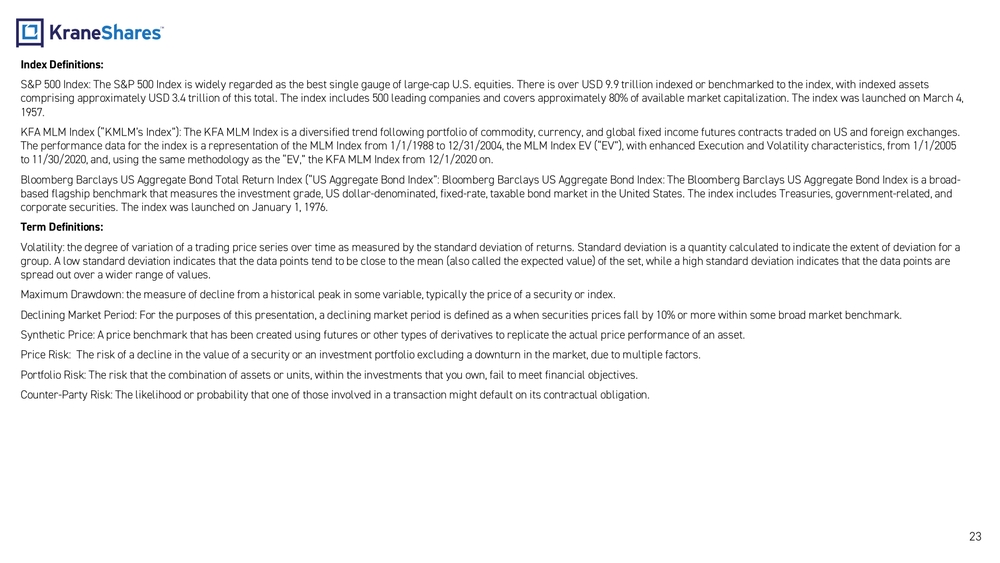
Index Definitions:
S&P 500 Index: The S&P 500 Index is widely regarded as the best single gauge of large-cap U.S. equities. There is over USD 9.9 trillion indexed or benchmarked to the index, with indexed assets comprising approximately USD 3.4 trillion of this total. The index includes 500 leading companies and covers approximately 80% of available market capitalization. The index was launched on March 4, 1957.
KFA MLM Index ("KMLM's Index"): The KFA MLM Index is a diversified trend following portfolio of commodity, currency, and global fixed income futures contracts traded on US and foreign exchanges. The performance data for the index is a representation of the MLM Index from 1/1/1988 to 12/31/2004, the MLM Index EV ("EV"), with enhanced Execution and Volatility characteristics, from 1/1/2005 to 11/30/2020, and, using the same methodology as the "EV," the KFA MLM Index from 12/1/2020 on.
Bloomberg Barclays US Aggregate Bond Total Return Index ("US Aggregate Bond Index"): The Bloomberg Barclays US Aggregate Bond Index is a broad-based flagship benchmark that measures the investment grade, US dollar-denominated, fixed-rate, taxable bond market in the United States. The index includes Treasuries, government-related, and corporate securities. The index was launched on January 1, 1976.
Term Definitions:
Volatility: the degree of variation of a trading price series over time as measured by the standard deviation of returns.
Maximum Drawdown: the measure of decline from a historical peak in some variable, typically the price of a security or index.
Declining Market Period: For the purposes of this presentation, a declining market period is defined as when securities prices fall by 10% or more within some broad market benchmark.
Synthetic Price: A price benchmark that has been created using futures or other types of derivatives to replicate the actual price performance of an asset.
Price Risk: The risk of a decline in the value of a security or an investment portfolio excluding a downturn in the market, due to multiple factors.
Portfolio Risk: The risk that the combination of assets or units, within the investments that you own, fail to meet financial objectives.
Counter-Party Risk: The likelihood or probability that one of those involved in a transaction might default on its contractual obligation.
Important Notes
Carefully consider the Funds' investment objectives, risk factors, charges and expenses before investing. This and additional information can be found in the Funds' full and summary prospectus, which may be obtained by visiting www.kraneshares.com/kmlm. Read the prospectus carefully before investing.
Risk Disclosures:
Investing involves risk, including possible loss of principal. There can be no assurance that a Fund will achieve its stated objectives. Indices are unmanaged and do not include the effect of fees. One cannot invest directly in an index.
This information should not be relied upon as research, investment advice, or a recommendation regarding any products, strategies, or any security in particular. This material is strictly for illustrative, educational, or informational purposes and is subject to change.
The Fund may invest in derivatives, which are often more volatile than other investments and may magnify the Fund's gains or losses. A derivative (i.e., futures/forward contracts, swaps, and options) is a contract that derives its value from the performance of an underlying asset. The primary risk of derivatives is that changes in the asset's market value and the derivative may not be proportionate, and some derivatives can have the potential for unlimited losses. Derivatives are also subject to liquidity and counterparty risk.
Fluctuations in currency of foreign countries may have an adverse effect to domestic currency values. The use of futures contracts is subject to special risk considerations.
The Fund invests through a subsidiary, and is indirectly exposed to the risks associated with the Subsidiary's investments. Since the Subsidiary is organized under the law of the Cayman Islands and is not registered with the SEC under the Investment Company Act of 1940, as such the Fund will not receive all of the protections offered to shareholders of registered investment companies.
The Fund is subject to interest rate risk, which is the chance that bonds will decline in value as interest rates rise. KMLM is non-diversified.
ETF shares are bought and sold on an exchange at market price (not NAV) and are not individually redeemed from the Fund. Shares may trade at a premium or discount to their NAV in the secondary market. Brokerage commissions will reduce returns.
The KraneShares ETFs, KFA Funds ETFs, and KraneShares Mutual Funds are distributed by SEI Investments Distribution Company (SIDCO), 1 Freedom Valley Drive, Oaks, PA 19456, which is not affiliated with Krane Funds Advisors, LLC, the Investment Adviser for the Funds, or any sub-advisers for the Funds.