2024_09_cbam_and_carbon_diplomacy
by Kraneshares
info@kraneshares.com +1 (212) 933 0393 Oktay Kurbanov CLIFI Partner Carbon Diplomacy: How the EU's New Tool to Price Carbon Emissions from Imported Goods is Leveling the Playing Field
2 kraneshares.cominfo@kraneshares.com +1 (212) 933 0393 Back to Top ↑Table of Contents Introduction 3 CBAM Explained 5 CBAM as a Driver of Carbon Pricing: Case Study 9 CBAM as a Driver for Carbon Markets Growth: Emerging Opportunity 13 CBAM Obligations Hedging: New Market Entrants 15 Conclusion 17 Citations 18 Disclosures 20
3 kraneshares.com info@kraneshares.com +1 (212) 933 0393 Back to Top ↑Introduction The Carbon Border Adjustment Mechanism (CBAM) is poised to be one of the most transformative regulatory initiatives in the global carbon market, reshaping not only the EU Emissions Trading System (EU ETS) but also influencing carbon markets worldwide. As part of the European Union’s bold strategy to achieve net-zero emissions by 2050, CBAM is designed to level the playing field by ensuring that companies importing goods into the EU pay a fair price for the carbon emissions embedded in their products. This is achieved through the purchase of “CBAM certificates,” whose prices are directly tied to the existing EU ETS allowances (EUAs). Officially phased in starting in 2026, this new carbon tariff will help protect the integrity of Europe’s climate policies while also setting a new standard for global trade. For investors, CBAM represents a powerful new driver for the expansion of carbon trading and potential price appreciation. This regulation not only bolsters the value of carbon allowances in established markets like the EU but also paves the way for exciting opportunities in emerging carbon markets around the world. The KraneShares Global Carbon Strategy ETF (KRBN) is strategically positioned to capture these potential opportunities, as it includes the largest and most liquid carbon markets while dynamically adjusting to add new markets as they come online.
4 kraneshares.com info@kraneshares.com +1 (212) 933 0393 Back to Top ↑CBAM Impact Highlights: •By design, CBAM will act as a catalyst for carbon markets growth globally by incentivizing establishment of local carbon markets with policies supportive of carbon price increases. •As a result, ETS coverage of global emissions is expected to increase by more than 50%, from the current 18% up to 28% coverage of total global greenhouse gas (GHG) emissions. •As new ETS develop, investable carbon markets are expected to triple in dollar volume by the end of the decade, growing up to $2.5+ trillion traded volume in 2030. •EU importers are expected to at least partially hedge their CBAM obligations to decrease volatility of their profits. By 2030, the hedging demand is expected to range from 40 to 60Mt of carbon allowances, representing 5% to 7.5% of the annual supply. •As EU reviews CBAM regulations ahead of its start in 2026, there is a possibility of the expansion of CBAM coverage to include other sectors such as chemicals, paper, pulp, rubber, plastics, and others. Since the current CBAM scope represents only 7.7% of total EU imports1, any such addition can drastically magnify positive and price supportive trends for carbon markets. This paper starts by diving into key inputs and mechanics of CBAM fees calculations, followed by a case study in carbon diplomacy – analyzing what carbon policies in exporting countries are optimal to minimize CBAM obligations. This is followed by an analysis of the projected growth
5 kraneshares.com info@kraneshares.com +1 (212) 933 0393 Back to Top ↑of investable carbon markets, which is expected to be accelerated by CBAM policies. The next section will analyze potential volumes of hedging activity in various sectors and their impact on carbon markets. The paper concludes with a summary, highlighting the impact of these trends on investors with global carbon portfolios. CBAM Explained The concern about carbon leakage, i.e. the negative impact of carbon pricing on critical industries that are at risk of competition with overseas exporters, is as old as the EU ETS itself. Starting from 2009 and amending it in subsequent years, the European Commission identified industries at risk of carbon leakage that generally fall within these sectors: Cement, Iron & Steel, Aluminum, Fertilizers, Pulp & Paper, Ceramics, Glass, Chemicals, Plastics, Rubber, Electricity, Hydrogen and more.2 In its early stages, EU ETS used free allocation to address this concern, where companies in these sectors would receive free allocation of carbon allowances to cover most of their emissions, based on expected carbon intensity benchmarks established by the EU. This is the reason why only 57% of the annual supply is currently offered through auctions – the rest is allocated for free.3 While this industry protection method worked, it has reduced revenue generated from auctions, limiting the potential funding that could be used for decarbonization and social purposes. It also did little to encourage EU trading partners to pay their fair price for carbon emissions, undermining EU’s broader climate objectives. The answer to this problem was the introduction
6 kraneshares.com info@kraneshares.com +1 (212) 933 0393 Back to Top ↑of the Carbon Border Adjustment Mechanism, or “CBAM”. Under this mechanism, EU importers will have to pay fees based on carbon emissions embedded in the production of imported goods. These fees are payable by buying “CBAM certificates” whose price is determined by average weekly auction prices of EUAs.4 The initial implementation of CBAM covers imports of iron and steel, aluminum, cement, fertilizers, hydrogen and electricity, with a possibility of expansion later. Following WTO rules, CBAM is designed with trade fairness in mind. Three key inputs determine CBAM obligations:
- Carbon Intensity of imported goods vs. the EU carbon intensity benchmark for a given sector. EU importers will only pay CBAM fees if their carbon intensity is higher than this “CBAM threshold”. This benchmark is also serving as a basis for “free allocation” for local EU companies. An EU company will get free allocation up to this benchmark but will have to buy extra allowances if its carbon intensity is higher.
- Reduction factor for free allocations. Currently, the number of free allocations is based on 100% of the EU carbon intensity benchmark for such sector (reduction factor = 100%). However, this % will be scaled down to zero over the next decade as EU switches to CBAM as a tool to prevent carbon leakage. The EU carbon intensity benchmark applied to EU importers in mentioned above will be scaled down by the same reduction factor, creating a tougher target to beat. This makes it a fair process from the WTO perspective: as EU companies get less free allocations
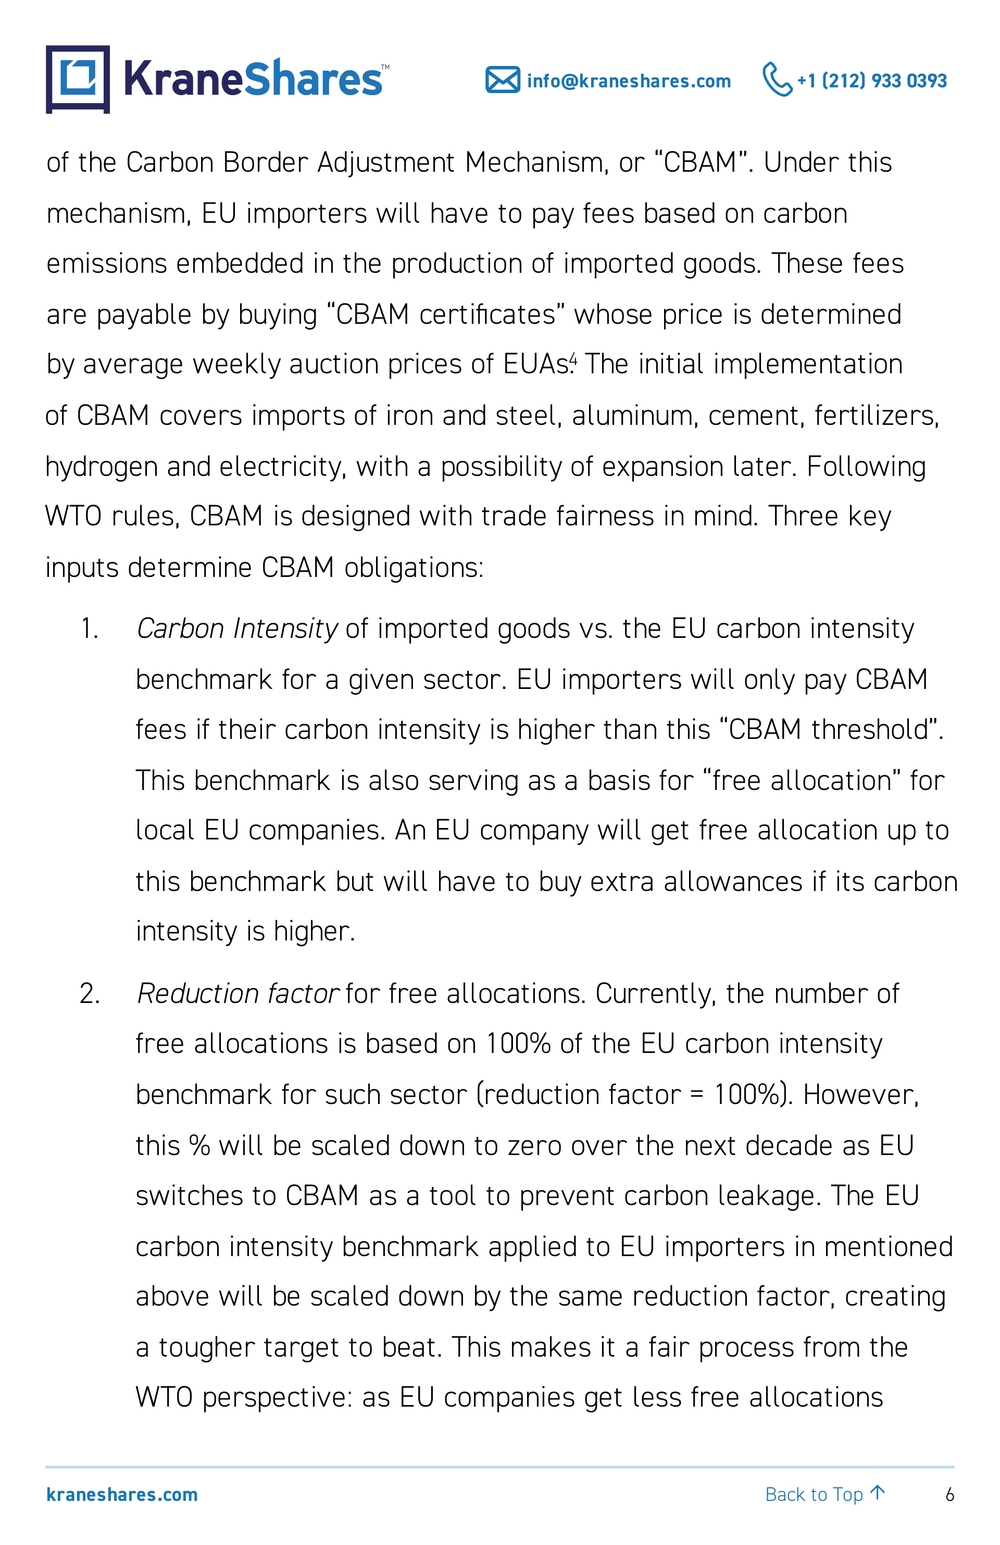
7 kraneshares.com info@kraneshares.com +1 (212) 933 0393 Back to Top ↑and face higher out-of-pocket expenses, EU importers will face equivalently higher CBAM costs as well. Figure 1 below shows this transition over the next decade: Figure 1. Free-Allocation phase-out/CBAM phase-in schedule Source: European Commission, The Carbon Border Adjustment Mechanism , 11/16/2023 3. Carbon pricing in the country of origin for the imported goods. If an imported product’s manufacturer already paid an EUA- equivalent carbon price in the country of origin, then it would not be fair to apply additional CBAM fees to the importers. Inversely, if the importer pays nothing or little carbon price in the country of origin, it will be subject to higher CBAM fees.
8 kraneshares.com info@kraneshares.com +1 (212) 933 0393 Back to Top ↑The diagram below illustrates the above considerations in a single flow chart used to compute CBAM fees: Figure 2. Calculation of CBAM Payment for EU Importers ReductionFactor EUBencmark CarbonIntensityProductCarbon IntensityAmount ofGoodsCBAM Certificate Price(~EUA) CarbonPayment MadeAbroad CBAM PaymentProductCarbon IntensityCarbonPricein CountryofOriginAmount ofGoodsCBAM Obligation Source: European Commission, The Carbon Border Adjustment Mechanism, 11/16/2023 https://taxation-customs.ec.europa.eu/carbon-border-adjustment-mechanism_en, accessed 6/24/2024; Morgan Stanley, “CBAM and the Path to a Global Carbon Price”, May 2024; CLIF As an example, let us calculate an expected 2026 CBAM payment for a Chinese company exporting 10 million tons worth of steel products into EU (“amount of goods”). Chinese steel production is dominated by a coal- based blast furnace process with carbon intensity of 2.1 tones of CO2 per ton of steel.5 Compare this to the EU benchmark which is 1.328 tCO2 per ton of steel.6 Furthermore, as part of CBAM transition, this benchmark is scaled down by the reduction factor, which in 2026 (first year of CBAM) will be 97.5%. Setting the CBAM Certificate Price to the forecasted7 2026 EUA price of €95/t the embedded carbon CBAM obligation is equal to 10e6 x (2.1 – 1.328 x 97.5%) x 95 = €765M. Assuming Chinese National ETS prices of 90¥/t in 20268, and FX conversion rate 7.78¥/€9, local carbon payments made in the Chinese National ETS would be equal to 10e6 x 2.1 x 90 / 7.78 = €243M. After subtracting this from the CBAM obligation, the
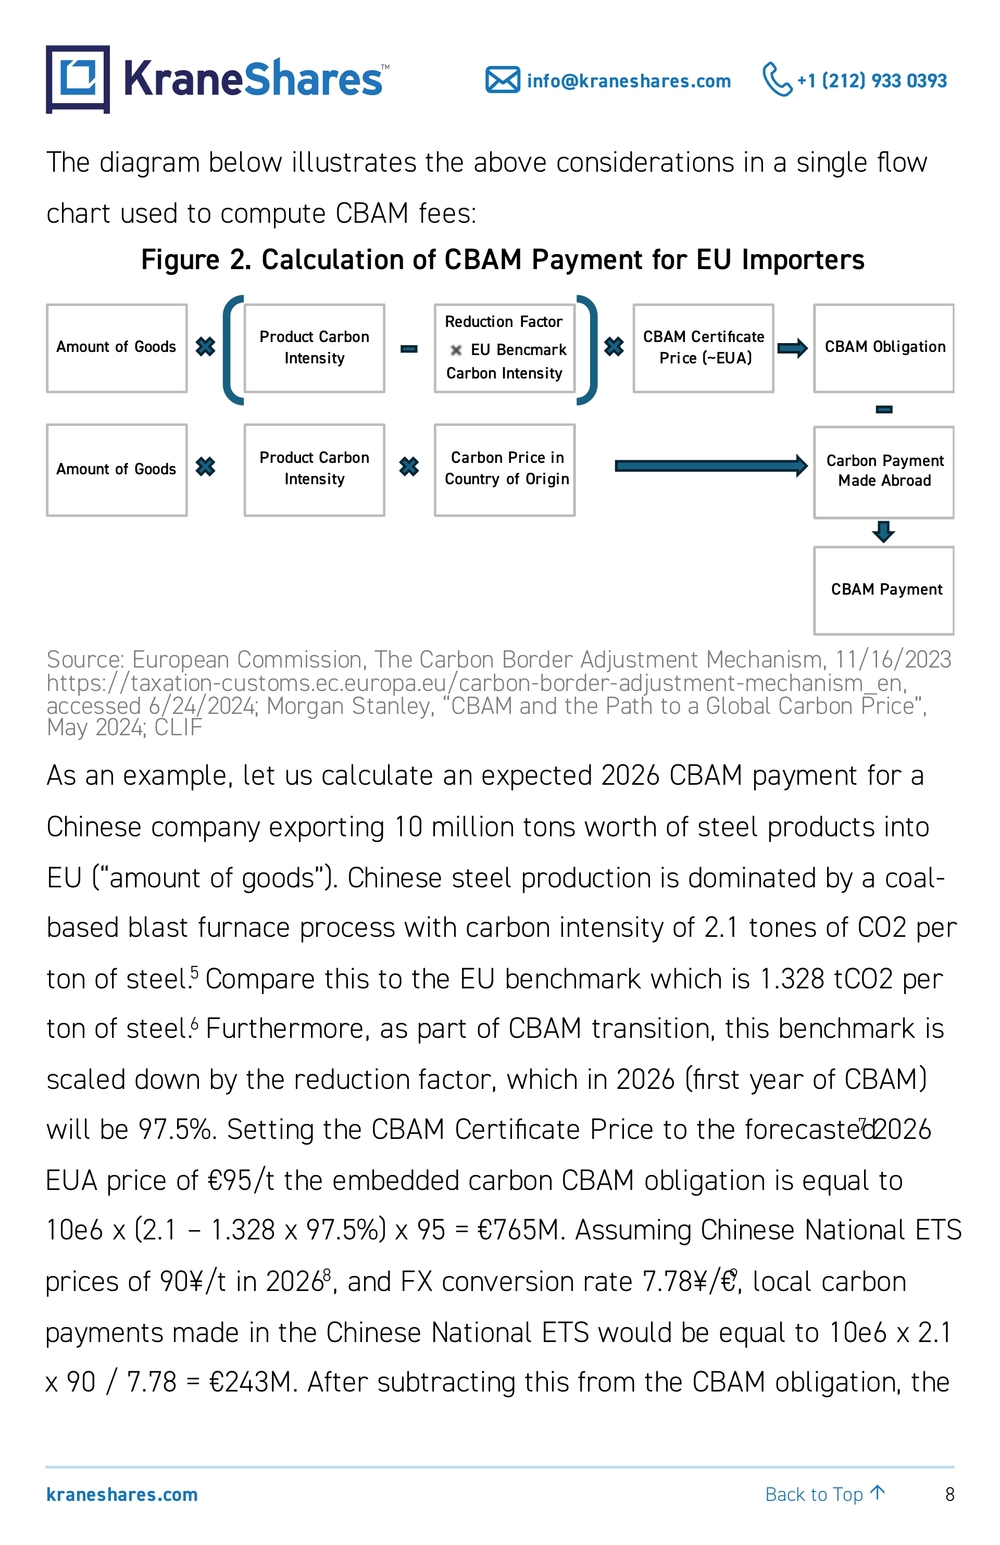
9 kraneshares.com info@kraneshares.com +1 (212) 933 0393 Back to Top ↑CBAM payment by the Chinese company will be €522M. This represents approximately 2.7% of the company’s revenue using average trade value of Chinese Iron & Steel products.10 As CBAM gradually gets fully implemented by 2034, this drag on the revenue will only increase if exporting countries do not implement decarbonization programs. This is the key driver behind EU’s carbon diplomacy. As one can see from Figure 2, there are two levers that countries can use to minimize CBAM exposure: reducing carbon intensity of their exported products and/or increasing local carbon prices. The latter will allow a bigger portion of carbon payments to remain in local jurisdictions, which in turn can support energy transition initiatives including reduction of industries’ carbon intensity. The next chapter analyzes pros and cons of these two options by considering hypothetical scenarios for China’s decarbonization policy targets for the year 2034, when CBAM is fully phased in. CBAM as a Driver of Carbon Pricing: Case Study In this section we investigate decarbonization policies through the prism of CBAM’s by comparing its economic impact in the year it starts, 2026, to its impact in 2034 when it comes in full force. Table 1 below starts with the example discussed above showing CBAM payments and total carbon fees payments by a Chinese steel exporting company for the year 2026. It then considers four policy target scenarios that vary along two dimensions. One dimension is the level of government’s focus to encourage
10 kraneshares.com info@kraneshares.com +1 (212) 933 0393 Back to Top ↑decarbonization of the steel industry by moving from the coal-based blast furnaces (“BF-BOF Steel”) to electric arc furnaces (“EAF Steel”) that are a lot less carbon intensive, shown in the “Product Carbon Intensity” row. The switch is expected to decrease carbon intensity by at about 50%, from 2.1 to 1.1 tCO2 / ton of steel,11 which is reflected in the “High Efficiency” columns. “Low Efficiency” columns are scenarios where this switch does not happen. The second dimension is the level of the government’s support for increasing carbon prices, shown in the “Local Carbon Fees Paid” row. “High Prices” columns show scenarios when Chinese National ETS reaches parity with EUA by the year 2034, at €150/t.12 For “Low Prices” columns, a more modest growth of Chinese ETS allowance prices is assumed, which would approximately double prices levels by 2034, but will be nowhere near parity with EUAs. Note that in 2034 the Reduction Factor becomes 0%, and there will no longer be any carbon intensity threshold that would reduce EU importers obligations (by design, this will mirror the full removal of free allocations to EU companies). The calculation workflow is shown on the left side of the table:
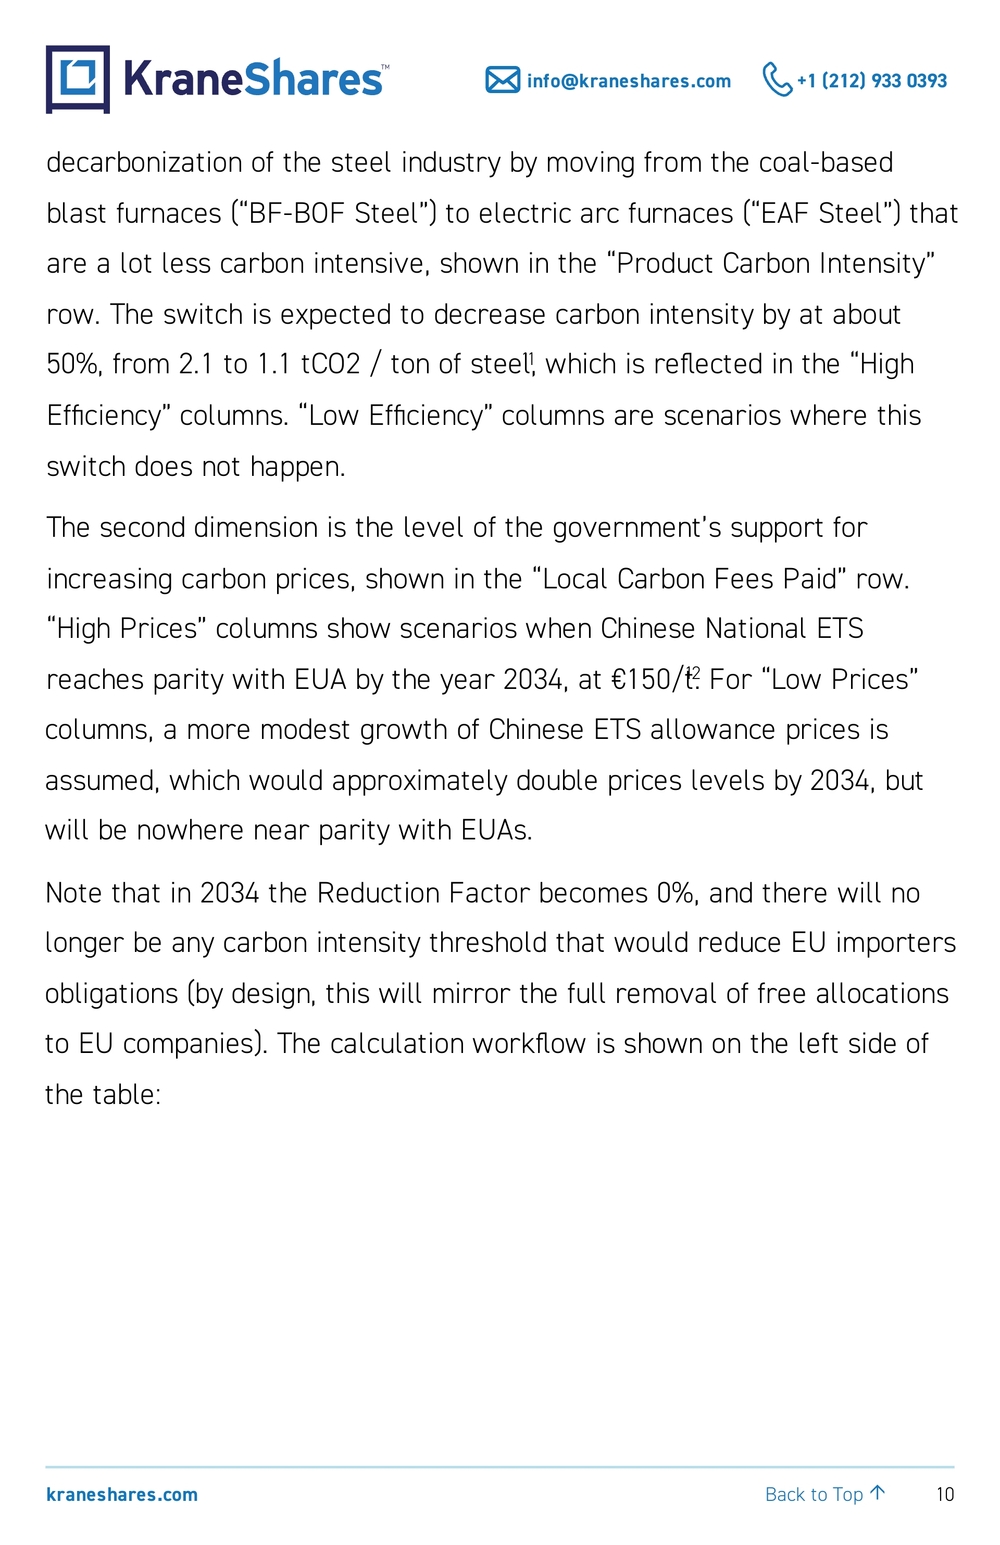
11 kraneshares.com info@kraneshares.com +1 (212) 933 0393 Back to Top ↑Table 1. Impact of hypothetical China’s decarbonization scenarios on a steel exporting company for the year 2034 CBAM Calcuations Workflow UnitsCBAM Start 2026Scenario 1 Low Efficiency Low PricesScenario 2 Low Efficiency High PricesScenario 3 High Efficiency Low PricesScenario 4 High Efficiency High Prices Reduction Factor % 97.5% 0.0% 0.0% 0.0% 0.0% EU Bencmark Carbon Intensity tCO2e/t 1.33 [CBAM Carbon Intensity Threshold tCO2e/t 1.29 0.00 0.00 0.00 0.00 Product Carbon Intensity tCO2e/t 2.10 2.10 2.10 1.11 1.11 Excess Carbon Intensity tCO2e/t 0.81 2.10 2.10 1.11 1.11 Amount of Goods Mt 10 10 10 10 10 CBAM Amount to Cover MtCO2e 8 21 21 11 11 CBAM Certificate Price €/tCO2e 95 150 150 150 150 [CBAM Obligation M€ 765 3,150 3,150 1,660 1,660 Local Carbon Fees Paid M€ 243 486 3,150 256 1,660 CBAM Payment M€ 522 2,664 0 1,404 0 Total Carbon Fees Paid M€ 765 3,150 3,150 1,660 1,660 Policy Impr ovement Source: CLIFI Below are key takeaways from the hypothetical scenarios above •Doing little on both efficiency and carbon pricing side is the costliest route, as shown in Scenario 1. CBAM payments would increase about five-fold compared to 2026, reaching 13.7% of the revenue in today’s prices. While some of the CBAM costs can be passed by importers to EU consumers, this scenario will create a big risk for both profitability and competitiveness of exports. •Aggressive local carbon price increase alone is not an optimal policy choice either as shown by Scenario 2. This scenario avoids CBAM payments due to price parity with EUA, and fully shifts the carbon pricing payments towards the local jurisdiction, which is a positive
12 kraneshares.com info@kraneshares.com +1 (212) 933 0393 Back to Top ↑from the local budget considerations. However, this option does not reduce the company’s total carbon payments, making it difficult to compete globally. •Focusing on efficiency only, as shown by Scenario 3, reduces carbon compliance burden versus previous choices, but it funnels 85% of total carbon payments to the European Union, which is not desirable from the government’s perspective. •A combination of both price increase and efficiency improvement is an optimal combination as shown by the Scenario 4. It minimizes the growth of the total carbon compliance payment while also keeping all the revenue locally. This stylized policy analysis illustrates important points relevant for global investors. As CBAM becomes a reality and gets fully implemented through 2034, exporting countries are likely to pursue market-tightening policies to prop up carbon prices to achieve optimal results as shown in Scenario 4. As carbon prices increase, they help generate greater revenue that will be used to assist in energy transition and switch to more efficient technologies, in steel-making and other areas, creating a mutually beneficial cycle where the ETS system generates government revenue while helping to reduce total carbon payments by exporting companies. As developing markets become open to financial entities in the future, this will create opportunities for global investors to benefit from this unfolding appreciation trend. The next section will touch on this topic by analyzing expected growth of tradeable global carbon markets through the end of the decade.
13 kraneshares.com info@kraneshares.com +1 (212) 933 0393 Back to Top ↑CBAM as a Driver for Carbon Markets Growth: Emerging Opportunity Experience of major carbon markets (EU, UK, California, RGGI) demonstrates the importance of well-functioning secondary carbon markets – markets where companies can sell excess carbon allowances or buy additional allowances to cover their compliance obligations. The success of these markets is partially attributable to their openness to outside financial participants. Their presence increases liquidity of the markets, helps price discovery and reduces trading costs. This is why it is reasonable to expect that the developing ETS markets will also allow financial entities participation over time. With the introduction of CBAM, there will be additional inflow of market participants such as EU importers, that are exposed to liabilities associated with carbon emissions embedded in their traded products. One notices from the CBAM payment calculation in Table 1 that besides exposure to the appreciation of EUAs, these participants also exposed to a decline in local carbon prices as this will reduce the amount of credit they can claim against CBAM obligation. They may decide to hedge their exposure to local markets by going short. While shorting may look as a negative, regulators realize its benefits as a natural source of liquidity for local companies that want to go long to hedge their emission obligations at low costs. Thus, having financial participants as intermediaries who have access to both EU and local markets will facilitate efficient market operation by connecting various players in these markets and ensuring liquidity and low costs.
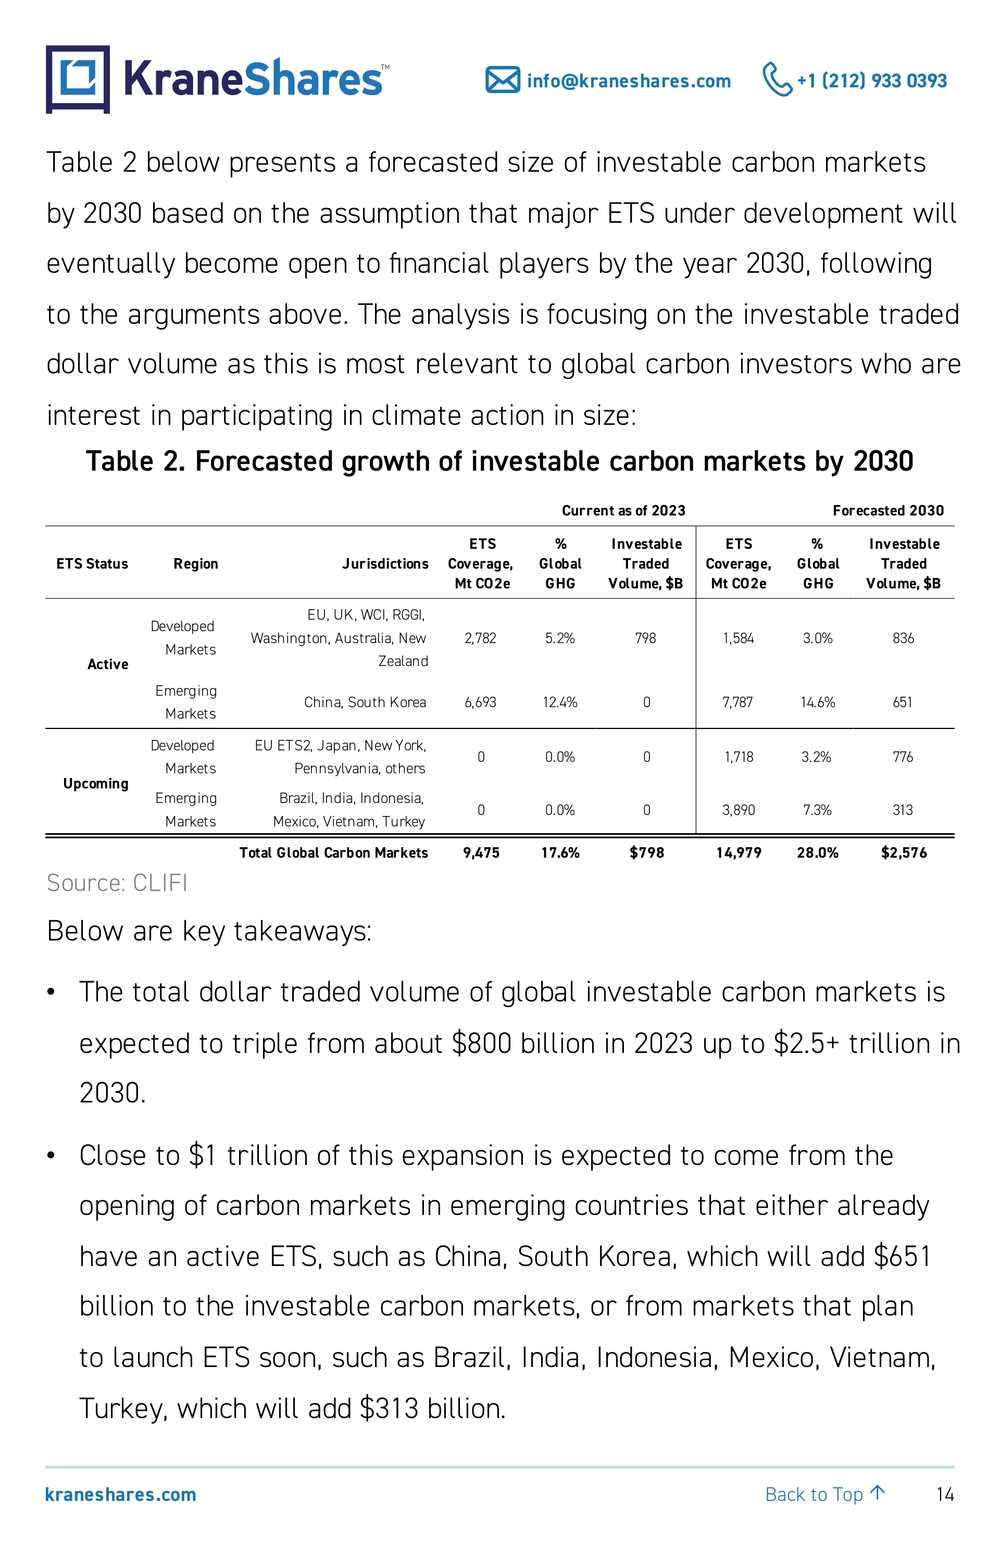
14 kraneshares.com info@kraneshares.com +1 (212) 933 0393 Back to Top ↑Table 2 below presents a forecasted size of investable carbon markets by 2030 based on the assumption that major ETS under development will eventually become open to financial players by the year 2030, following to the arguments above. The analysis is focusing on the investable traded dollar volume as this is most relevant to global carbon investors who are interest in participating in climate action in size: Table 2. Forecasted growth of investable carbon markets by 2030 Current as of 2023 Forecasted 2030 ETS Status Region JurisdictionsETS Coverage, Mt CO2e% Global GHGInvestable Traded Volume, $BETS Coverage, Mt CO2e% Global GHGInvestable Traded Volume, $B ActiveDeveloped MarketsEU, UK, WCI, RGGI, Washington, Australia, New Zealand2,782 5.2% 798 1,584 3.0% 836 Emerging MarketsChina, South Korea 6,693 12.4% 0 7,787 14.6% 651 UpcomingDeveloped MarketsEU ETS2, Japan, New York, Pennsylvania, others0 0.0% 0 1,718 3.2% 776 Emerging MarketsBrazil, India, Indonesia, Mexico, Vietnam, Turkey0 0.0% 0 3,890 7.3% 313 Total Global Carbon Markets 9,475 17.6% $798 14,979 28.0% $2,576 Source: CLIFI Below are key takeaways: •The total dollar traded volume of global investable carbon markets is expected to triple from about $800 billion in 2023 up to $2.5+ trillion in 2030. •Close to $1 trillion of this expansion is expected to come from the opening of carbon markets in emerging countries that either already have an active ETS, such as China, South Korea, which will add $651 billion to the investable carbon markets, or from markets that plan to launch ETS soon, such as Brazil, India, Indonesia, Mexico, Vietnam, Turkey, which will add $313 billion.
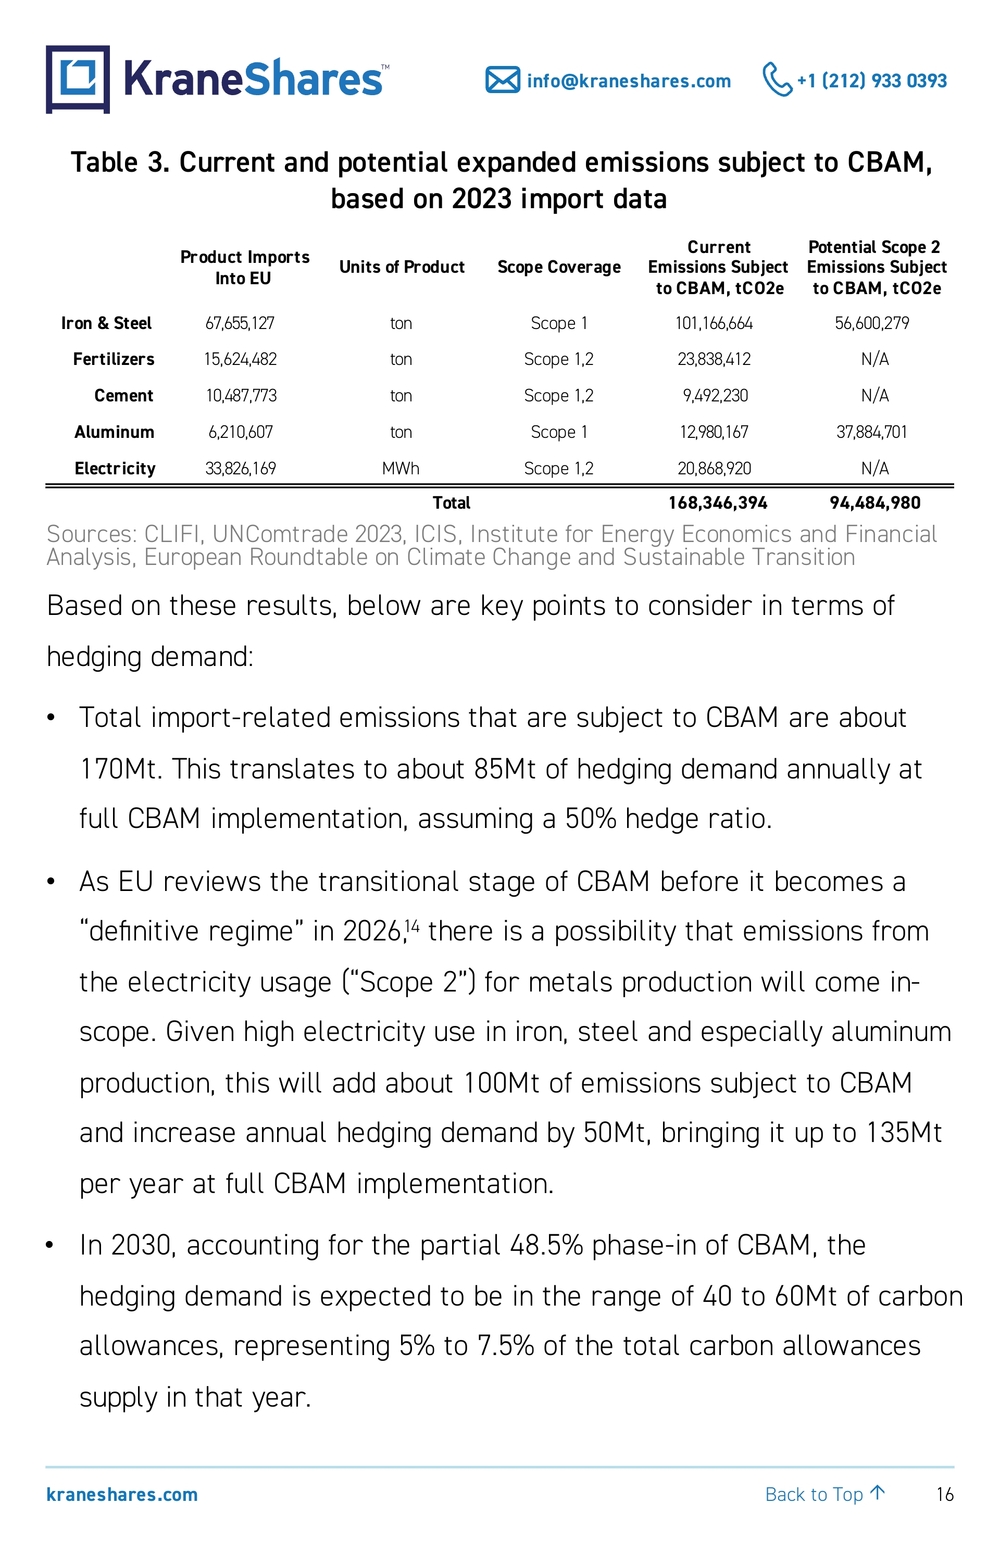
15 kraneshares.com info@kraneshares.com +1 (212) 933 0393 Back to Top ↑ •$776 billion of the expansion comes from introducing new ETS in the developed markets. About $700 billion of this will come from the EU ETS2 which will focus on buildings, road transport, and industry sectors not covered by EU ETS. Additional liquidity may come from the new upcoming state-based ETS in the United States (New York, Pennsylvania, others). •Global emissions coverage by ETS will increase by more than 50%. Currently, emission trading systems cover about 18% of global GHG emissions. As major exporters implement ETS by the end of the decade, this coverage increase to 28%. Combined with carbon tax regimes, carbon pricing is expected to cover 34% of world emissions by 2030, bringing the total coverage to one third of global emissions. While providing a unique investment opportunity for investors, the expansion of carbon markets is also one of the key policy tools in achieving goals set by the Paris agreement to hold global temperature rise below 2°C and pursue efforts to limit the increase to 1.5°C. CBAM Obligations Hedging: New Market Entrants This section provides a high-level analysis of a potential new buying demand due to hedging activity by EU importers. According to the UN Comtrade database, there were about 100Mt of goods imported into European Union in 2023 that fall under CBAM purview.13 Additionally, there was about 34 TWh of electricity import which is also going to be subject to CBAM fees. Table 3 below summarizes carbon emission embedded in EU imports covered by CBAM:
16 kraneshares.com info@kraneshares.com +1 (212) 933 0393 Back to Top ↑Table 3. Current and potential expanded emissions subject to CBAM, based on 2023 import data Product Imports Into EUUnits of Product Scope CoverageCurrent Emissions Subject to CBAM, tCO2ePotential Scope 2 Emissions Subject to CBAM, tCO2e Iron & Steel 67,655,127 ton Scope 1 101,166,664 56,600,279 Fertilizers 15,624,482 ton Scope 1,2 23,838,412 N/A Cement 10,487,773 ton Scope 1,2 9,492,230 N/A Aluminum 6,210,607 ton Scope 1 12,980,167 37,884,701 Electricity 33,826,169 MWh Scope 1,2 20,868,920 N/A Total 168,346,394 94,484,980 Sources: CLIFI, UNComtrade 2023, ICIS, Institute for Energy Economics and Financial Analysis, European Roundtable on Climate Change and Sustainable Transition Based on these results, below are key points to consider in terms of hedging demand: •Total import-related emissions that are subject to CBAM are about 170Mt. This translates to about 85Mt of hedging demand annually at full CBAM implementation, assuming a 50% hedge ratio. •As EU reviews the transitional stage of CBAM before it becomes a “definitive regime” in 2026,14 there is a possibility that emissions from the electricity usage (“Scope 2”) for metals production will come in- scope. Given high electricity use in iron, steel and especially aluminum production, this will add about 100Mt of emissions subject to CBAM and increase annual hedging demand by 50Mt, bringing it up to 135Mt per year at full CBAM implementation. •In 2030, accounting for the partial 48.5% phase-in of CBAM, the hedging demand is expected to be in the range of 40 to 60Mt of carbon allowances, representing 5% to 7.5% of the total carbon allowances supply in that year.
17 kraneshares.com info@kraneshares.com +1 (212) 933 0393 Back to Top ↑Another topic of the EU’s CBAM review will be a potential expansion to other sectors by 2030, such as chemicals, paper, pulp, rubber, and plastics.15 It is hard to model the exact impact of the expansion before the exact details come out. However, one notices that imports of CBAM goods into EU is a relatively small percentage of the overall exports into EU, estimated on the order of 7.7% by weight.16 Consequently, any regulation that adds additional sectors will be highly impactful and should significantly increase the hedging demand through 2030. This would add yet another benefit for carbon investors through a strong support for the EUA prices going forward. Conclusion The above discussion illustrates a multi-faceted impact from the introduction of CBAM. As can be seen in Figure 1, the % of CBAM phase- in approximately doubles from its first year in 2026 through 2030 (2.5%, 5%, 10%, 22.5%, 48.5%). Consequently, as CBAM picks up pace, one should expect acceleration of the discussed impacts: development and implementation of new ETS globally, the growth of investable carbon markets, local policies supportive of carbon price, and increased hedging demand from international trading companies. A key legislative development to look for is the European Commission assessment of the current transitionary period of CBAM, ahead of its start in 2026. As part of this assessment the commission may expand the CBAM sectors and potentially include electricity related emissions embedded in the imported products, which will further amplify the discussed impacts.
18 kraneshares.com info@kraneshares.com +1 (212) 933 0393 Back to Top ↑As countries are preparing for CBAM and evaluating their carbon markets, it is only fitting that the European Commission created a carbon market diplomacy taskforce “to offer its expertise and deploy staff to set up carbon markets, develop a global approach to carbon pricing, intensify its carbon market diplomacy around the world and amplify its efforts to replicate the success of the EU Emissions Trading System (ETS).”17 Another sign of international cooperation on the development of carbon markets is China’s collaboration with the Germany-based European Energy Exchange (EEX) since 2017. EEX has been actively supporting capacity-building activities and establishment of the necessary trading infrastructure in China.18 The above discussion of CBAM and its impact has demonstrated that carbon pricing will play a central role in international trade. It creates yet another fundamental driver, a catalyst, for the expansion of carbon trading and potential price appreciation. This is a welcome news for global investors who include carbon as part of their portfolio, as it provides additional fundamental support for carbon prices in the established markets (EUAs and others) as well as opportunities for participation in the emerging carbon markets in the near future. Citations
- Source: CLIFI, UN Comtrade Database, https://comtradeplus. un.org/ , accessed 7/25 2024
- https://climate.ec.europa.eu/eu-action/eu-emissions-trading- system-eu-ets/free-allocation/carbon-leakage_en , accessed 6/24/2024
19 kraneshares.com info@kraneshares.com +1 (212) 933 0393 Back to Top ↑3. https://icapcarbonaction.com/en/ets/eu-emissions-trading- system-eu-ets , accessed 6/24/2024 4. https://taxation-customs.ec.europa.eu/carbon-border-adjustment- mechanism_en , accessed 6/24/2024 5. Global Energy Monitor, https://globalenergymonitor.org/wp- content/uploads/2024/03/GEM-China-steel-brief-March-2024.pdf , accessed 6/27/2024 6. European Commission, COMMISSION DELEGATED REGULATION (EU) 2019/331, 12/19/2018 7. Source: averaging forecasts from ICIS, Macquarie, Morgan Stanley 8. Source: Statista 9. Source: Bloomberg Cross Rates, as of 6/27/2024 10. Source: UN Comtrade database, 2023 11. Source: Global Energy Monitor, https://globalenergymonitor.org/ wp-content/uploads/2024/03/GEM-China-steel-brief-March-2024. pdf, accessed 6/27/2024. Using 1.3t CO2 per ton of steel and applying 1.6% annual efficiency improvement from 2024 through 2034. 12. Source: CLIFI. Choosing EUA levels required for abatement technologies. Using € currency for the case study analysis. 13. UN Comtrade Database, https://comtradeplus.un.org/ , accessed July 2024 14. European Commission, “ Carbon Border Adjustment Mechanism ”, accessed 7/24/2024 15. Oliver Wyman, “ Carbon Border Adjustment Mechanism ”, October
20 kraneshares.com info@kraneshares.com +1 (212) 933 0393 Back to Top ↑2023, Morgan Stanley, “CBAM and the Path to a Global Carbon Price”, May 2024 16. Source: CLIFI, UN Comtrade Database, https://comtradeplus. un.org/ , accessed 7/25 2024 17. European Commission, “ Europe's 2040 climate target and path to climate neutrality ”, 2/6/2024 18. EEX, https://www.eex.com/en/markets/environmental-markets/ china-carbon , accessed 7/26/2024 Important Notes: Carefully consider the Fund’s investment objectives, risk factors, charges and expenses before investing. This and additional information can be found in the Fund’s full and summary prospectus, which may be obtained by visiting www.kraneshares.com/krbn. Read the prospectus carefully before investing. Risk Disclosures: Investing involves risk, including possible loss of principal. There can be no assurance that a Fund will achieve its stated objectives. Indices are unmanaged and do not include the effect of fees. One cannot invest directly in an index. This information should not be relied upon as research, investment advice, or a recommendation regarding any products, strategies, or any security in particular. This material is strictly for illustrative, educational, or informational purposes and is subject to change. Certain content represents an assessment of the market environment at a speci fic time and is not intended to be a forecast of future events or a guarantee of future results; material is as of the dates noted and is subject to change without notice. The Fund relies on the existence of cap and trade regimes. There is no assurance that cap and trade regimes will continue to exist, or that they will prove to be an effective method of reduction in GHG emissions. Changes in U.S.
21 kraneshares.com info@kraneshares.com +1 (212) 933 0393 Back to Top ↑law and related regulations may impact the way the Fund operates, increase Fund costs and/or change the competitive landscape. New technologies may arise that may diminish or eliminate the need for cap and trade markets. Ultimately, the cost of emissions credits is determined by the cost of actually reducing emissions levels. If the price of credits becomes too high, it will be more economical for companies to develop or invest in green technologies, thereby suppressing the demand for credits. The Fund may invest in derivatives, which are often more volatile than other investments and may magnify the Fund's gains or losses. A derivative (i.e., futures/forward contracts, swaps, and options) is a contract that derives its value from the performance of an underlying asset. The primary risk of derivatives is that changes in the asset's market value and the derivative may not be proportionate, and some derivatives can have the potential for unlimited losses. Derivatives are also subject to liquidity and counterparty risk. The Fund is subject to liquidity risk, meaning that certain investments may become difficult to purchase or sell at a reasonable time and price. If a transaction for these securities is large, it may not be possible to initiate which may cause the Fund to suffer losses. Counterparty risk is the risk of loss in the event that the counterparty to an agreement fails to make required payments or otherwise comply with the terms of derivative. The use of futures contracts is subject to special risk considerations. The primary risks associated with the use of futures contracts include: (a) an imperfect correlation between the change in market value of the reference asset and the price of the futures contract; (b) possible lack of a liquid secondary market for a futures contract and the resulting inability to close a futures contract when desired; (c) losses caused by unanticipated market movements, which are potentially unlimited; (d) the inability to predict correctly the direction of market prices, interest rates, currency exchange rates and other economic factors; and (e) if the Fund has insuf ficient cash, it may have to
22 kraneshares.com info@kraneshares.com +1 (212) 933 0393 Back to Top ↑sell securities or fi nancial instruments from its portfolio to meet daily variation margin requirements, which may lead to the Fund selling securities or fi nancial instruments at a loss. The Fund invests through a subsidiary, and is indirectly exposed to the risks associated with the Subsidiary's investments. Since the Subsidiary is organized under the law of the Cayman Islands and is not registered with the SEC under the Investment Company Act of 1940, as such the Fund will not receive all of the protections offered to shareholders of registered investment companies. The Fund and its Subsidiary will be considered commodity pools upon commencement of operations, and each will be subject to regulation under the Commodity Exchange Act and CFTC rules. Commodity pools are subject to additional laws, regulations and enforcement policies, which may increase compliance costs and may affect the operations and performance of the Fund and the Subsidiary. Futures and other contracts may have to be liquidated at disadvantageous times or prices to prevent the Fund from exceeding any applicable position limits established by the CFTC. The value of a commodity- linked derivative investment typically is based upon the price movements of a physical commodity and may be affected by changes in overall market movements, volatility of the Index, changes in interest rates, or factors affecting a particular industry or commodity. Fluctuations in currency of foreign countries may have an adverse effect to domestic currency values. The Fund is subject to interest rate risk, which is the chance that bonds will decline in value as interest rates rise. Narrowly focused investments typically exhibit higher volatility. The Fund's assets are expected to be concentrated in a sector, industry, market, or group of concentrations to the extent that the Underlying Index has such concentrations. The securities or futures in that concentration could react similarly to market developments. Thus, The Fund are subject to loss due to adverse occurrences that affect that concentration. The Fund is non-diversi fied.
23 kraneshares.com info@kraneshares.com +1 (212) 933 0393 Back to Top ↑KRBN may underperform other similar funds that do not consider conscious company/ESG guidelines when making investment decisions. ETF shares are bought and sold on an exchange at market price (not NAV) and are not individually redeemed from the Fund. However, shares may be redeemed at NAV directly by certain authorized broker-dealers (Authorized Participants) in very large creation/redemption units. The returns shown do not represent the returns you would receive if you traded shares at other times. Shares may trade at a premium or discount to their NAV in the secondary market. Brokerage commissions will reduce returns. Beginning 12/23/2020, market price returns are based on the of ficial closing price of an ETF share or, if the of ficial closing price isn't available, the midpoint between the national best bid and national best offer ("NBBO") as of the time the ETF calculates the current NAV per share. Prior to that date, market price returns were based on the midpoint between the Bid and Ask price. NAVs are calculated using prices as of 4:00 PM Eastern Time. The KraneShares ETFs and KFA Funds ETFs are distributed by SEI Investments Distribution Company (SIDCO), 1 Freedom Valley Drive, Oaks, PA 19456, which is not af filiated with Krane Funds Advisors, LLC, the Investment Adviser for the Funds, or Climate Finance Partners, the Sub-Advisor for the Fund, or IHS Markit Ltd.
info@kraneshares.com +1 (212) 933 0393 ABOUT KRANESHARES Krane Funds Advisors, LLC is the investment manager for KraneShares ETFs. KraneShares offers innovative investment solutions tailored to three key pillars: China, Climate, and Uncorrelated Assets. Our team is determined to provide industry-leading, differentiated, and high-conviction investment strategies that offer access to key market trends. Our mission is to empower investors with the knowledge and tools necessary to capture the importance of these themes as an essential element of a well-designed investment portfolio.Climate Market Blog ClimateMarketNow.comSubscribe to our climate blog: