IVOL Quarterly Update 4.1.2021.pdf
by Kraneshares
For Institutional Investor Use Only. Not for Retail Distribution
IVOL Q1 Quarterly Update Following its strong positive performance in 2020, IVOL continued to outperform in the first quarter of 2021 . IVOL generated positive returns in a quarter that saw most other fixed income funds post negative returns as interest rates began to normalize.
Additionally, IVOL has distributed a minimum of 30 bps monthly since July 2019.
IVOL Performance as of 3 /31/21 Cumulative % Average Annualized % 3 Mo 6 Mo Since Inception 1yr 3yr Since Inception Fund NAV 2.71% 6.26% 21.55% 13.65% – 10.93% Closing Price 3.10% 6.12% 22.00% 14.74% – 11.15% Index* -1.47% 0.12% 14.29% 7.54% – 7.34%
Period (through 3/31/2021) IVOL NAV IVOL ITD (5/14/2019 to 3/31/202 1) 21.55 % 2020 14.72% Q1 2021 2.71%
The performance data quoted represents past performance. Past performance does not guarantee future results. The investment return and principal value of an investment will fluctuate so that an investor's shares, when sold or redeemed, may be worth more or less than their original cost and current performance may be lower or higher than the performance quoted. For performance data current to the most recent month end, please visit www.ivoletf.com
For Institutional Investor Use Only. Not for Retail Distribution IVOL Correlation Update as of 3/31/21 Importantly, IVOL also continued to show low correlations to many other commonly traded asset classes. Investments with low correlation coefficients are often attractive as potential diversifiers.
IVOL NAV Correlation To: DOW S&P 500 Barclay’s Agg MSCI EM HY Credit Gold VIX Daily Correlation 0.04 0.05 0.06 0.16 0.14 0.15 -0.09
Daily correlation from 5/14/19 to 03/31/21. Source: Bloomberg and Quadratic calculations. Index returns are for illustrative purposes only and do not represent actual Fund performance. Past performance does not guarantee future results.
Market Commentary In this Q1 commentary, we want to update our investors about IVOL’s performance during the past quarter . We also discuss how several credit instruments commonly used in short -duration funds may be adding risk to investors’ portfolios. As we moved through Q1, the market began to look forward to the end of COVID and the attendant lockdowns. I nterest rate s have started to normalize from their extremely low levels. Given the se rate moves, investors are keenly aware of the duration risk in th eir portfolios . We addressed this risk back in our Q4 Update in a section we called “Short Duration” (see previous link here) . If you ’re nervous owning bonds at these levels – and who wouldn’t be? - then we understand why you might be drawn to a so -called “short duration” fund. To an extent, being “less long” duration may partially solve your problem with interest rate risk.
But doing so raises other potential risks . First, the yield from your less -long duration bonds is even more paltry. What are you earning on your short duration fund? Does that come anywhere near the return required to meet your future obligations? Even if you succeed in avoiding the big mark -to-market loss when rates rise, you fail to achieve your longer -term goals because your yield makes it barely worth
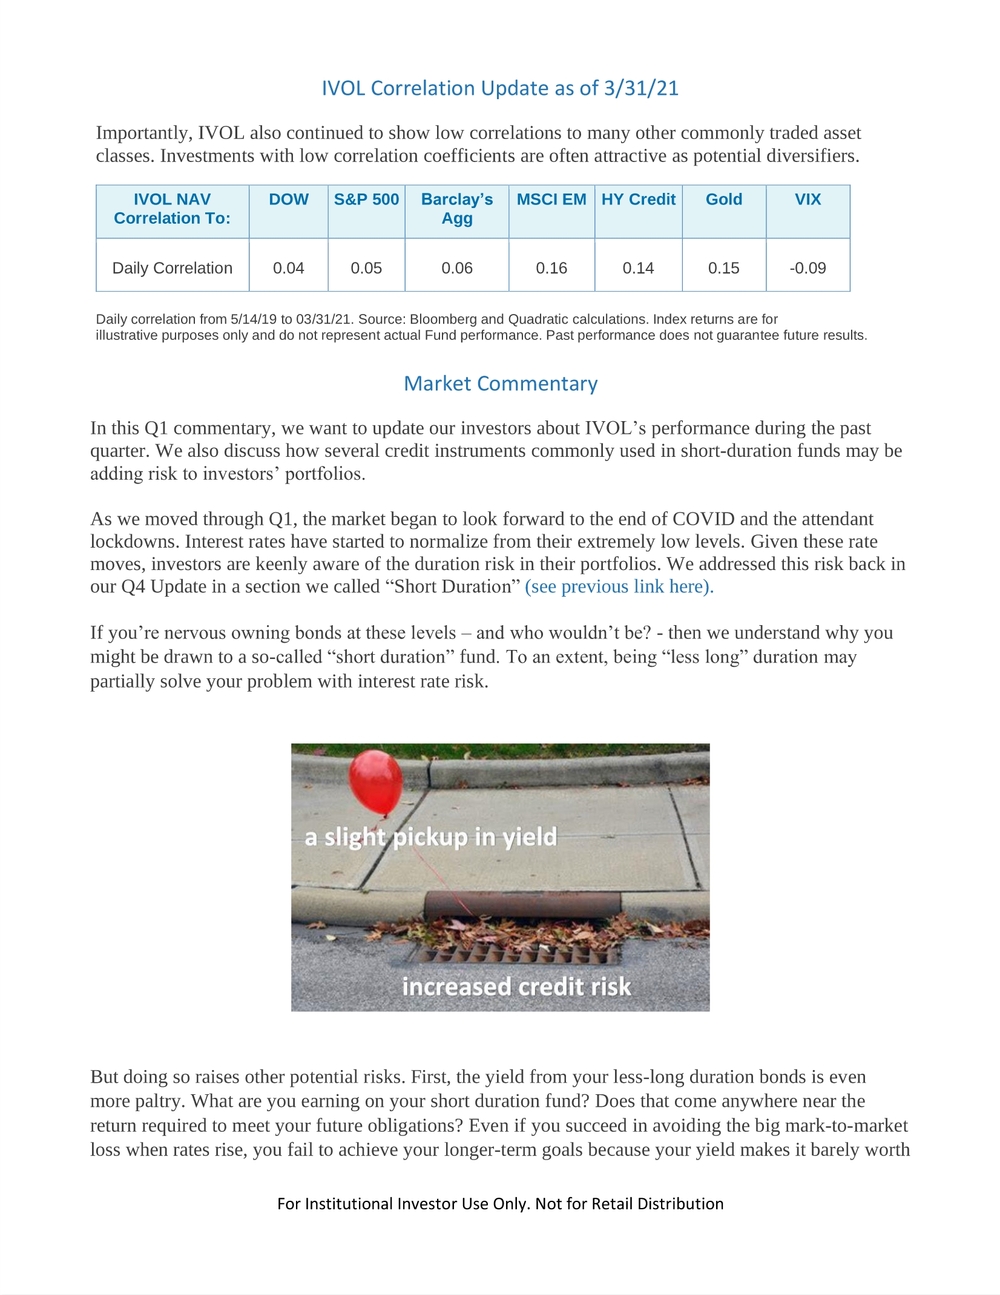
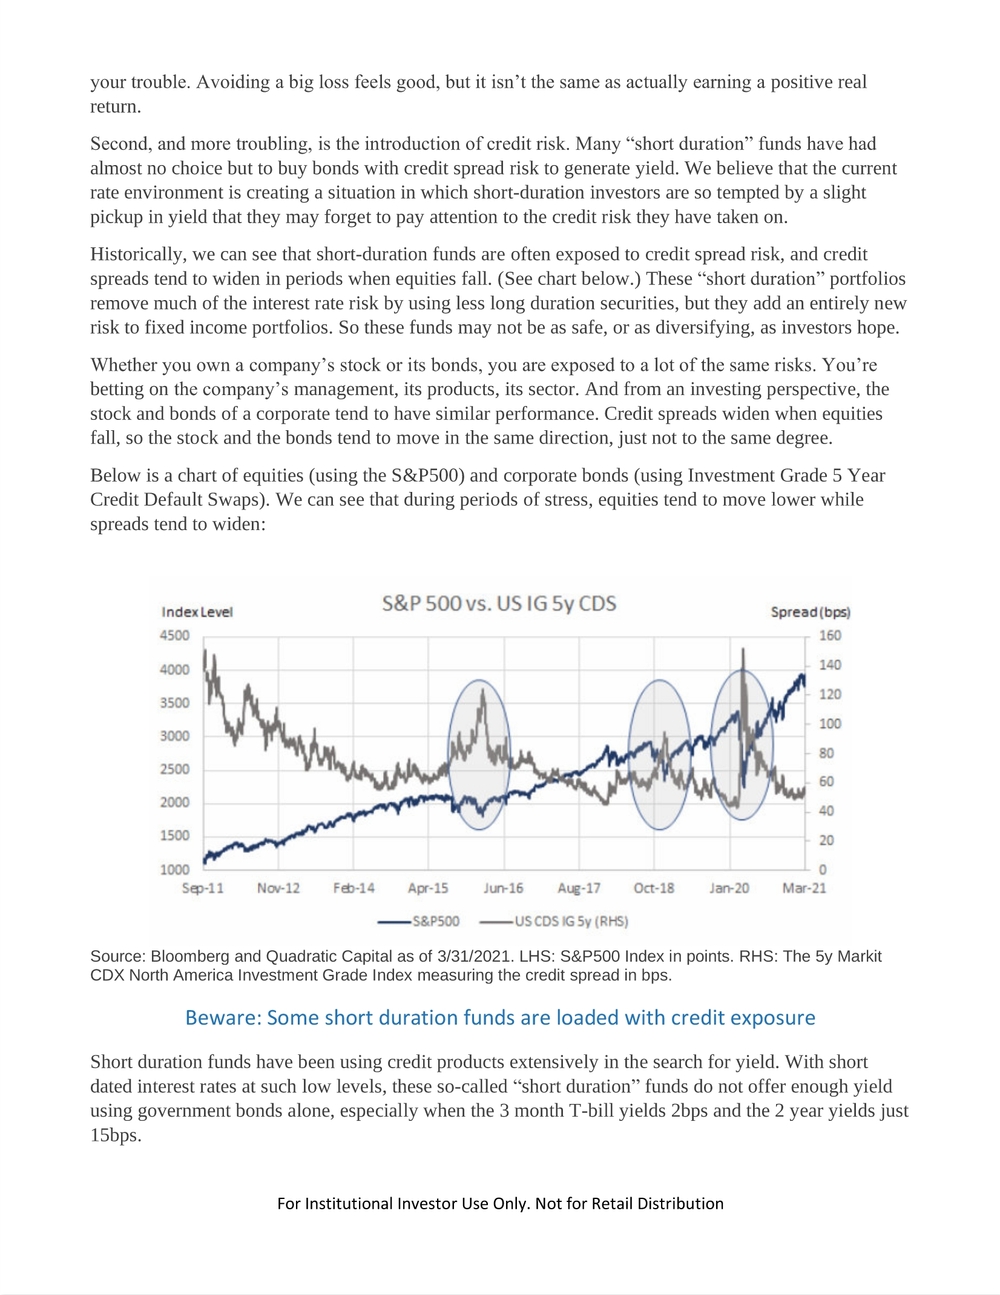
For Institutional Investor Use Only. Not for Retail Distribution your trouble. Avoiding a big loss feels good, but it isn’t the same as actually earning a positive real return. Second, and more troubling, is the introduction of credit risk. Many “short duration” funds have had almost no choice but to buy bonds with credit spread risk to generate yield . We believe th at the current rate environment is creating a situation in which s hort-duration investors are so tempted by a slight pickup in yield that they may forget to pay attention to the credit risk they have taken on . Historically, we can see that short -duration funds are often exposed to credit spread risk, and credit spreads tend to widen in periods when equities fall. (See chart below.) These “short duration” portfolios remove much of the interest rate risk by using less long duration securities, but they add an entirely new risk to fixed income portfolios. So the se funds may not be as safe , or as diversifying, as investors hope. Whether you own a company’s stock or its bonds, you are exposed to a lot of the same risks. You’re betting on the company’s management, its products, its sector. And from an investing perspective, the stock and bonds of a corporate tend to have similar performance. Credit spreads widen when equities fall, so the stock and the bonds tend to move in the same direction, just not to the same degree. Below is a chart of equities (using the S&P500) and corporate bonds (using Investment Grade 5 Year Credit Default Swaps). We can see that during periods of stress , equities tend to move lower while spreads tend to widen :
Source: Bloomberg and Quadratic Capital as of 3/31/2021 . LHS: S&P500 Index in points. RHS: The 5y Markit CDX North America Investment Grade Index measuring the credit spread in bps.
Beware: Some short duration funds are loaded with credit exposure
Short duration funds have been using credit products extensively in the search for yield . With short dated interest rates at such low level s, these so -called “short duration ” funds do not offer enough yield using government bonds alone, especially when the 3 month T -bill yields 2bps and the 2 year yields just 15bps.
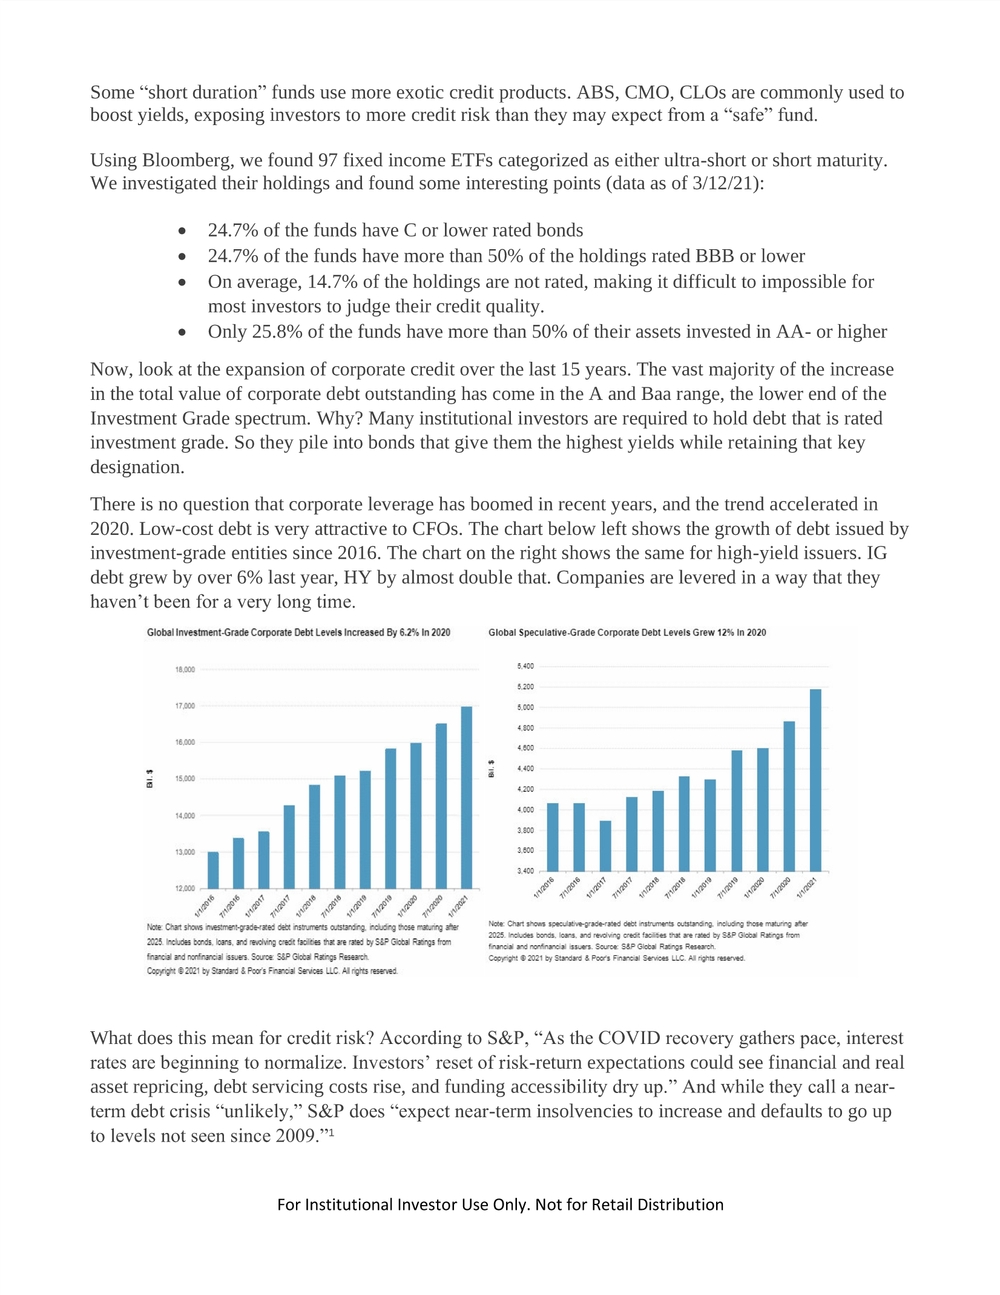
For Institutional Investor Use Only. Not for Retail Distribution Some “short duration ” funds use more exotic credit products . ABS, CMO, CLOs are commonly used to boost yield s, exposing investors to more credit risk than they may expect from a “safe” fund. Using Bloomberg, we found 97 fixed income ETFs categorized as either ultra -short or short maturity. We investigated their holdings and found some interesting points (data as of 3/12/21) : • 24.7% of the funds have C or lower rated bonds • 24.7% of the funds have mor e than 50% of the holdings rated BBB or lower • On average, 14 .7% of the holdings are not rated, making it difficult to impossible for most investor s to judge their credit quality. • Only 25. 8% of the funds have more than 50% of the ir assets invested in AA - or higher Now , look at the expansion of corporate credit over the last 15 years. The vast majority of the increase in the total value of corporate debt outstanding has come in the A and Baa range, the lower end of the Investment Grade spectrum. Why? Many institutional i nvestors are required to hold debt that is rated investment grade. So they pile into bonds that give them the highest yields while retaining that key designation . There is no question that corporate leverage has boomed in recent years, and the trend accel erated in 2020. Low-cost debt is very attractive to CFOs. The chart below left shows the growth of debt issued by investment -grade entities since 2016. The chart on the right shows the same for high -yield issuers. IG debt grew by over 6% last year, HY by a lmost double that. Companies are levered in a way that they haven’t been for a very long time.
What does th is mean for credit risk? According to S&P, “As the COVID recovery gathers pace, interest rates are beginning to normalize. Investors’ reset of risk -return expectations could see financial and real asset repricing, debt servicing costs rise, and funding acces sibility dry up.” And while they call a near - term debt crisis “unlikely,” S&P does “expect near -term insolvencies to increase and defaults to go up to levels not seen since 2009.”1
For Institutional Investor Use Only. Not for Retail Distribution The Federal Reserve shares S&P’s view. In its Monetary Policy Report for Fe bruary, the Fed wrote, “While near -term risks associated with debt service may be limited by large cash balances at large firms, low interest rates, and recently improved earnings prospects, insolvency risks at small and medium -sized firms, as well as at s ome large firms, remain considerable .”2
What happens when interest rates aren’t low? So, how far down the credit ladder should investors’ reach for yield extend? How many basis points of yield should one trade for how many basis points of increase in risk of default? And does one have the foresight to run back up the ladder before rising interest rates cause the trouble that the Fed and S&P seem to see on the horizon? Just how comfortable should one be in a “short duration” fund? We believe investors need to be careful picking a side in this argument. As we say frequently, even if you’ve got high conviction – especially if you’ve got high conviction – it’s a good idea to be prepared to be wrong. It’s one of the reasons we built IVO L the way we did. Our investors don’t have to express a view on when the credit markets will act up, or whether defaults will increase. We don’t own any bonds with corporate credit spread risks. IVOL is composed of only two things: US Treasur ies with Inflation -Protect ion (TIPS) enhance d with a portfolio of options tied to the shape of the yield curve. Our options have the potential to increase in value with a normalization of rates, or to benefit from higher long term rates or lower short term rates . And IVOL has paid a distribution of at least 30 bps per month since July 2019.
How Many Rate Hikes Are Coming? The first quarter of 2021 marked an important change for fixed income. While equity and credit markets had rallied strongly in 2020, the fixed income markets have now joined in. O f course, markets are still trying to work out how strong and how fast the economic recovery is going to be. For now, it seems nearly impossible to know if the recovery is going to be V shaped, U shaped, or some strange Greek letter. One bit of clarity is the guidance from the Federal Reserve. The Fed has been very clear about their policy goals : • Average Inflation Targeting (AIT) means they aren’t going to move on rates until well after inflation is comfortably over 2%. • They are focused on the jobless numbers, and not just headline unemployment. They’re also watching labor force participation. And we have a long way to go to get back to full employment. • They are committed to keeping short term rates low and not tapering yet . Do the markets believe the Fed? D espite Powell’s clear, plain -English statements, the rates market has started to price in more and faster Fed rate hikes than the Fed itself expects . At the beginning of the year, only one potential 25 bps hike was priced in until the end of 2023. As we write this , the market is pricing almost four full hikes by the end of 2023. Th e bar chart below shows the market’s expectations
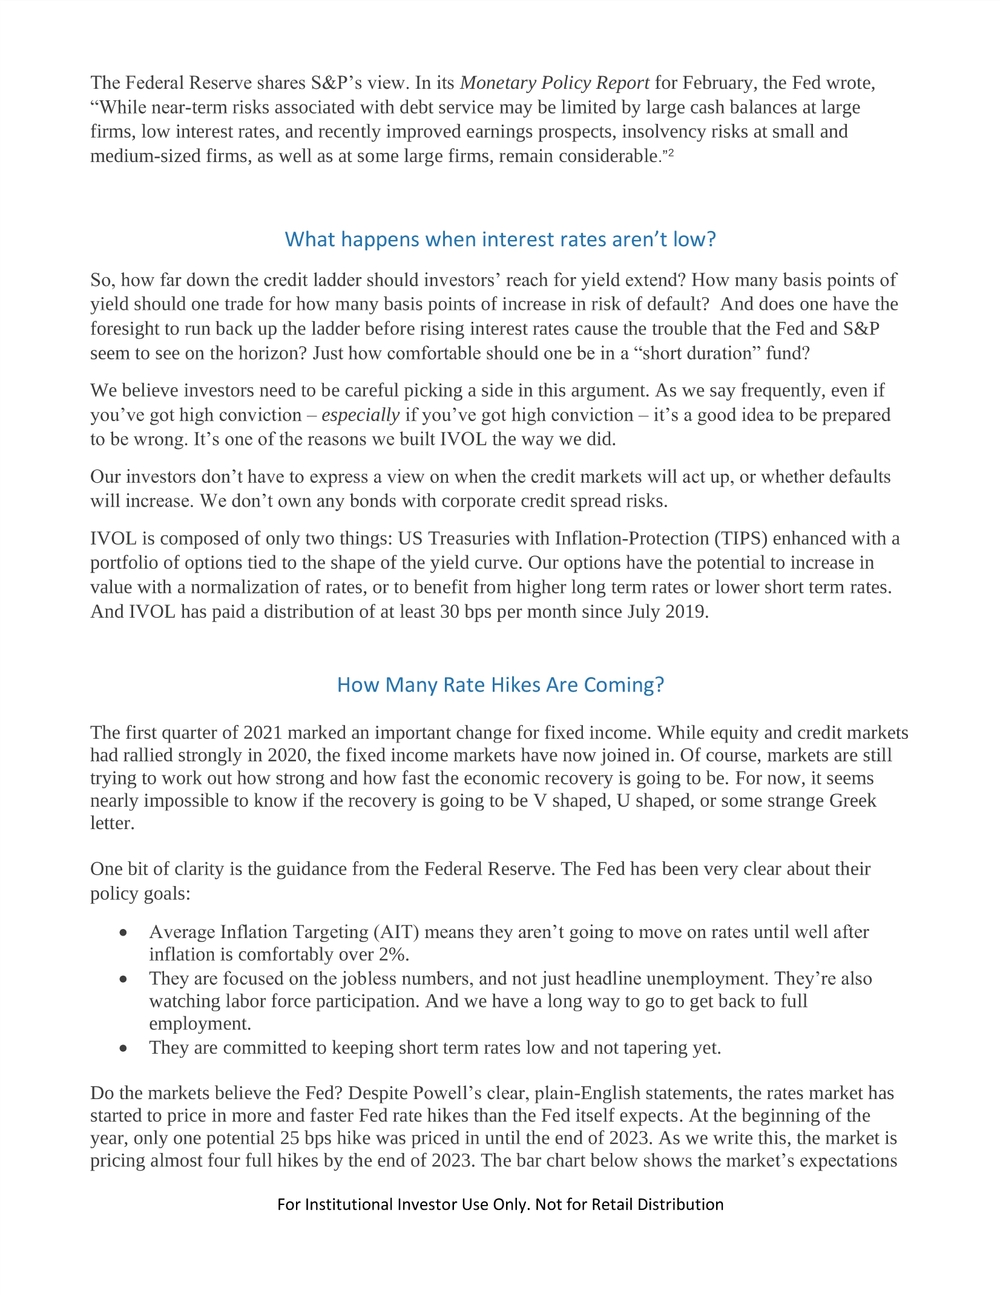
For Institutional Investor Use Only. Not for Retail Distribution for future rate hikes based on prices on March 31st. The flat dashed line shows the median dot plot published by the Fed itself on March 17th. Source: Bloomberg, Federal Reserve and Quadratic calculations as of 3/ 31/21
Given that hikes are priced in for future years, the curve ’s steepness today is greater than t he curve steepness priced in the future. The forward curve steepness is significantly lower than the steepness today, and we see that as an opportunity for I VOL . What’s priced in? Spot 1 Year Forward 3 Year Forward USD 2s10s Swaps Curve 149 bps 137 bps 56 bps Source: Quadratic as of 3/ 31/21
Remember that IVOL can potentially benefit if the curve continues to steepen , whether that steepness arises from a reduction in market expectations of future hikes as the Fed stays on hold longer, or because long -end rates continue to rise based on recovery expectations. We would expect either scenario to be potentially positive t o IVOL.
For Institutional Investor Use Only. Not for Retail Distribution What role can IVOL play in a portfolio?
We see clients using IVOL primarily for one or more of the following reasons:
Diversification – IVOL offers low correlations to most other major asset classes and may help lower the overall volatility of a portfolio. We have covered this in some detail in previous places.
Completion – Investors should know that t he Bloomberg Barclay’s US Aggregat e Bond Index has no allocation to inflation protection. And roughly 1/3 of “the Agg” is short volatility via its mortgage exposure. Investors relying on the Agg for the totality of their bond exposure are missing a significant part of the market and taking on exposure they may not want. IVOL may help round out an Agg allocation by providing exposure to inflation and inflation expectations, while also providing a long volatility allocation which may potentially hedge some part of the short volatility arising from the Agg.
A Potential H edge for Equities – IVOL owns fixed income volatility and may act as a market hedge since this volatility has historically increased during large equity sell -offs.
Monthly Distributions – Since it began paying distributions in July 2019 , IVOL has distributed a minimum of 30 bps per month. Potential Risks
All investing involves risk, including possible loss of principal. Although diversification does not ensure a profit or guarantee against loss, the objective of a well -balanced portfolio is to help mitigate these risks w ith complementary assets. An informed investor should also understand IVOL’s potential risks, which we discuss further below.
There can be no assurance that the Fund will achieve its stated objectives, including its objective of eliminating the curve or i nflation risk.
IVOL may underperform or lose money when the U.S. interest rate curve flattens or inverts, perhaps significantly. When this occurs the Fund’s investments may generally underperform a portfolio consisting solely of U.S. government bonds.
IVOL’s OTC options may give rise to a form of leverage, which may magnify the Fund’s potential for gain and the risk of loss. The Fund may potentially be more volatile than a portfolio of traditional investments such as stocks or bonds. These options may be subject to liquidity risk and counterparty risk.
The Fund’s use of OTC options is not intended to mitigate credit risk, or non -curve interest rate risk. Additionally, IVOL invests in debt securities, which typically decrease in value when interest rates r ise.
Investing in options tied to the shape of the swap curve is considered speculative and can be extremely volatile. The Fund is non -diversified.
For Institutional Investor Use Only. Not for Retail Distribution This has been a tough year for many. We are grateful for your trust and confidence and hope everyone enjoys a better 2021.
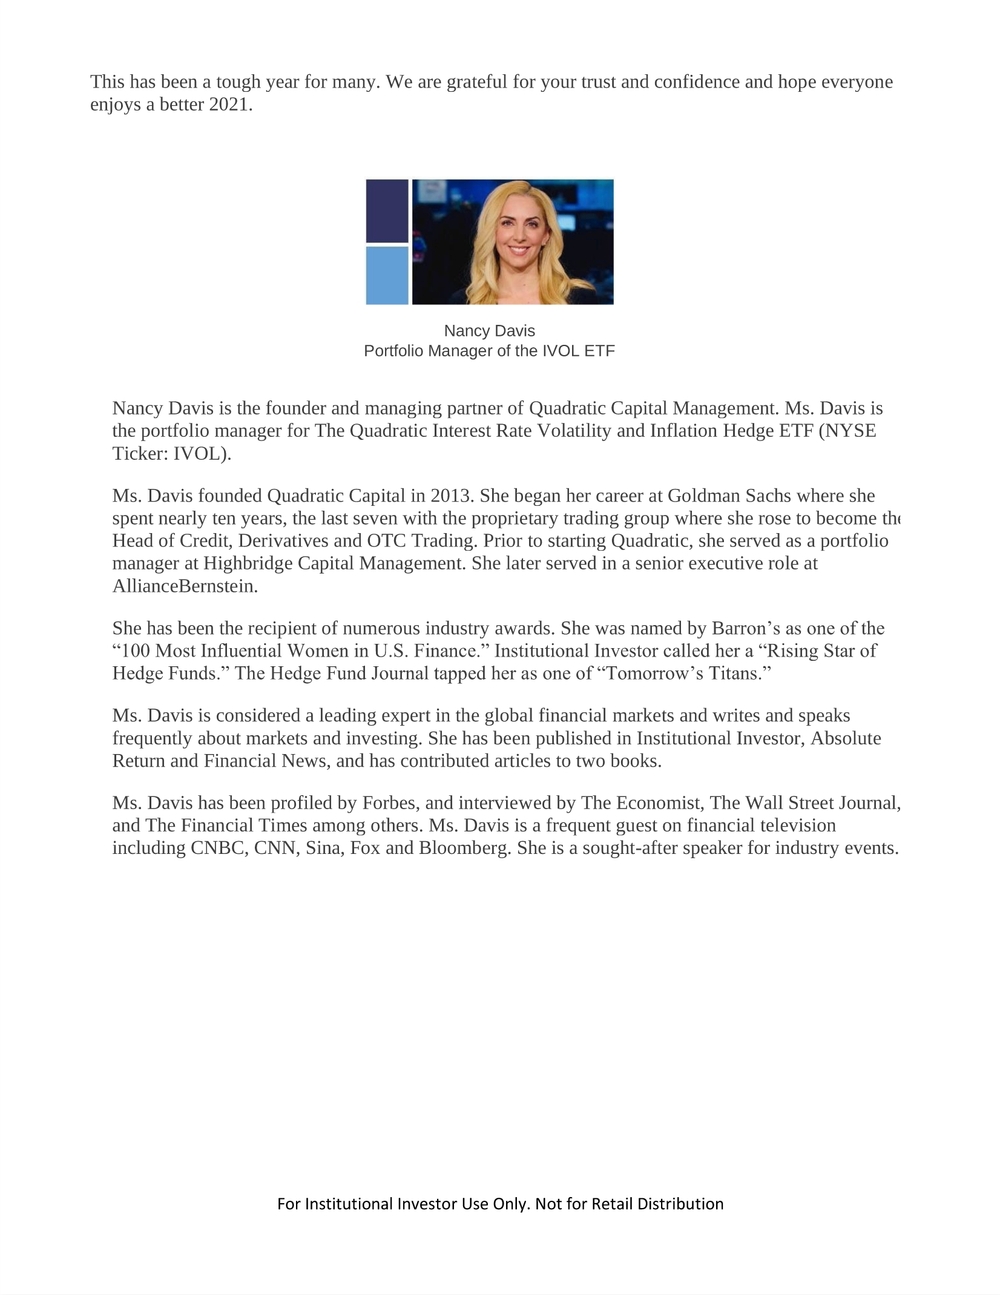
Nancy Davis Portfolio Manager of the IVOL ETF Nancy Davis is the founder and managing partner of Quadratic Capital Management. Ms. Davis is the portfolio manager for The Quadratic Interest Rate Volatility and Inflation Hedge ETF (NYSE Ticker: IVOL). Ms. Davis founded Quadratic Capital in 2013. She began her career at Goldman Sachs where she spent nearly ten years, the last seven with the proprietary trading group where she rose to become the Head of Credit, Derivatives a nd OTC Trading. Prior to starting Quadratic, she served as a portfolio manager at Highbridge Capital Management. She later served in a senior executive role at AllianceBernstein. She has been the recipient of numerous industry awards. She was named by Barr on’s as one of the “100 Most Influential Women in U.S. Finance.” Institutional Investor called her a “Rising Star of Hedge Funds.” The Hedge Fund Journal tapped her as one of “Tomorrow’s Titans.” Ms. Davis is considered a leading expert in the global finan cial markets and writes and speaks frequently about markets and investing. She has been published in Institutional Investor, Absolute Return and Financial News, and has contributed articles to two books. Ms. Davis has been profiled by Forbes, and interview ed by The Economist, The Wall Street Journal, and The Financial Times among others. Ms. Davis is a frequent guest on financial television including CNBC, CNN, Sina, Fox and Bloomberg. She is a sought -after speaker for industry events.
For Institutional Investor Use Only. Not for Retail Distribution 1 - Source: https://www.spglobal.com/_assets/documents/ratings/research/100049468.pdf 2 - Source: https://www.federalreserve.gov/monetarypolicy/2021 -02-mpr-part1.htm
This material contains the portfolio manager’s opinion and should not be regarded as investment advice or recommendation of any specific securities or investment.
The Fund's investment objectives, risks, charges and expenses must be considered carefully before investing. The prospectus contains this and other important information about the company and may be obtained by calling +1 -833-IVOL -ETF. Please read it carefully before investing.
IVOL is distributed by SEI Investments Distribution Co. (SIDCO), 1 Freedom Valley Drive, Oaks, PA 19456. The Fund's sub -adviser is Quadratic Capital Management LLC (Quadrat ic). SIDCO is not affiliated with Quadratic.
Shares of any ETF are bought and sold at market price (not NAV) and are not individually redeemed from the Fund. The returns shown do not represent the returns you would receive if you traded shares at other ti mes. Brokerage commissions will reduce returns beginning 12/23/2020, market price returns are based on the official closing price of an ETF share or, if the official closing price isn't available, the midpoint between the national best bid and national bes t offer ("NBBO") as of the time the ETF calculates current NAV per share. Prior to that date, market price returns were based on the midpoint between the Bid and Ask price. NAVs are calculated using prices as of 4:00 PM Eastern Time.
For Institutional Inv estor Use Only. Not for Retail Distribution.