KraneShares CSI China Internet ETF | KWEB UCITS| China ETF
by Kraneshares
KWEB 30/Jun/2026 The China Consumer E-Commerce Opportunity An Overview of the KraneShares CSI China Internet UCITS ETF (Ticker: KWEB) info@kraneshares.com This is a marketing communication. Please refer to the prospectus of the UCITS, the KIID, and the PRIIP before making any fin al investment decisions. The tax treatment depends on the individual circumstances of each client and may be subject to change in the future.
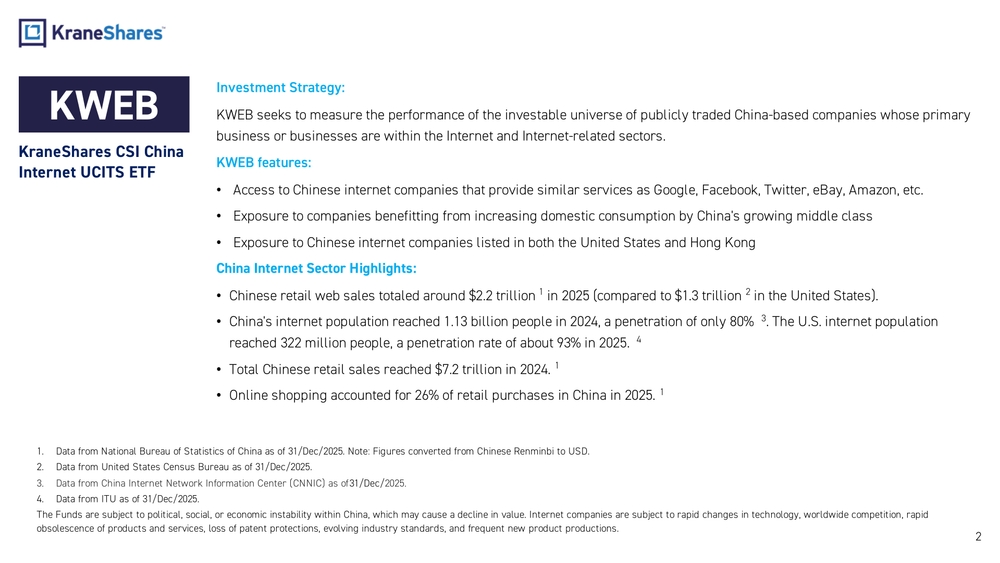
2KWEB KraneShares CSI China Internet UCITS ETFInvestment Strategy: KWEB seeks to measure the performance of the investable universe of publicly traded China -based companies whose primary business or businesses are within the Internet and Internet -related sectors. KWEB features: •Access to Chinese internet companies that provide similar services as Google, Facebook, Twitter, eBay, Amazon, etc. •Exposure to companies benefitting from increasing domestic consumption by China's growing middle class •Exposure to Chinese internet companies listed in both the United States and Hong Kong China Internet Sector Highlights: •Chinese retail web sales totaled around $2.2 trillion1 in 2025 (compared to $1.3 trillion2 in the United States). •China's internet population reached 1.13 billion people in 2024, a penetration of only 80%3. The U.S. internet population reached 322 million people, a penetration rate of about 93% in 2025.4 •Total Chinese retail sales reached $7.2 trillion in 2024 .1 •Online shopping accounted for 26% of retail purchases in China in 2025 .1 1.Data from National Bureau of Statistics of China as of 31/Dec/2025. Note: Figures converted from Chinese Renminbi to USD. 2.Data from United States Census Bureau as of 31/Dec/2025. 3.Data from China Internet Network Information Center (CNNIC) as of 31/Dec/ 2025. 4.Data from ITU as of 31/Dec/2025. The Funds are subject to political, social, or economic instability within China, which may cause a decline in value. Interne t companies are subject to rapid changes in technology, worldwide competition, rapid obsolescence of products and services, loss of patent protections, evolving industry standards, and frequent new product prod uctions.
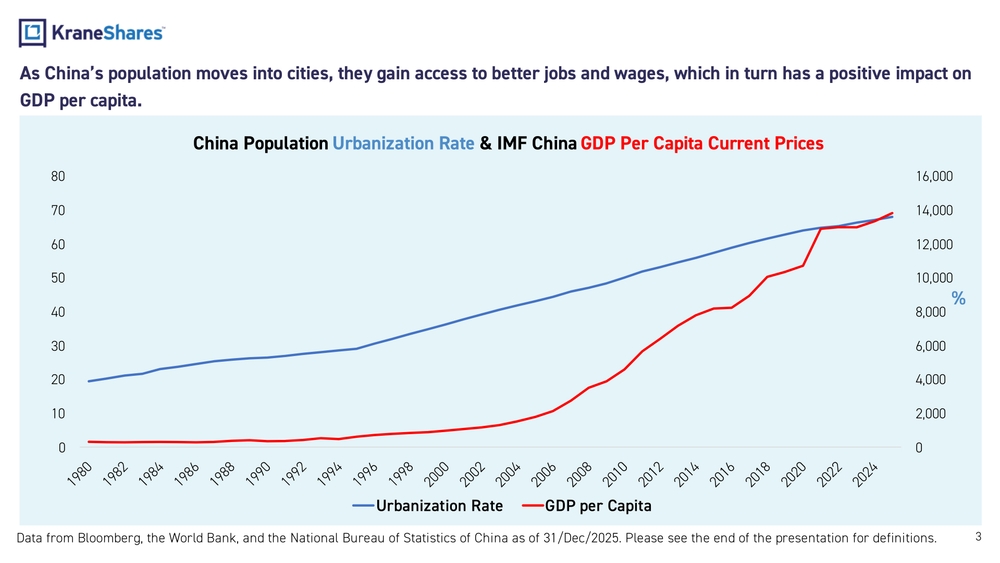
02,0004,0006,0008,00010,00012,00014,00016,000 01020304050607080 Urbanization Rate GDP per Capita 3As China’s population moves into cities, they gain access to better jobs and wages, which in turn has a positive impact on GDP per capita. %China Population Urbanization Rate & IMF China GDP Per Capita Current Prices Data from Bloomberg, the World Bank, and the National Bureau of Statistics of China as of 31/Dec/2025. Please see the end of the presentation for definitions.
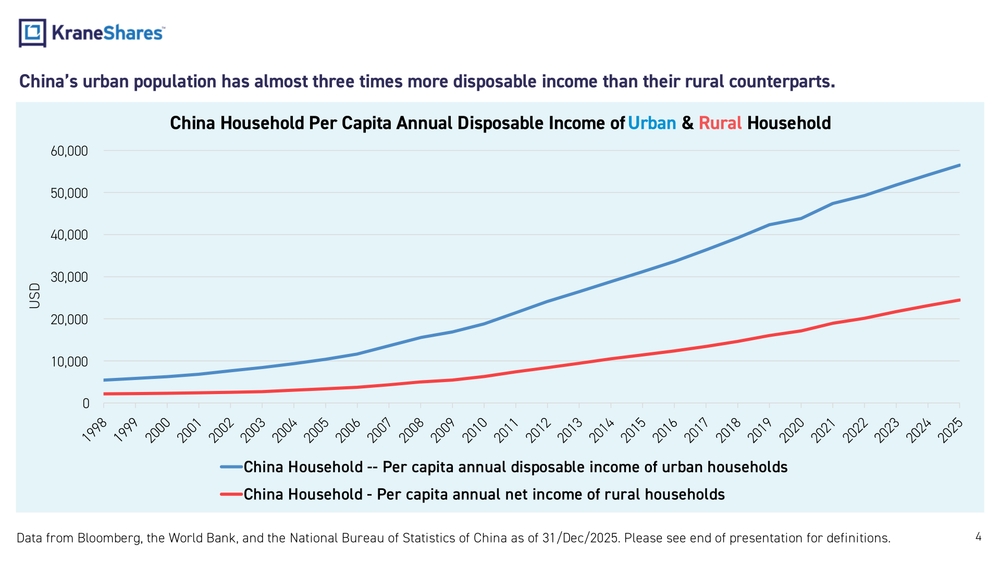
4China’s urban population has almost three times more disposable income than their rural counterparts. Data from Bloomberg, the World Bank, and the National Bureau of Statistics of China as of 31/Dec/2025. Please see end of pres entation for definitions. 010,00020,00030,00040,00050,00060,000USDChina Household Per Capita Annual Disposable Income of Urban & Rural Household China Household -- Per capita annual disposable income of urban households China Household - Per capita annual net income of rural households
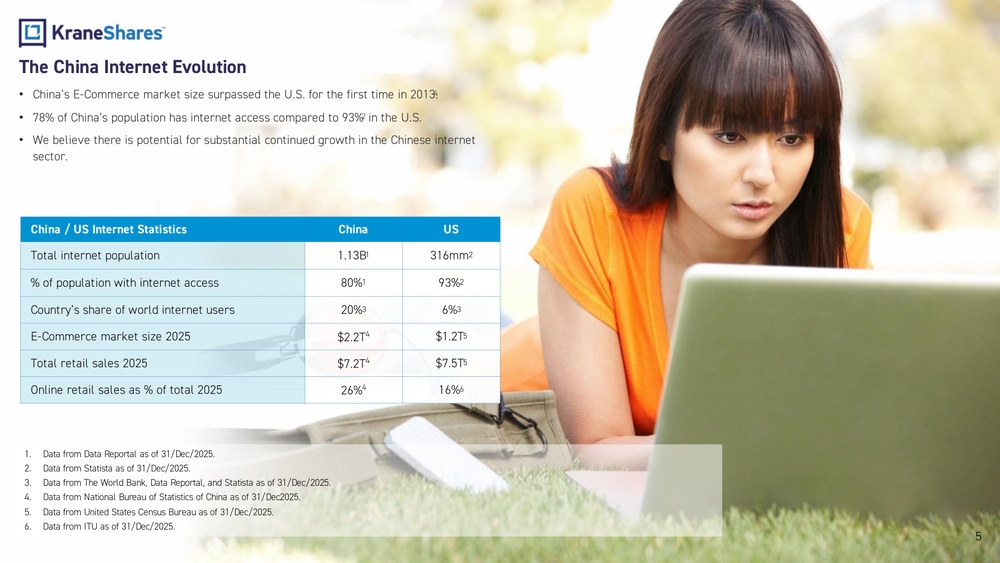
5The China Internet Evolution •China’s E -Commerce market size surpassed the U.S. for the first time in 2013.4 •78% of China’s population has internet access compared to 93%2 in the U.S. •We believe there is potential for substantial continued growth in the Chinese internet sector. China / US Internet Statistics China US Total internet population 1.13B1 316mm2 % of population with internet access 80%1 93%2 Country’s share of world internet users 20%3 6%3 E-Commerce market size 2025 $2.2T4$1.2T5 Total retail sales 2025 $7.2T4$7.5T5 Online retail sales as % of total 2025 26%416%6
- Data from Data Reportal as of 31/Dec/2025.
- Data from Statista as of 31/Dec/2025.
- Data from The World Bank, Data Reportal, and Statista as of 31/Dec/2025.
- Data from National Bureau of Statistics of China as of 31/Dec2025.
- Data from United States Census Bureau as of 31/Dec/2025.
- Data from ITU as of 31/Dec/2025.
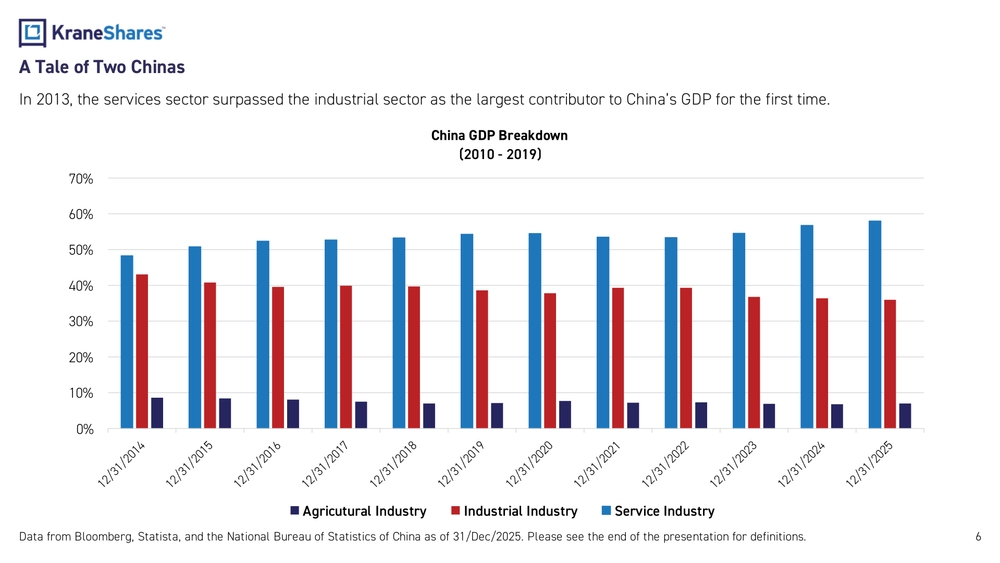
6A Tale of Two Chinas In 2013, the services sector surpassed the industrial sector as the largest contributor to China’s GDP for the first time. Data from Bloomberg, Statista, and the National Bureau of Statistics of China as of 31/Dec/2025. Please see the end of the pr esentation for definitions. 0%10%20%30%40%50%60%70%China GDP Breakdown (2010 - 2019) Agricutural Industry Industrial Industry Service Industry
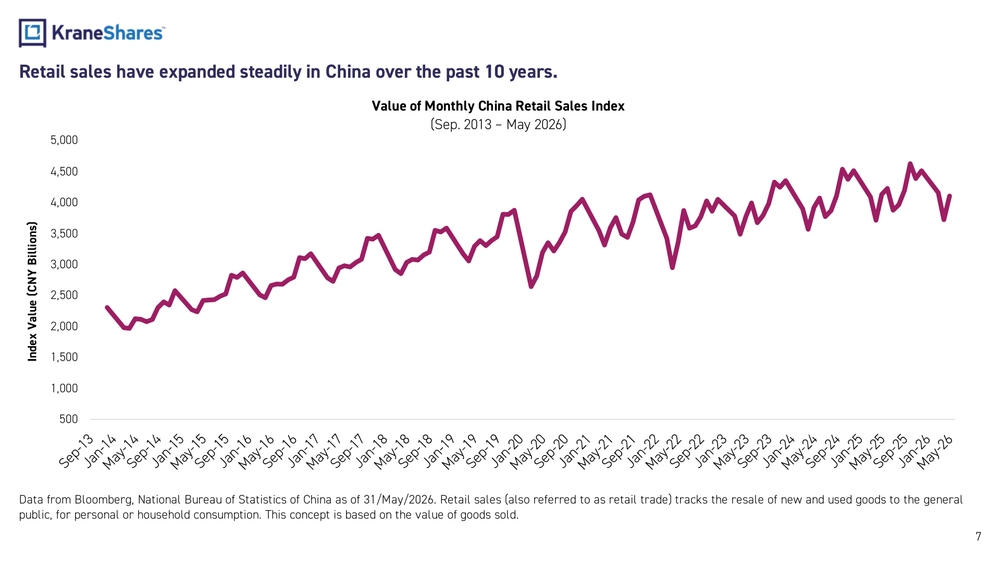
7Retail sales have expanded steadily in China over the past 10 years. Data from Bloomberg, National Bureau of Statistics of China as of 31/May/2026 . Retail sales (also referred to as retail trade) tracks the resale of new and used goods to the general public, for personal or household consumption. This concept is based on the value of goods sold.5001,0001,5002,0002,5003,0003,5004,0004,5005,000Index Value (CNY Billions)Value of Monthly China Retail Sales Index (Sep. 2013 – May 2026)
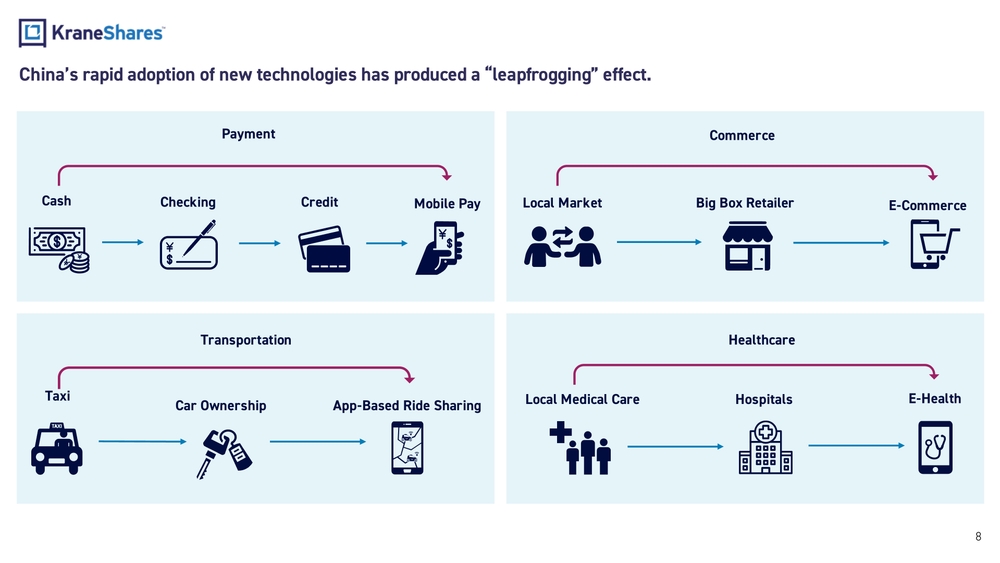
China’s rapid adoption of new technologies has produced a “leapfrogging” effect. Taxi Car Ownership App-Based Ride Sharing Local Market Local Medical Care Hospitals E-Health Big Box Retailer E-Commerce Cash Checking Credit Mobile PayPayment TransportationCommerce Healthcare 8
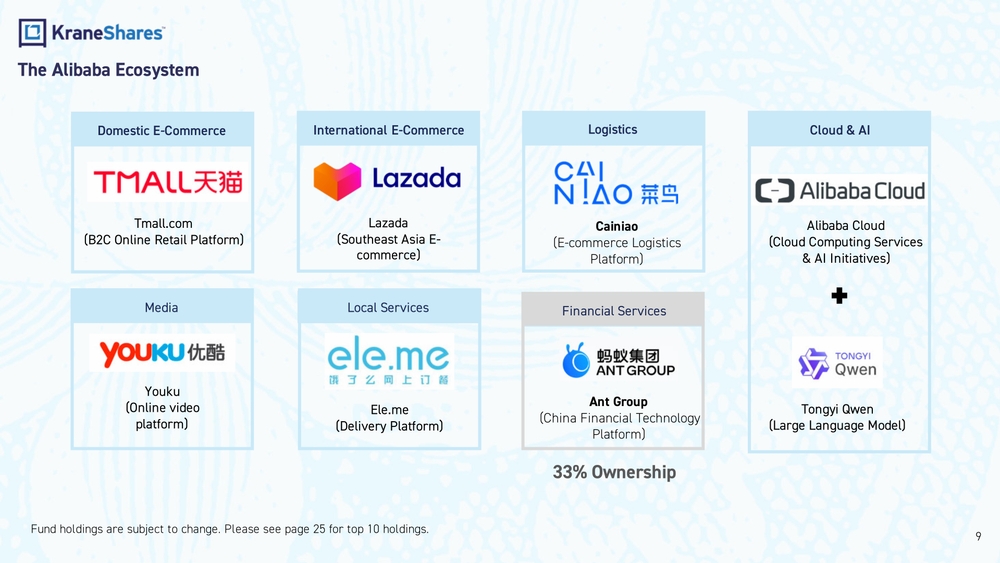
Lazada (Southeast Asia E - commerce) Tmall.com (B2C Online Retail Platform) Alibaba Cloud (Cloud Computing Services & AI Initiatives) Cainiao (E-commerce Logistics Platform)International E -Commerce 9 The Alibaba Ecosystem Local ServicesDomestic E -Commerce Cloud & AI MediaLogistics Ele.me (Delivery Platform)Youku (Online video platform)Ant Group (China Financial Technology Platform)Financial Services 33% Ownership Tongyi Qwen (Large Language Model) Fund holdings are subject to change. Please see page 25 for top 10 holdings.
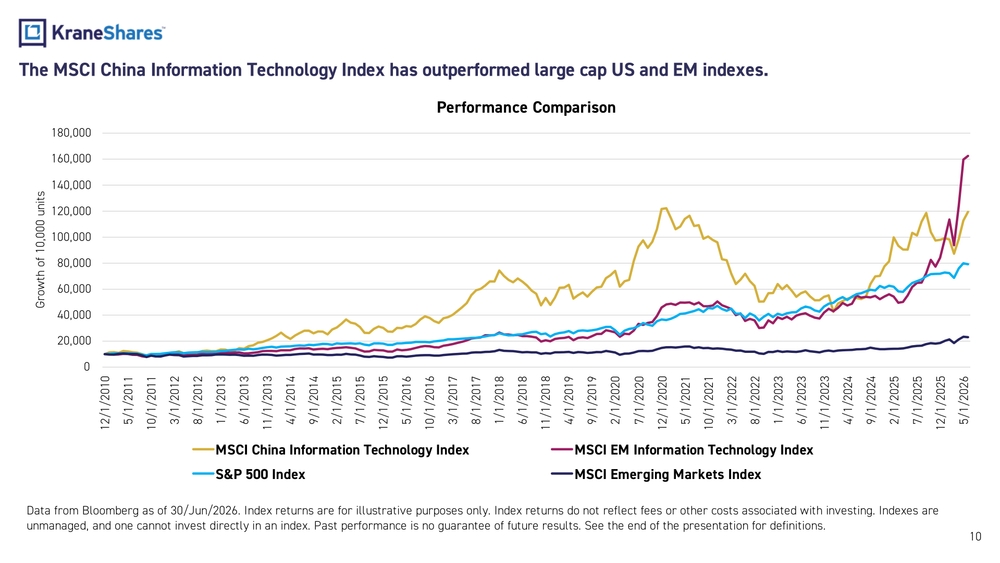
The MSCI China Information Technology Index has outperformed large cap US and EM indexes. Data from Bloomberg as of 30/Jun/2026. Index returns are for illustrative purposes only. Index returns do not reflect fees or other costs associated with investing. Indexes are unmanaged, and one cannot invest directly in an index. Past performance is no guarantee of future results. See the end of the presentation for definitions. 10020,00040,00060,00080,000100,000120,000140,000160,000180,000 12/1/2010 5/1/2011 10/1/2011 3/1/2012 8/1/2012 1/1/2013 6/1/2013 11/1/2013 4/1/2014 9/1/2014 2/1/2015 7/1/2015 12/1/2015 5/1/2016 10/1/2016 3/1/2017 8/1/2017 1/1/2018 6/1/2018 11/1/2018 4/1/2019 9/1/2019 2/1/2020 7/1/2020 12/1/2020 5/1/2021 10/1/2021 3/1/2022 8/1/2022 1/1/2023 6/1/2023 11/1/2023 4/1/2024 9/1/2024 2/1/2025 7/1/2025 12/1/2025 5/1/2026Growth of 10,000 unitsPerformance Comparison MSCI China Information Technology Index MSCI EM Information Technology Index S&P 500 Index MSCI Emerging Markets Index
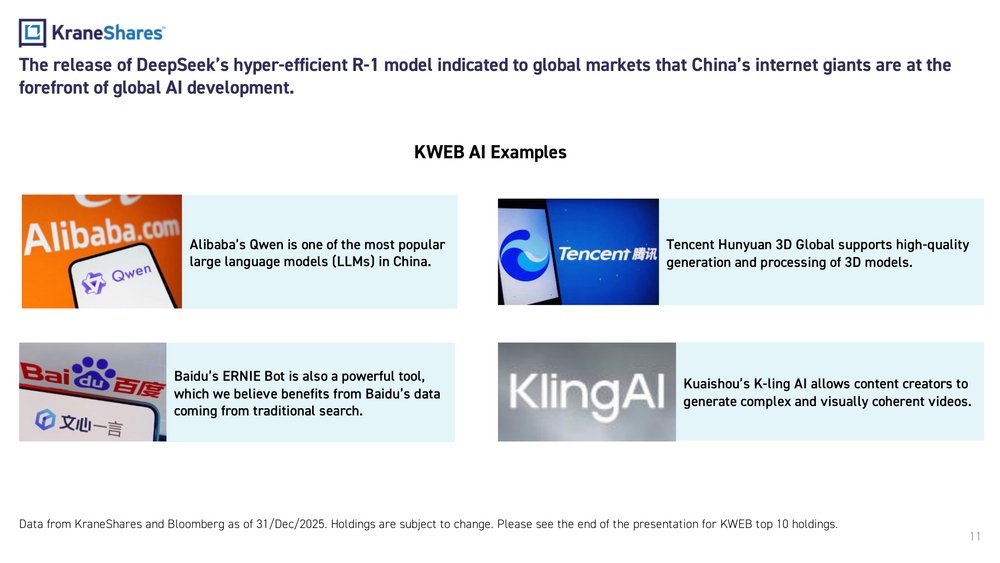
11The release of DeepSeek’s hyper -efficient R -1 model indicated to global markets that China’s internet giants are at the forefront of global AI development. Data from KraneShares and Bloomberg as of 31/Dec/2025. Holdings are subject to change. Please see the end of the presentation for KWEB top 10 holdings.KWEB AI Examples Kuaishou’s K -ling AI allows content creators to generate complex and visually coherent videos. Tencent Hunyuan 3D Global supports high -quality generation and processing of 3D models. Alibaba’s Qwen is one of the most popular large language models (LLMs) in China. Baidu’s ERNIE Bot is also a powerful tool, which we believe benefits from Baidu’s data coming from traditional search.
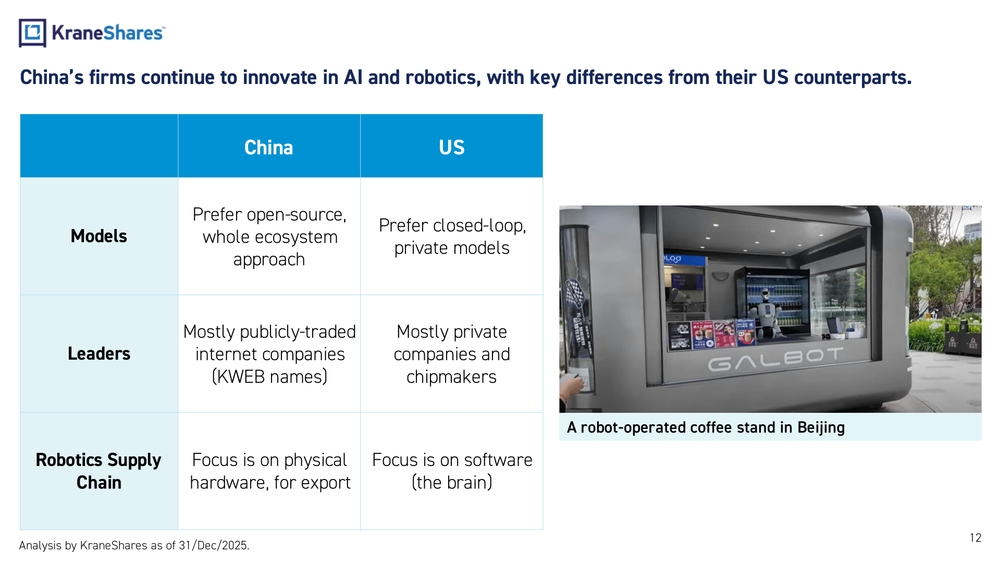
12China’s firms continue to innovate in AI and robotics, with key differences from their US counterparts. China US ModelsPrefer open -source, whole ecosystem approachPrefer closed -loop, private models LeadersMostly publicly -traded internet companies (KWEB names)Mostly private companies and chipmakers Robotics Supply ChainFocus is on physical hardware, for exportFocus is on software (the brain) A robot -operated coffee stand in Beijing Analysis by KraneShares as of 31/Dec/2025.
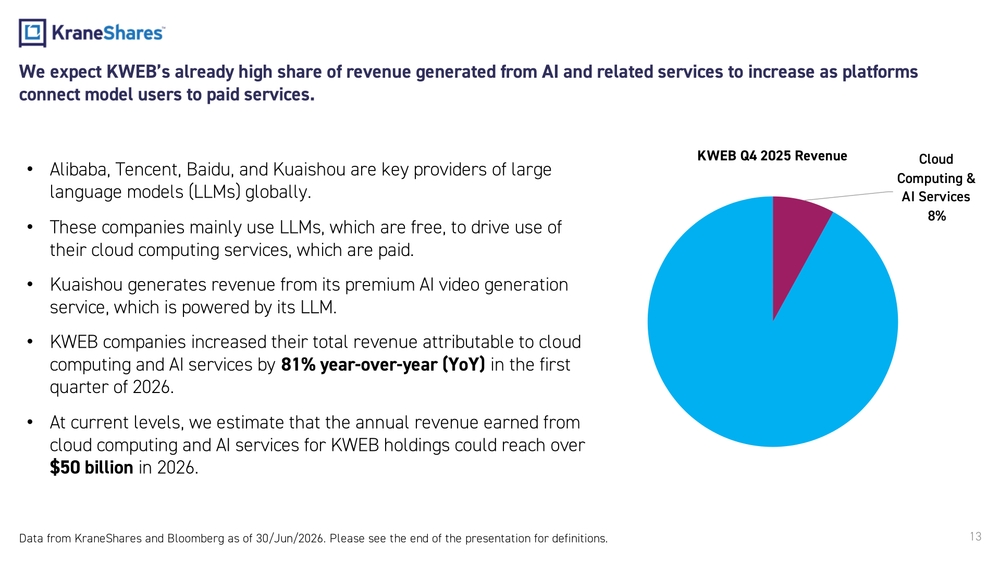
13We expect KWEB’s already high share of revenue generated from AI and related services to increase as platforms connect model users to paid services. Data from KraneShares and Bloomberg as of 30/Jun/2026. Please see the end of the presentation for definitions.Cloud Computing & AI Services 8%KWEB Q4 2025 Revenue •Alibaba, Tencent, Baidu, and Kuaishou are key providers of large language models (LLMs) globally. •These companies mainly use LLMs, which are free, to drive use of their cloud computing services, which are paid. •Kuaishou generates revenue from its premium AI video generation service, which is powered by its LLM. •KWEB companies increased their total revenue attributable to cloud computing and AI services by 81% year -over -year (YoY) in the first quarter of 2026. •At current levels, we estimate that the annual revenue earned from cloud computing and AI services for KWEB holdings could reach over $50 billion in 2026.
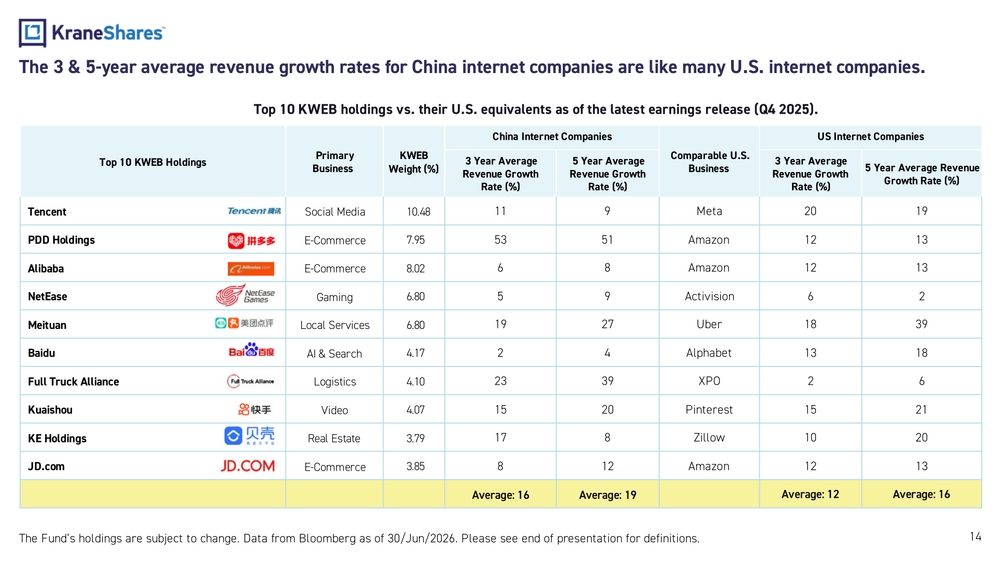
Top 10 KWEB holdings vs. their U.S. equivalents as of the latest earnings release (Q4 2025). The Fund’s holdings are subject to change. Data from Bloomberg as of 30/Jun/2026. Please see end of presentation for definiti ons. 14The 3 & 5 -year average revenue growth rates for China internet companies are like many U.S. internet companies. Top 10 KWEB HoldingsPrimary BusinessKWEB Weight (%)China Internet Companies Comparable U.S. BusinessUS Internet Companies 3 Year Average Revenue Growth Rate (%)5 Year Average Revenue Growth Rate (%)3 Year Average Revenue Growth Rate (%)5 Year Average Revenue Growth Rate (%) Tencent Social Media 10.48 11 9 Meta 20 19 PDD Holdings E-Commerce 7.95 53 51 Amazon 12 13 Alibaba E-Commerce 8.02 6 8 Amazon 12 13 NetEase Gaming 6.80 5 9 Activision 6 2 Meituan Local Services 6.80 19 27 Uber 18 39 Baidu AI & Search 4.17 2 4 Alphabet 13 18 Full Truck Alliance Logistics 4.10 23 39 XPO 2 6 Kuaishou Video 4.07 15 20 Pinterest 15 21 KE Holdings Real Estate 3.79 17 8 Zillow 10 20 JD.com E-Commerce 3.85 8 12 Amazon 12 13 Average: 16 Average: 19 Average: 12 Average: 16
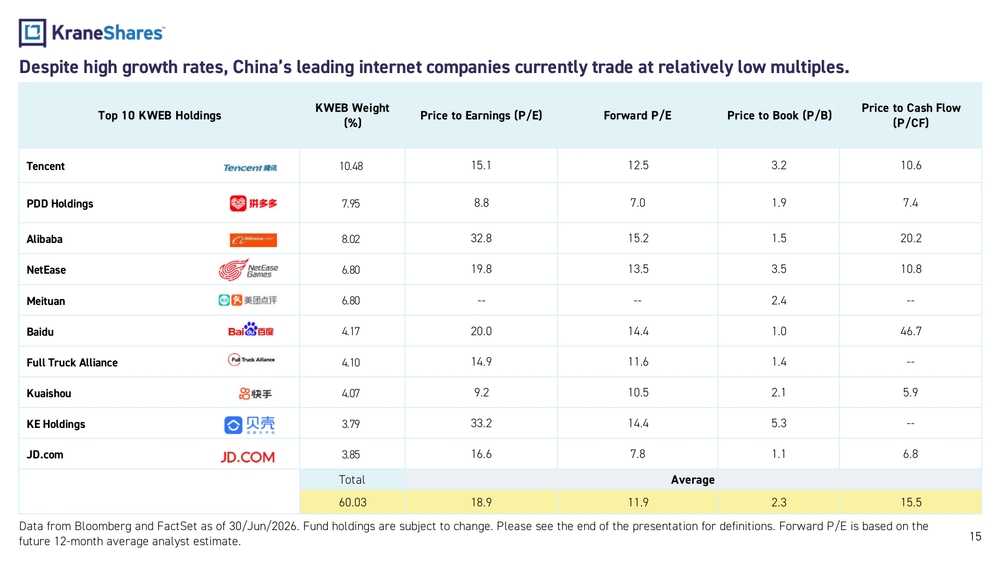
15Despite high growth rates, China’s leading internet companies currently trade at relatively low multiples. Data from Bloomberg and FactSet as of 30/Jun/2026. Fund holdings are subject to change. Please see the end of the presentatio n for definitions. Forward P/E is based on the future 12 -month average analyst estimate.15Top 10 KWEB HoldingsKWEB Weight (%)Price to Earnings (P/E) Forward P/E Price to Book (P/B)Price to Cash Flow (P/CF) Tencent 10.48 15.1 12.5 3.2 10.6 PDD Holdings 7.95 8.8 7.0 1.9 7.4 Alibaba 8.02 32.8 15.2 1.5 20.2 NetEase 6.80 19.8 13.5 3.5 10.8 Meituan 6.80 -- -- 2.4 -- Baidu 4.17 20.0 14.4 1.0 46.7 Full Truck Alliance 4.10 14.9 11.6 1.4 -- Kuaishou 4.07 9.2 10.5 2.1 5.9 KE Holdings 3.79 33.2 14.4 5.3 -- JD.com 3.85 16.6 7.8 1.1 6.8 Total Average 60.03 18.9 11.9 2.3 15.5
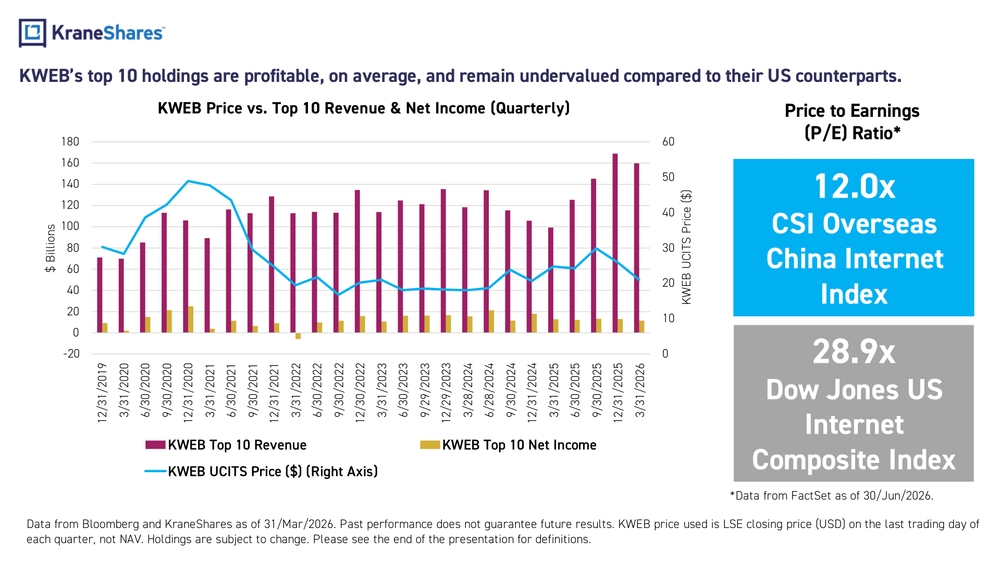
KWEB’s top 10 holdings are profitable, on average, and remain undervalued compared to their US counterparts. Price to Earnings (P/E) Ratio* Data from Bloomberg and KraneShares as of 31/Mar/2026. Past performance does not guarantee future results. KWEB price used is LSE closing price (USD) on the last trading day of each quarter, not NAV. Holdings are subject to change. Please see the end of the presentation for definitions. *Data from FactSet as of 30/Jun/2026.28.9x Dow Jones US Internet Composite Index12.0x CSI Overseas China Internet Index 0102030405060 -20020406080100120140160180 12/31/2019 3/31/2020 6/30/2020 9/30/2020 12/31/2020 3/31/2021 6/30/2021 9/30/2021 12/31/2021 3/31/2022 6/30/2022 9/30/2022 12/30/2022 3/31/2023 6/30/2023 9/29/2023 12/29/2023 3/28/2024 6/28/2024 9/30/2024 12/31/2024 3/31/2025 6/30/2025 9/30/2025 12/31/2025 3/31/2026 KWEB UCITS Price ($)$ BillionsKWEB Price vs. Top 10 Revenue & Net Income (Quarterly) KWEB Top 10 Revenue KWEB Top 10 Net Income KWEB UCITS Price ($) (Right Axis)
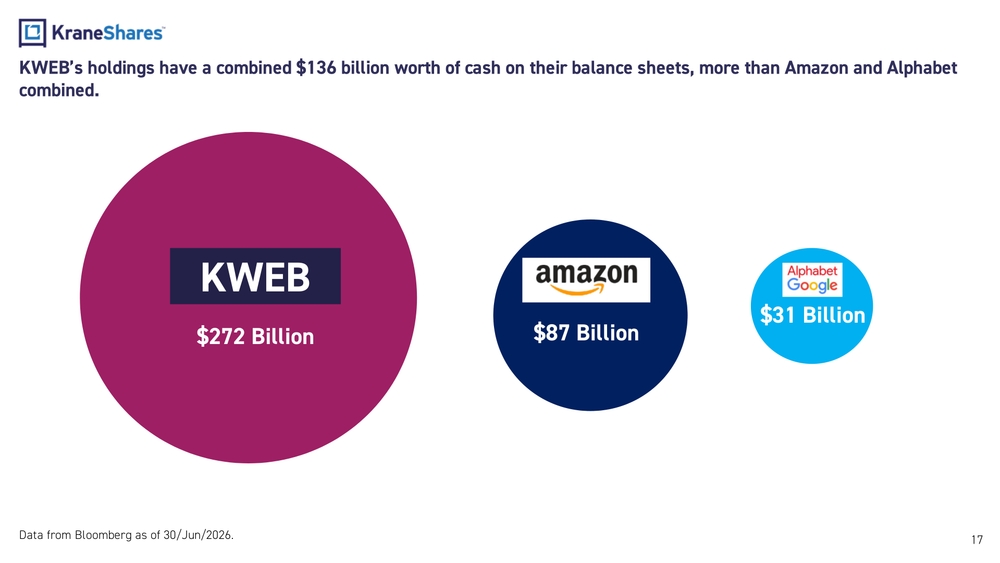
KWEB’s holdings have a combined $136 billion worth of cash on their balance sheets, more than Amazon and Alphabet combined. KWEB Data from Bloomberg as of 30/Jun/2026. 17$272 Billion $87 Billion$31 Billion
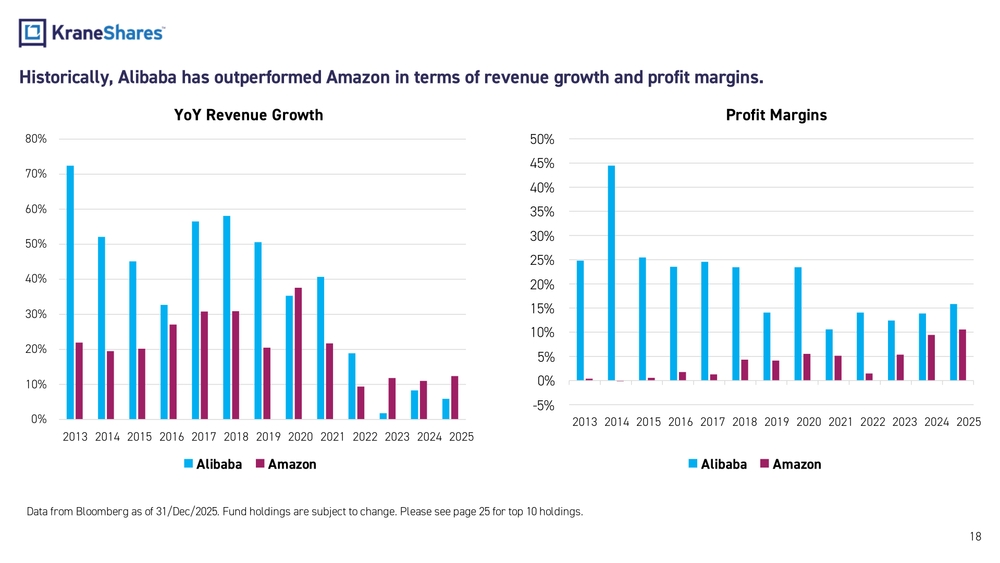
Data from Bloomberg as of 31/Dec/2025. Fund holdings are subject to change. Please see page 25 for top 10 holdings. Historically, Alibaba has outperformed Amazon in terms of revenue growth and profit margins. 180%10%20%30%40%50%60%70%80% 2013 2014 2015 2016 2017 2018 2019 2020 2021 2022 2023 2024 2025YoY Revenue Growth Alibaba Amazon-5%0%5%10%15%20%25%30%35%40%45%50% 2013 2014 2015 2016 2017 2018 2019 2020 2021 2022 2023 2024 2025Profit Margins Alibaba Amazon
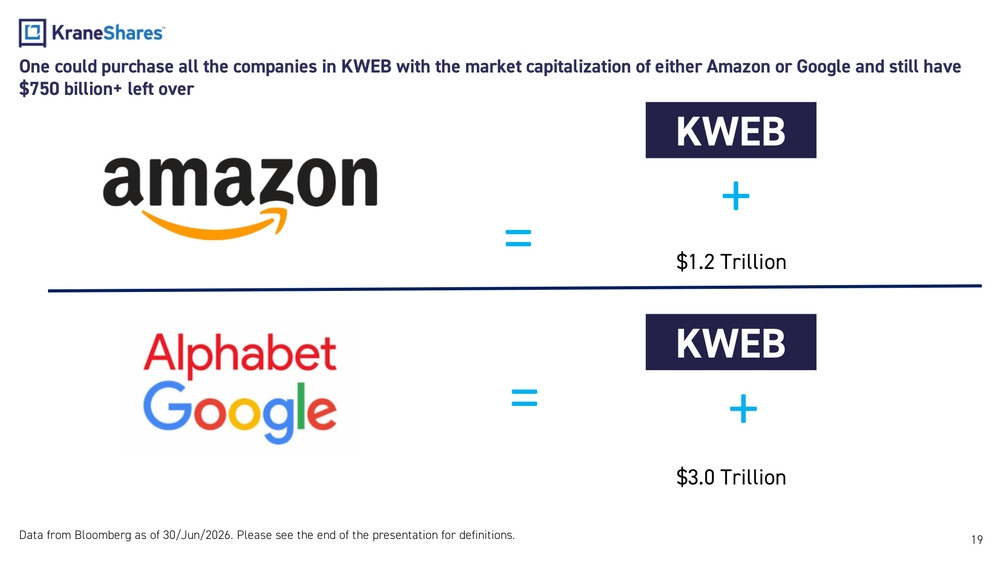
One could purchase all the companies in KWEB with the market capitalization of either Amazon or Google and still have $750 billion+ left over =KWEB + Data from Bloomberg as of 30/Jun/2026. Please see the end of the presentation for definitions. KWEB +
19$1.2 Trillion $3.0 Trillion
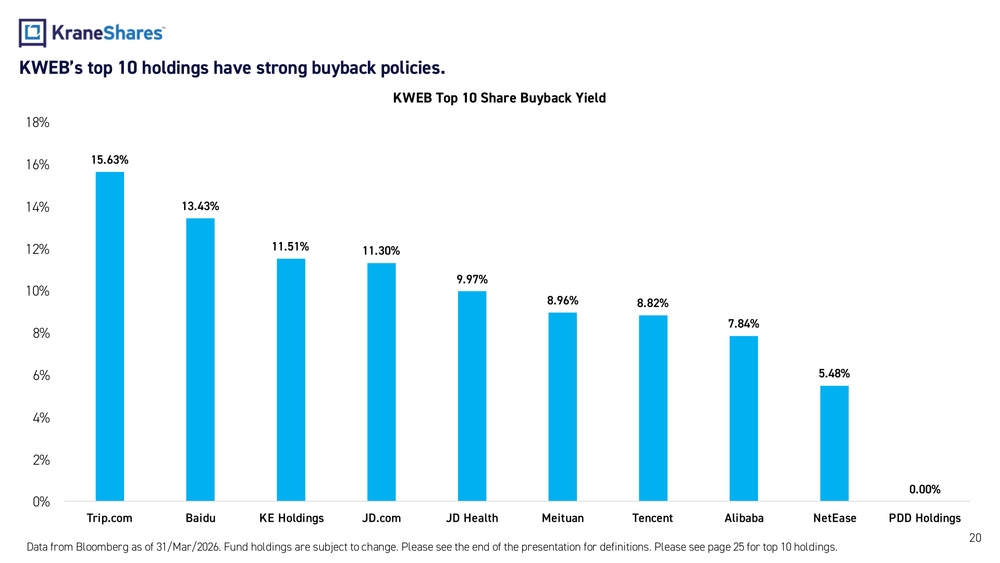
20KWEB’s top 10 holdings have strong buyback policies. Data from Bloomberg as of 31/Mar/2026. Fund holdings are subject to change. Please see the end of the presentation for defini tions. Please see page 25 for top 10 holdings.15.63% 13.43% 11.51%11.30% 9.97% 8.96% 8.82% 7.84% 5.48% 0.00% 0%2%4%6%8%10%12%14%16%18% Trip.com Baidu KE Holdings JD.com JD Health Meituan Tencent Alibaba NetEase PDD HoldingsKWEB Top 10 Share Buyback Yield
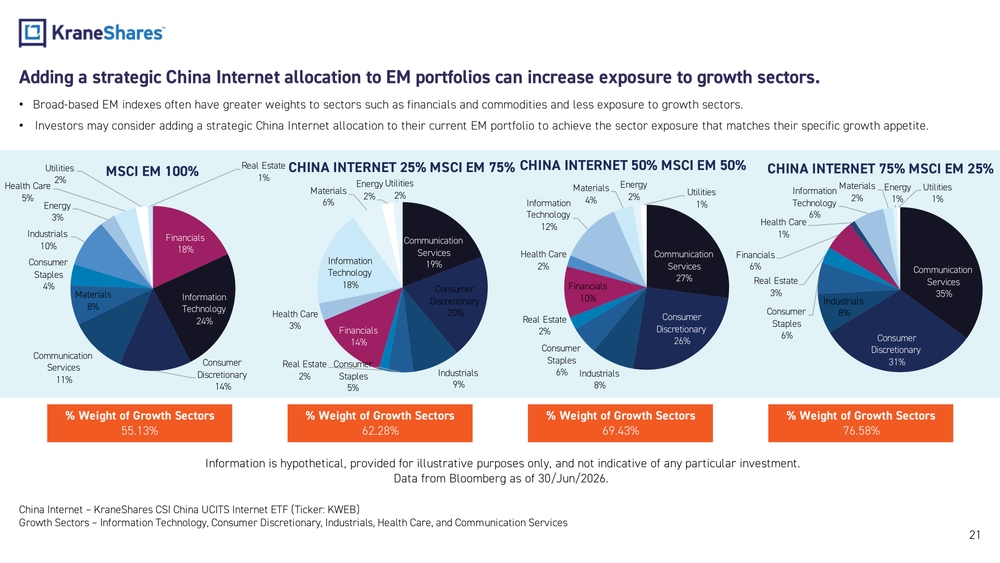
21Adding a strategic China Internet allocation to EM portfolios can increase exposure to growth sectors. •Broad -based EM indexes often have greater weights to sectors such as financials and commodities and less exposure to growth sect ors. • Investors may consider adding a strategic China Internet allocation to their current EM portfolio to achieve the sector expos ure that matches their specific growth appetite. China Internet – KraneShares CSI China UCITS Internet ETF (Ticker: KWEB) Growth Sectors – Information Technology, Consumer Discretionary, Industrials, Health Care, and Communication ServicesInformation is hypothetical, provided for illustrative purposes only, and not indicative of any particular investment. Data from Bloomberg as of 30/Jun/2026. % Weight of Growth Sectors 55.13%% Weight of Growth Sectors 62.28%% Weight of Growth Sectors 69.43%% Weight of Growth Sectors 76.58%Financials 18% Information Technology 24% Consumer Discretionary 14%Communication Services 11%Materials 8%Consumer Staples 4%Industrials 10%Energy 3%Health Care 5%Utilities 2%Real Estate 1%MSCI EM 100% Communication Services 19% Consumer Discretionary 20% Industrials 9%Consumer Staples 5%Real Estate 2%Financials 14%Health Care 3%Information Technology 18%Materials 6%Energy 2%Utilities 2%CHINA INTERNET 25% MSCI EM 75% Communication Services 27% Consumer Discretionary 26% Industrials 8%Consumer Staples 6%Real Estate 2%Financials 10%Health Care 2%Information Technology 12%Materials 4%Energy 2%Utilities 1%CHINA INTERNET 50% MSCI EM 50% Communication Services 35% Consumer Discretionary 31%Industrials 8% Consumer Staples 6%Real Estate 3%Financials 6%Health Care 1%Information Technology 6%Materials 2%Energy 1%Utilities 1%CHINA INTERNET 75% MSCI EM 25%
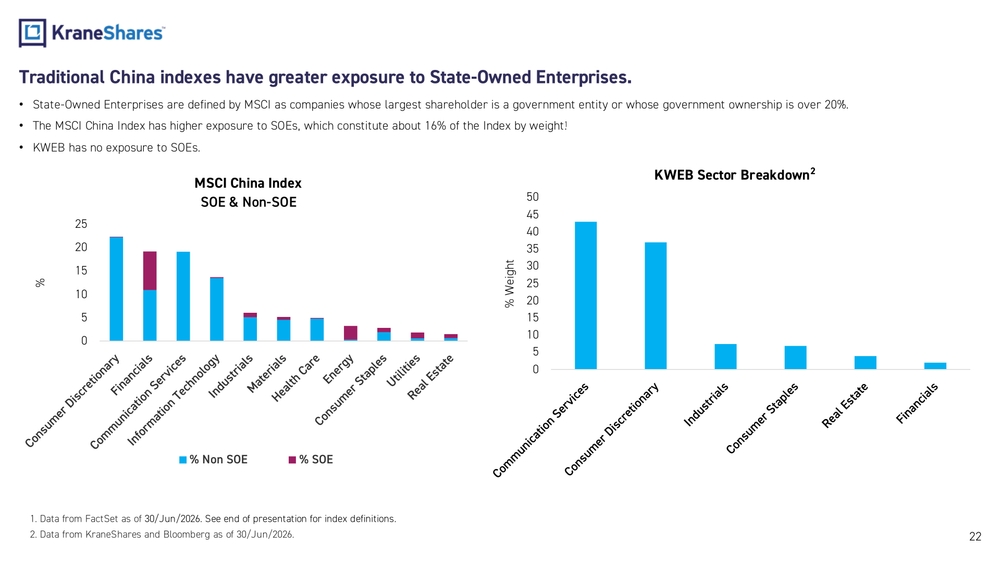
22Traditional China indexes have greater exposure to State -Owned Enterprises. •State -Owned Enterprises are defined by MSCI as companies whose largest shareholder is a government entity or whose government ow nership is over 20%.1 •The MSCI China Index has higher exposure to SOEs, which constitute about 16% of the Index by weight.1 •KWEB has no exposure to SOEs.
- Data from FactSet as of 30/Jun/2026. See end of presentation for index definitions.
- Data from KraneShares and Bloomberg as of 30/Jun/2026.05101520253035404550% WeightKWEB Sector Breakdown2 0510152025%MSCI China Index SOE & Non -SOE % Non SOE % SOE
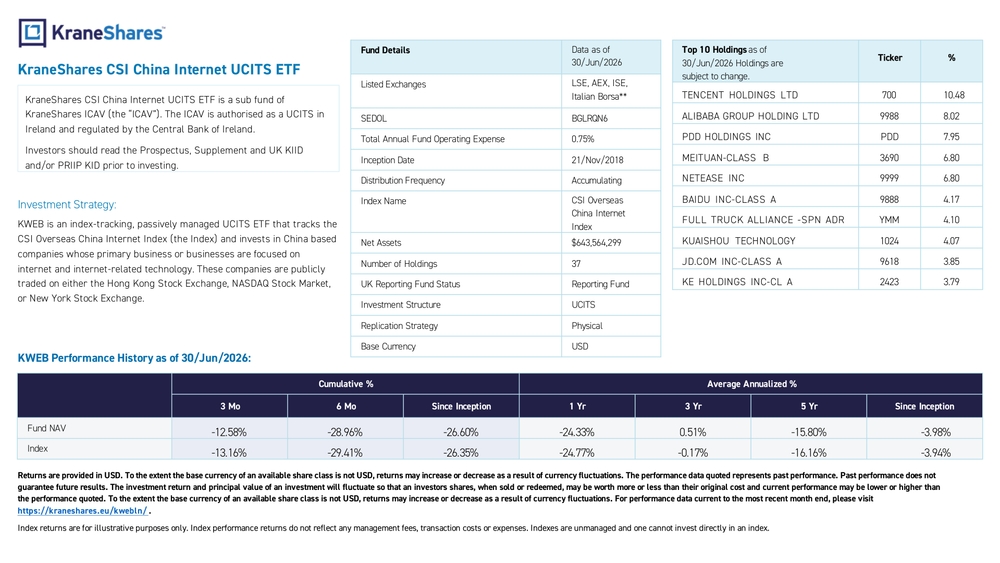
KraneShares CSIChina Internet UCITS ETF KraneShares CSIChina Internet UCITS ETFisasubfund of KraneShares ICAV (the“ICAV”). TheICAV isauthorised asaUCITS in Ireland andregulated bytheCentral Bank ofIreland. Investors should read theProspectus, Supplement andUKKIID and/or PRIIP KIDprior toinvesting. Investment Strategy: KWEB isanindex -tracking, passively managed UCITS ETFthattracks the CSIOverseas China Internet Index (theIndex) andinvests inChina based companies whose primary business orbusinesses arefocused on internet andinternet -related technology. These companies arepublicly traded oneither theHong Kong Stock Exchange, NASDAQ Stock Market, orNew York Stock Exchange.Fund Details Data as of 30/Jun/2026 Listed Exchanges LSE, AEX, ISE, Italian Borsa** SEDOL BGLRQN6 Total Annual Fund Operating Expense 0.75% Inception Date 21/Nov/2018 Distribution Frequency Accumulating Index Name CSIOverseas China Internet Index Net Assets $643,564,299 Number ofHoldings 37 UKReporting Fund Status Reporting Fund Investment Structure UCITS Replication Strategy Physical Base Currency USDTop10Holdings asof 30/Jun/202 6Holdings are subject tochange.Ticker % TENCENT HOLDINGS LTD 700 10.48 ALIBABA GROUP HOLDING LTD 9988 8.02 PDD HOLDINGS INC PDD 7.95 MEITUAN -CLASS B 3690 6.80 NETEASE INC 9999 6.80 BAIDU INC-CLASS A 9888 4.17 FULL TRUCK ALLIANCE -SPN ADR YMM 4.10 KUAISHOU TECHNOLOGY 1024 4.07 JD.COM INC-CLASS A 9618 3.85 KEHOLDINGS INC-CLA 2423 3.79 KWEB Performance History asof30/Jun/202 6: Cumulative % Average Annualized % 3Mo 6Mo Since Inception 1Yr 3Yr 5Yr Since Inception Fund NAV-12.58% -28.96% -26.60% -24.33% 0.51% -15.80% -3.98% Index-13.16% -29.41% -26.35% -24.77% -0.17% -16.16% -3.94% Returns are provided in USD. To the extent the base currency of an available share class is not USD, returns may increase or decrease as a result of currency fluctuations. The performance data quoted represents past performance. Past performance does not guarantee future results. The investment return and principal value of an investment will fluctuate so that an investors shares, when sold or redeemed, may be worth more or less than their original cost and current performance may be lower or higher than the performance quoted. To the extent the base currency of an available share class is not USD, returns may increase or decrease as a result of currency fluctuations. For performance data current to the most recent month end, please visit https://kraneshares.eu/kwebln/ . Index returns areforillustrative purposes only. Index performance returns donotreflect anymanagement fees, transaction costs orexpenses. Indexes areunmanaged andonecannot invest directly inanindex.
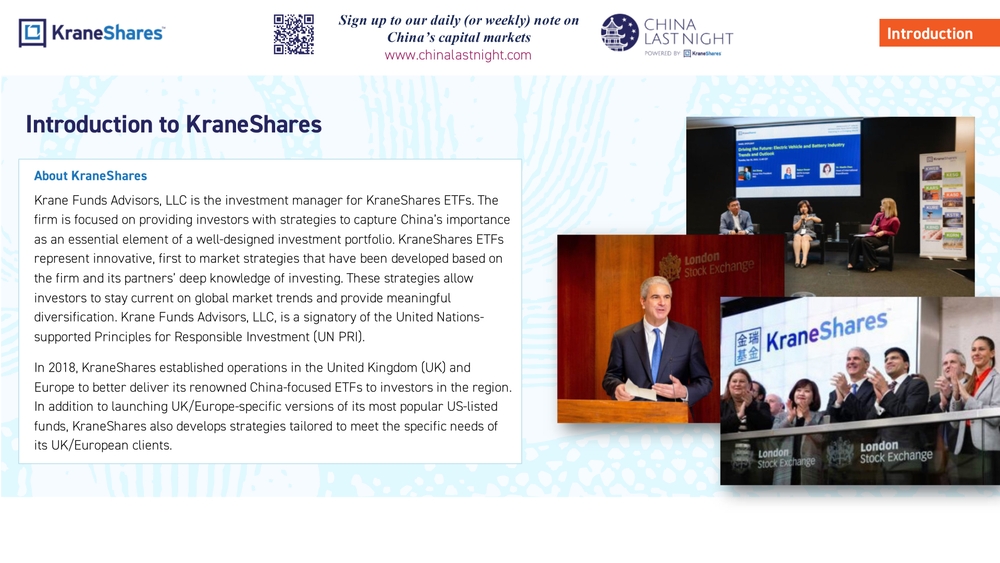
Introduction to KraneShares About KraneShares Krane Funds Advisors, LLC is the investment manager for KraneShares ETFs. The firm is focused on providing investors with strategies to capture China’s importance as an essential element of a well -designed investment portfolio. KraneShares ETFs represent innovative, first to market strategies that have been developed based on the firm and its partners’ deep knowledge of investing. These strategies allow investors to stay current on global market trends and provide meaningful diversification. Krane Funds Advisors, LLC, is a signatory of the United Nations - supported Principles for Responsible Investment (UN PRI). In 2018, KraneShares established operations in the United Kingdom (UK) and Europe to better deliver its renowned China -focused ETFs to investors in the region. In addition to launching UK/Europe -specific versions of its most popular US -listed funds, KraneShares also develops strategies tailored to meet the specific needs of its UK/European clients. Introduction Sign up to our daily (or weekly) note on China’s capital markets www.chinalastnight.com
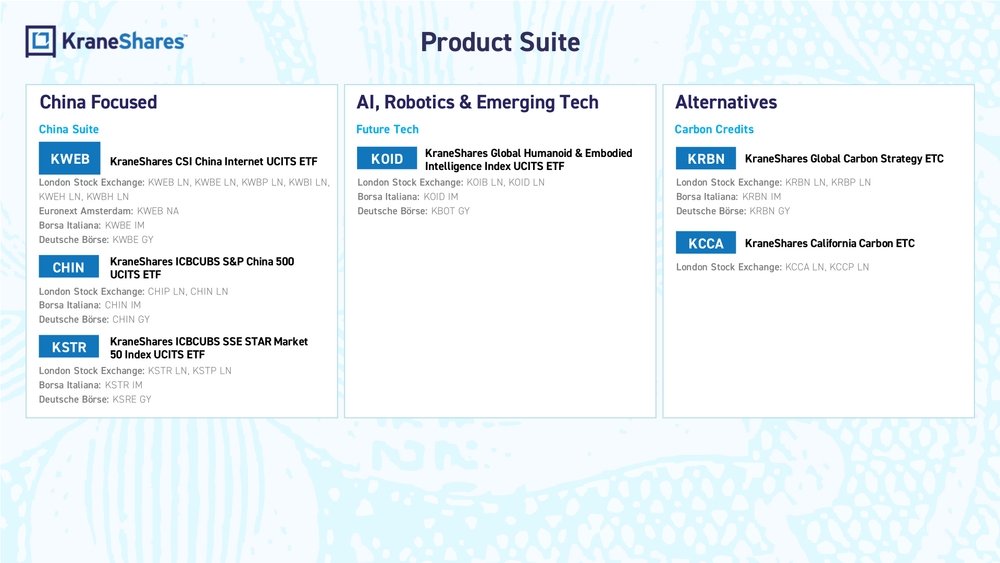
China Focused Alternatives AI, Robotics & Emerging Tech China Suite Future Tech Carbon CreditsProduct Suite KWEB KraneShares CSI China Internet UCITS ETF London Stock Exchange: KWEB LN, KWBE LN, KWBP LN, KWBI LN, KWEH LN, KWBH LN Euronext Amsterdam: KWEB NA Borsa Italiana: KWBE IM Deutsche Börse: KWBE GY London Stock Exchange: CHIP LN, CHIN LN Borsa Italiana: CHIN IM Deutsche Börse: CHIN GYKraneShares ICBCUBS S&P China 500 UCITS ETFCHIN KSTRKraneShares ICBCUBS SSE STAR Market 50 Index UCITS ETF London Stock Exchange: KSTR LN, KSTP LN Borsa Italiana: KSTR IM Deutsche Börse: KSRE GYKOIDKraneShares Global Humanoid & Embodied Intelligence Index UCITS ETF London Stock Exchange: KOIB LN, KOID LN Borsa Italiana: KOID IM Deutsche Börse: KBOT GYKraneShares Global Carbon Strategy ETC KRBN London Stock Exchange: KRBN LN, KRBP LN Borsa Italiana: KRBN IM Deutsche Börse: KRBN GY KCCA KraneShares California Carbon ETC London Stock Exchange: KCCA LN, KCCP LN
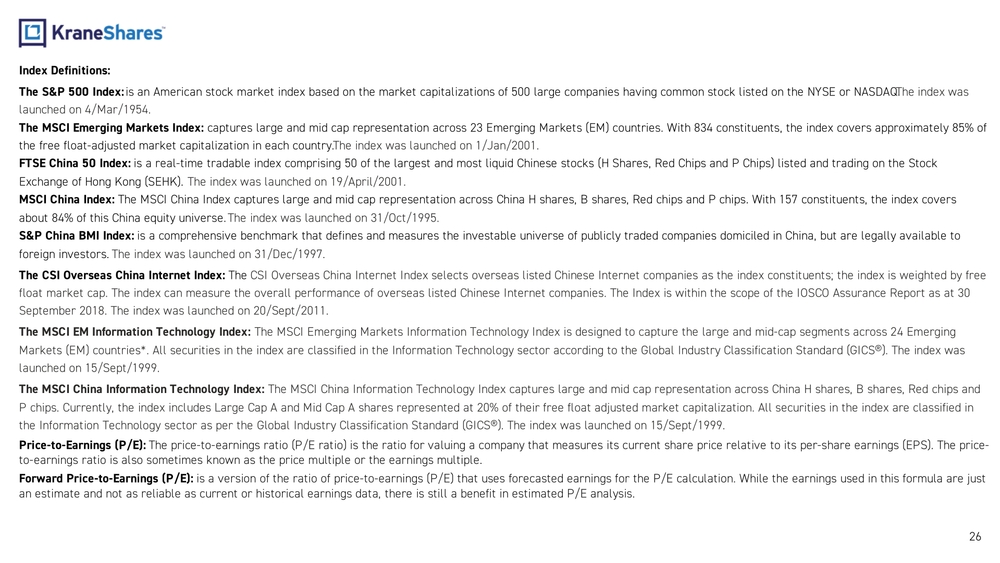
26Index Definitions: The S&P 500 Index: is an American stock market index based on the market capitalizations of 500 large companies having common stock listed on th e NYSE or NASDAQ. The index was launched on 4/Mar/ 1954. The MSCI Emerging Markets Index: captures large and mid cap representation across 23 Emerging Markets (EM) countries. With 834 constituents, the index covers approximately 85% of the free float -adjusted market capitalization in each country. The index was launched on 1/Jan/2001. FTSE China 50 Index: is a real -time tradable index comprising 50 of the largest and most liquid Chinese stocks (H Shares, Red Chips and P Chips) list ed and trading on the Stock Exchange of Hong Kong (SEHK). The index was launched on 19/April/ 2001. MSCI China Index: The MSCI China Index captures large and mid cap representation across China H shares, B shares, Red chips and P chips. With 157 constituents, the index covers about 84% of this China equity universe. The index was launched on 31/Oct/ 1995. S&P China BMI Index: is a comprehensive benchmark that defines and measures the investable universe of publicly traded companies domiciled in Chin a, but are legally available to foreign investors. The index was launched on 31/Dec/ 1997. The CSI Overseas China Internet Index: The CSI Overseas China Internet Index selects overseas listed Chinese Internet companies as the index constituents; the index is weighted by free float market cap. The index can measure the overall performance of overseas listed Chinese Internet companies. The Index is w ithin the scope of the IOSCO Assurance Report as at 30 September 2018. The index was launched on 20/Sept/2011. The MSCI EM Information Technology Index: The MSCI Emerging Markets Information Technology Index is designed to capture the large and mid -cap segments across 24 Emerging Markets (EM) countries*. All securities in the index are classified in the Information Technology sector according to the Glo bal Industry Classification Standard (GICS®). The index was launched on 15/Sept/ 1999. The MSCI China Information Technology Index: The MSCI China Information Technology Index captures large and mid cap representation across China H shares, B shares, Red chips and P chips. Currently, the index includes Large Cap A and Mid Cap A shares represented at 20% of their free float adjusted marke t capitalization. All securities in the index are classified in the Information Technology sector as per the Global Industry Classification Standard (GICS®). The index was launched on 15/Sept/1999. Price -to-Earnings (P/E): The price -to-earnings ratio (P/E ratio) is the ratio for valuing a company that measures its current share price relative to its per-share earnings (EPS). The price - to-earnings ratio is also sometimes known as the price multiple or the earnings multiple. Forward Price -to-Earnings (P/E): is a version of the ratio of price -to-earnings (P/E) that uses forecasted earnings for the P/E calculation. While the earnings u sed in this formula are just an estimate and not as reliable as current or historical earnings data, there is still a benefit in estimated P/E analysis.
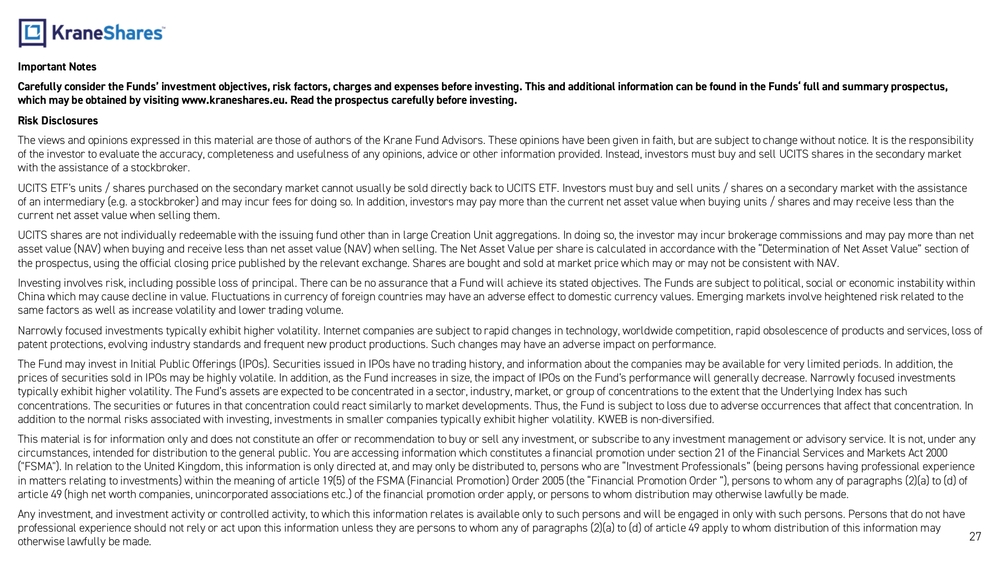
27Important Notes Carefully consider the Funds’ investment objectives, risk factors, charges and expenses before investing. This and additional information can be found in the Funds‘ full and summary prospectus, which may be obtained by visiting www.kraneshares.eu. Read the prospectus carefully before investing. Risk Disclosures The views and opinions expressed in this material are those of authors of the Krane Fund Advisors. These opinions have been g iven in faith, but are subject to change without notice. It is the responsibility of the investor to evaluate the accuracy, completeness and usefulness of any opinions, advice or other information provided. Instead, investors must buy and sell UCITS shares in the secondary market with the assistance of a stockbroker. UCITS ETF’s units / shares purchased on the secondary market cannot usually be sold directly back to UCITS ETF. Investors mus t buy and sell units / shares on a secondary market with the assistance of an intermediary (e.g. a stockbroker) and may incur fees for doing so. In addition, investors may pay more than the current net asset value when buying units / shares and may receive less than the current net asset value when selling them. UCITS shares are not individually redeemable with the issuing fund other than in large Creation Unit aggregations. In doing s o, the investor may incur brokerage commissions and may pay more than net asset value (NAV) when buying and receive less than net asset value (NAV) when selling. The Net Asset Value per share is calc ulated in accordance with the “Determination of Net Asset Value” section of the prospectus, using the official closing price published by the relevant exchange. Shares are bought and sold at market pri ce which may or may not be consistent with NAV. Investing involves risk, including possible loss of principal. There can be no assurance that a Fund will achieve its stated objectives. The Funds are subject to political, social or economic instability within China which may cause decline in value. Fluctuations in currency of foreign countries may have an adverse effect to domestic currency values. Emerging markets involve heightened risk related to the same factors as well as increase volatility and lower trading volume. Narrowly focused investments typically exhibit higher volatility. Internet companies are subject to rapid changes in technolo gy, worldwide competition, rapid obsolescence of products and services, loss of patent protections, evolving industry standards and frequent new product productions. Such changes may have an adverse impact on performance. TheFund may invest in Initial Public Offerings (IPOs). Securities issued in IPOs have no trading history, and information about the companies may be available for very limited periods. In addition, the prices of securities sold in IPOs may be highly volatile. In addition, as the Fund increases in size, the impact of IPOs on t he Fund’s performance will generally decrease. Narrowly focused investments typically exhibit higher volatility. The Fund’s assets are expected to be concentrated in a sector, industry, market, or grou p of concentrations to the extent that the Underlying Index has such concentrations. The securities or futures in that concentration could react similarly to market developments. Thus, the Fund is subject to loss due to adverse occurrences that affect that concentration. In addition to the normal risks associated with investing, investments in smaller companies typically exhibit higher volatility. KWEB is non -diversified. This material is for information only and does not constitute an offer or recommendation to buy or sell any investment, or su bscribe to any investment management or advisory service. It is not, under any circumstances, intended for distribution to the general public. You are accessing information which constitutes a financial p romotion under section 21 of the Financial Services and Markets Act 2000 ("FSMA"). In relation to the United Kingdom, this information is only directed at, and may only be distributed to, persons wh o are “Investment Professionals” (being persons having professional experience in matters relating to investments) within the meaning of article 19(5) of the FSMA (Financial Promotion) Order 2005 (the “Fi nancial Promotion Order ”), persons to whom any of paragraphs (2)(a) to (d) of article 49 (high net worth companies, unincorporated associations etc.) of the financial promotion order apply, or persons to whom distribution may otherwise lawfully be made. Any investment, and investment activity or controlled activity, to which this information relates is available only to such p ersons and will be engaged in only with such persons. Persons that do not have professional experience should not rely or act upon this information unless they are persons to whom any of paragraphs (2)(a) to (d) of article 49 apply to whom distribution of this information may otherwise lawfully be made.
28Risk Disclosures Continued:
In Switzerland, the Fund has appointed as Swiss Representative Waystone Fund Services (Switzerland) SA, Av. Villamont 17, 1005 Lausanne, Switzerland, Tel: +41 21 311 17 77, email:
switzerland@waystone.com. The Fund’s paying agent is Helvetische Bank AG. In respect of the Shares distributed in or from Switzerland, the place of performance and jurisdiction is Lausanne
(Switzerland).
Although the information provided in this document has been obtained from sources which Krane Funds Advisors, LLC believes to be reliable, it does not guarantee accuracy of such information and such
information may be incomplete or condensed. Krane Fund Advisors, LLC is appointed to act as investment manager in accordance with the requirements of the Central Bank. Krane Fund Advisors, LLC is
appointed as the distributor of the ICAV. The Management Company may decide to terminate the agreements made for the marketin g of the Fund in accordance with Article 93a of Directive 2009/65/EC.
KIID and PRIIP documents are available in the language of any Member State where such fund is distributed and the prospectus is available only in English. For additional fund documentation, please visit
www.waystone.com or www.kraneshares.eu . To view our Summary of Investor Rights, available only in English, please visit www.kraneshares.eu or click here . The Fund’s indicative net asset value iNAV
can be obtained during trading hours at https://www.londonstockexchange.com/stock/kweb/kraneshares -icav/company -page .
R_EU_KS