China ETF | KURE : Exposure to China’s Health Care Tech
by Kraneshares
info@kraneshares.comChina Healthcare: Potential Opportunities From One Of The Fastest Growing Major Global Healthcare Markets1 An Overview of the KraneShares MSCI All China Healthcare Index ETF (Ticker: KURE)KURE 6/30/2026
- Based on the expected growth rate of health spending in China using data as of 12/31/2025 from the Pew Research Center and OECD, and compiled by KraneShares. 1
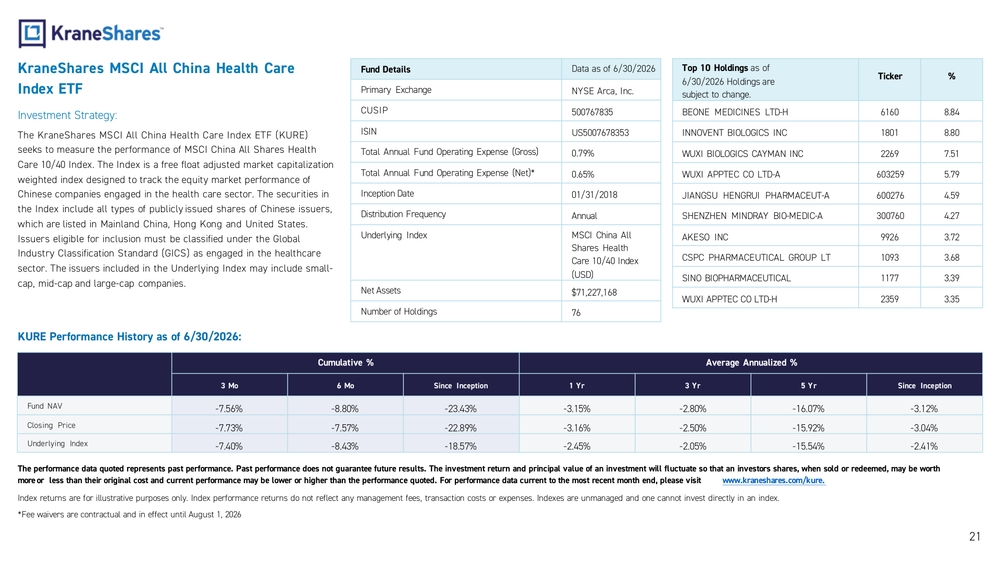
2Investment Strategy: KURE seeks to measure the performance of the MSCI China All Shares Healthcare 10/40 Index. The Index is a free float -adjusted ma rket capitalization -weighted index designed to track the equity market performance of Chinese companies engaged in the healthcare sec tor. The securities in the Index include all types of publicly issued shares of Chinese issuers, which are listed in Mainland China, H ong Kong, and the United States. Issuers eligible for inclusion must be classified under the Global Industry Classification Standard (GICS) as engaged in the healthcare sector. The issuers included in the Underlying Index may include small -cap, mid -cap, and large -cap companies. China Healthcare Sector Highlights: • China is the second largest healthcare market globally, with total out -of-pocket healthcare expenditures estimated to have reach ed $420 billion in 2025, after doubling over the past ten years.1 • There is still opportunity for considerable growth in China’s healthcare market, with per capita out -of-pocket healthcare spendi ng at just over $298,1 compared to an average of $1,200 among the Organization for Economic Cooperation and Development (OECD) countries.2 • China’s aging population, rising incomes, and increasing urbanization may provide a sustained catalyst for growth in China’s healthcare sector. KURE features: • Exposure to Chinese companies listed in Mainland China, Hong Kong, and the United States that are involved in the healthcare industry. • Exposure to key healthcare subsectors: Biotechnology, General Pharmaceuticals, Care Providers, Medical Devices, and Tradition al Chinese Medicine. • Exposure to companies that may benefit from China’s growing middle class and aging population. • Access to major global healthcare companies that are often not captured by broad indexes. KraneShares MSCI All China Healthcare Index ETFKURE
- Data from CEIC, Statista, Caixin Global, and the World Bank as of 12/31/2025. Retrieved on 6/30/2026.
- Data from OEC and the World Bank as of 12/31/2025. Includes estimates. Retrieved on 6/30/2026.
- Data from the National Bureau of Statistics of China as of 12/31/2024. Retrieved on 6/30/2026.
- Data from OECD as of 12/31/2025.
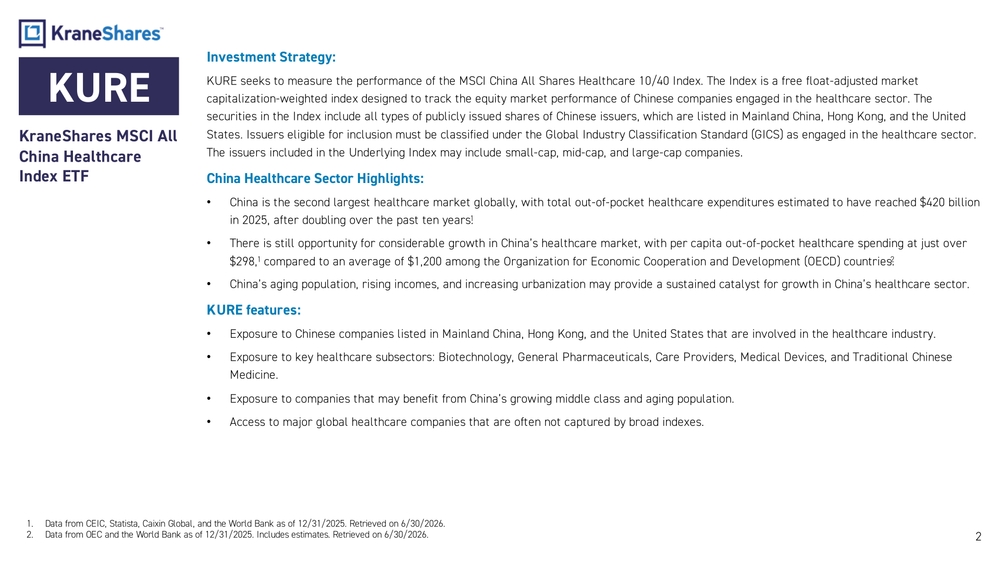
- Data from Statista as of 12/31/2025. Retrieved on 6/30/2026.An aging population means a growing healthcare market. •China's population is aging rapidly, and this demographic shift is likely to have significant implications for the country's healthcare system. •China’s population aged over 60 is expected to more than double by 2050 to more than the entire US population.1 •China’s healthcare expenditure is still small compared to the OECD average.2 30100200300400500600 2025 2050 ProjectionMillionsNumber of People aged 60+3 024681012141618 2015 2016 2017 2018 2019 2020 2021 2022 2023 2024 2025%Population in China aged 65+ as % of Total Population3
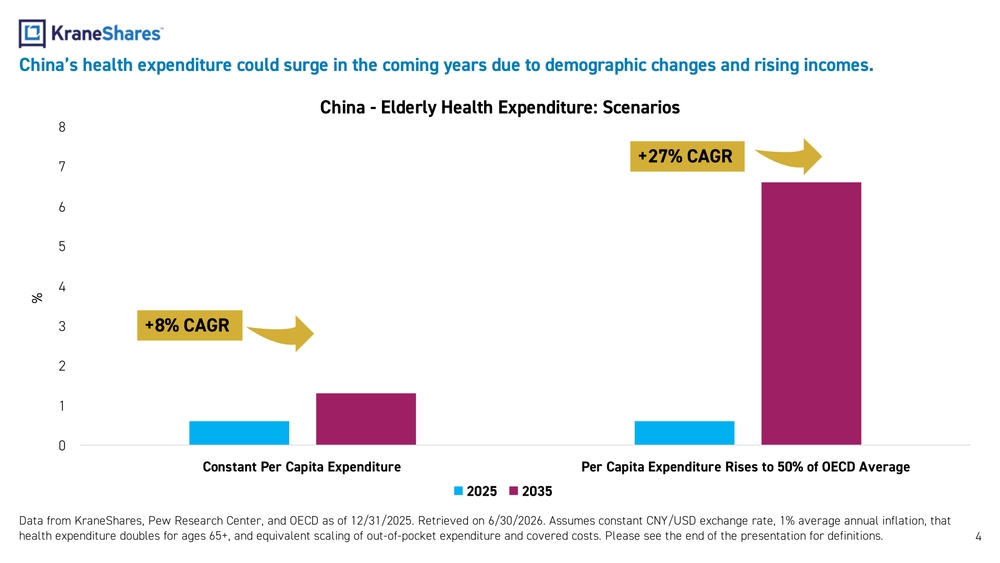
012345678 Constant Per Capita Expenditure Per Capita Expenditure Rises to 50% of OECD Average%China - Elderly Health Expenditure: Scenarios 2025 2035 Data from KraneShares, Pew Research Center, and OECD as of 12/31/2025. Retrieved on 6/30/2026. Assumes constant CNY/USD exchange rate, 1% average annual inflation, that health expenditure doubles for ages 65+, and equivalent scaling of out -of-pocket expenditure and covered costs. Please see the e nd of the presentation for definitions. +8% CAGR+27% CAGRChina’s health expenditure could surge in the coming years due to demographic changes and rising incomes. 4
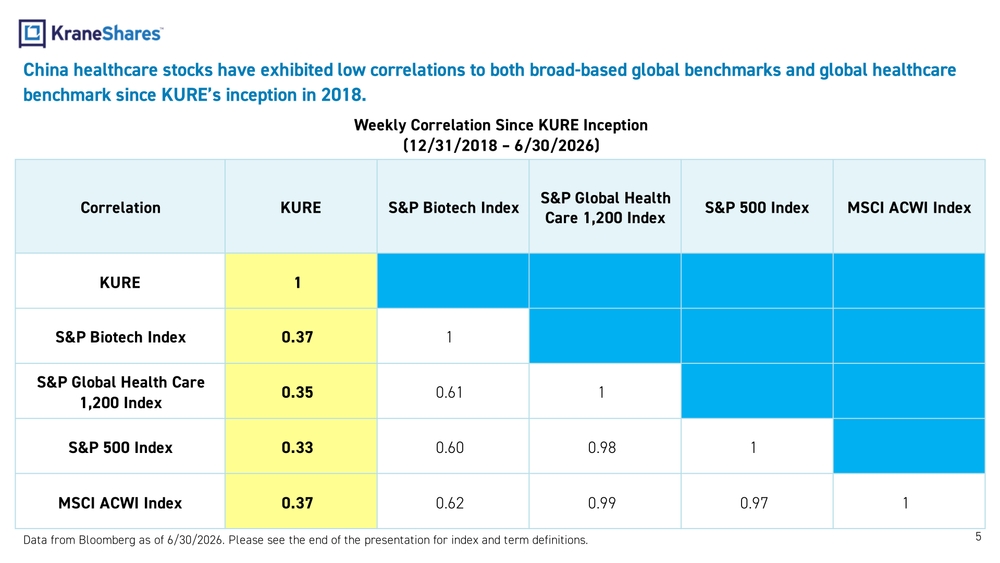
China healthcare stocks have exhibited low correlations to both broad -based global benchmarks and global healthcare benchmark since KURE’s inception in 2018. Correlation KURE S&P Biotech IndexS&P Global Health Care 1,200 IndexS&P 500 Index MSCI ACWI Index KURE 1 S&P Biotech Index 0.37 1 S&P Global Health Care 1,200 Index0.35 0.61 1 S&P 500 Index 0.33 0.60 0.98 1 MSCI ACWI Index 0.37 0.62 0.99 0.97 1Weekly Correlation Since KURE Inception (12/31/2018 – 6/30/2026) Data from Bloomberg as of 6/30/2026. Please see the end of the presentation for index and term definitions. 5
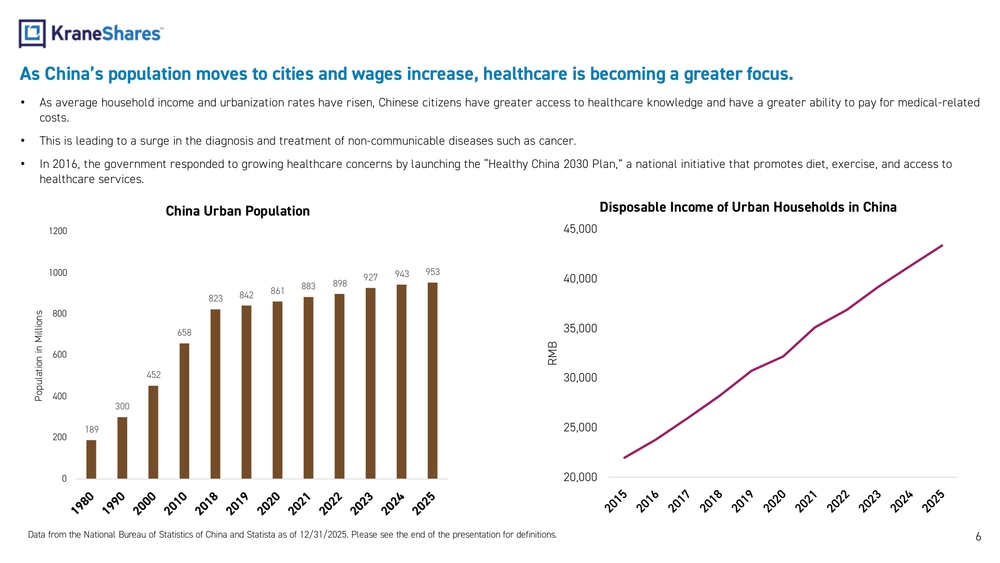
6As China’s population moves to cities and wages increase, healthcare is becoming a greater focus. •As average household income and urbanization rates have risen, Chinese citizens have greater access to healthcare knowledge a nd have a greater ability to pay for medical -related costs. •This is leading to a surge in the diagnosis and treatment of non -communicable diseases such as cancer. •In 2016, the government responded to growing healthcare concerns by launching the “Healthy China 2030 Plan,” a national initi ative that promotes diet, exercise, and access to healthcare services. Data from the National Bureau of Statistics of China and Statista as of 12/31/2025. Please see the end of the presentation fo r definitions.189300452658823842861883898927943 953 020040060080010001200Population in MillionsChina Urban Population 20,00025,00030,00035,00040,00045,000RMBDisposable Income of Urban Households in China
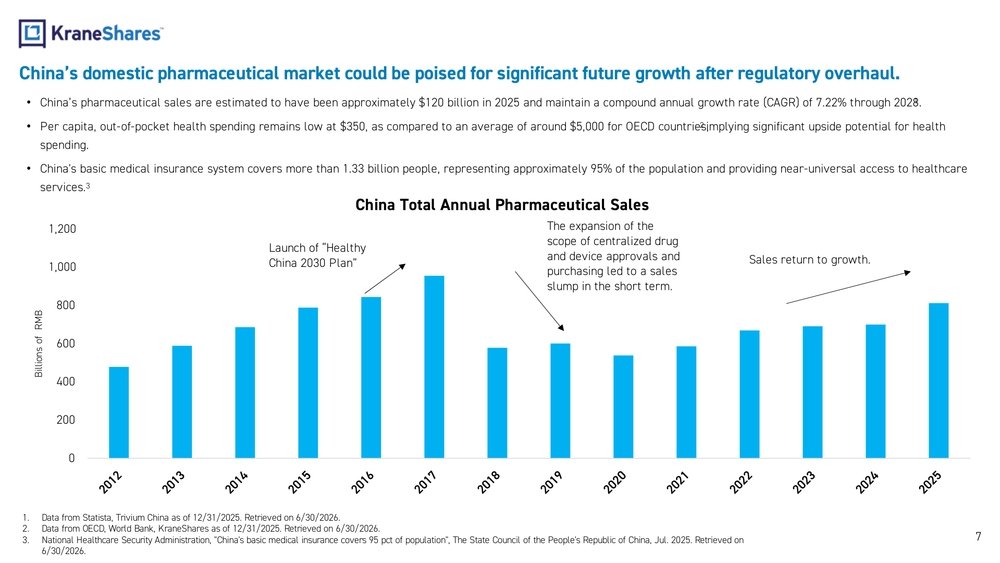
7China’s domestic pharmaceutical market could be poised for significant future growth after regulatory overhaul. •China’s pharmaceutical sales are estimated to have been approximately $120 billion in 2025 and maintain a compound annual gro wth rate (CAGR) of 7.22% through 2028.1 •Per capita, out -of-pocket health spending remains low at $350, as compared to an average of around $5,000 for OECD countries,2 implying significant upside potential for health spending. •China's basic medical insurance system covers more than 1.33 billion people, representing approximately 95% of the population and providing near -universal access to healthcare services.3
- Data from Statista, Trivium China as of 12/31/2025. Retrieved on 6/30/2026.
- Data from OECD, World Bank, KraneShares as of 12/31/2025 . Retrieved on 6/30/2026.
- National Healthcare Security Administration, "China's basic medical insurance covers 95 pct of population", The State Council of the People's Republic of China, Jul. 2025. Retrieved on 6/30/2026.The expansion of the scope of centralized drug and device approvals and purchasing led to a sales slump in the short term.Launch of “Healthy China 2030 Plan” Sales return to growth. 02004006008001,0001,200Billions of RMBChina Total Annual Pharmaceutical Sales
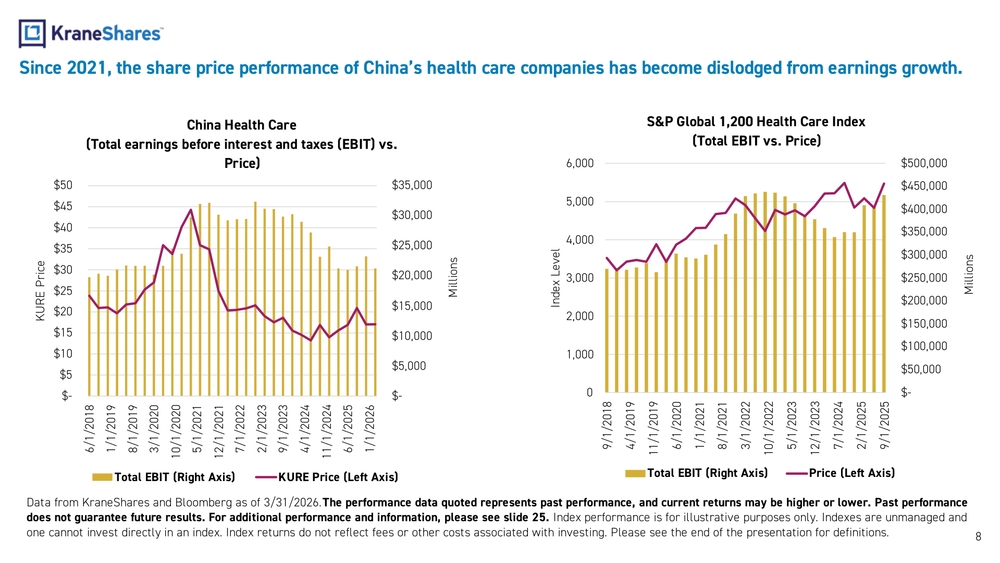
8Since 2021, the share price performance of China’s health care companies has become dislodged from earnings growth . Data from KraneShares and Bloomberg as of 3/31/2026 . The performance data quoted represents past performance, and current returns may be higher or lower. Past performance does not guarantee future results. For additional performance and information, please see slide 25. Index performance is for illustrative purposes only. Indexes are unmanaged and one cannot invest directly in an index. Index returns do not reflect fees or other costs associated with investing. Please se e the end of the presentation for definitions. $- $50,000 $100,000 $150,000 $200,000 $250,000 $300,000 $350,000 $400,000 $450,000 $500,000 01,0002,0003,0004,0005,0006,000 9/1/2018 4/1/2019 11/1/2019 6/1/2020 1/1/2021 8/1/2021 3/1/2022 10/1/2022 5/1/2023 12/1/2023 7/1/2024 2/1/2025 9/1/2025 MillionsIndex LevelS&P Global 1,200 Health Care Index (Total EBIT vs. Price) Total EBIT (Right Axis) Price (Left Axis) $- $5,000 $10,000 $15,000 $20,000 $25,000 $30,000 $35,000 $- $5 $10 $15 $20 $25 $30 $35 $40 $45 $50 6/1/2018 1/1/2019 8/1/2019 3/1/2020 10/1/2020 5/1/2021 12/1/2021 7/1/2022 2/1/2023 9/1/2023 4/1/2024 11/1/2024 6/1/2025 1/1/2026 MillionsKURE PriceChina Health Care (Total earnings before interest and taxes (EBIT) vs. Price) Total EBIT (Right Axis) KURE Price (Left Axis)
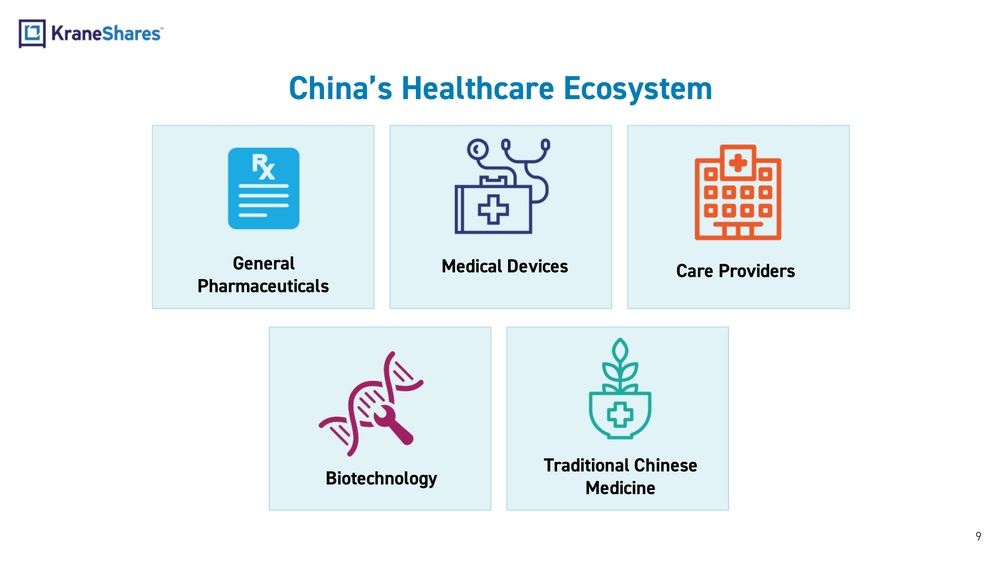
9China’s Healthcare Ecosystem General PharmaceuticalsMedical Devices Care Providers BiotechnologyTraditional Chinese Medicine
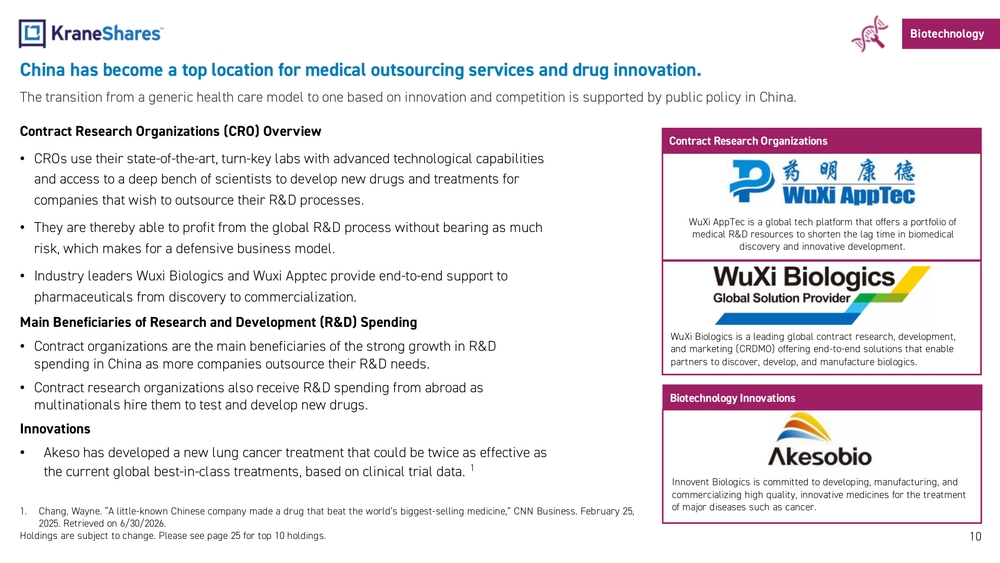
10Contract Research Organizations (CRO) Overview •CROs use their state -of-the-art, turn -key labs with advanced technological capabilities and access to a deep bench of scientists to develop new drugs and treatments for companies that wish to outsource their R&D processes. •They are thereby able to profit from the global R&D process without bearing as much risk, which makes for a defensive business model. •Industry leaders Wuxi Biologics and Wuxi Apptec provide end -to-end support to pharmaceuticals from discovery to commercialization. Main Beneficiaries of Research and Development (R&D) Spending •Contract organizations are the main beneficiaries of the strong growth in R&D spending in China as more companies outsource their R&D needs. •Contract research organizations also receive R&D spending from abroad as multinationals hire them to test and develop new drugs. Innovations •Akeso has developed a new lung cancer treatment that could be twice as effective as the current global best -in-class treatments, based on clinical trial data.1China has become a top location for medical outsourcing services and drug innovation. The transition from a generic health care model to one based on innovation and competition is supported by public policy in C hina. Biotechnology WuXi AppTec is a global tech platform that offers a portfolio of medical R&D resources to shorten the lag time in biomedical discovery and innovative development.Contract Research Organizations WuXi Biologics is a leading global contract research, development, and marketing (CRDMO) offering end -to-end solutions that enable partners to discover, develop, and manufacture biologics. Innovent Biologics is committed to developing, manufacturing, and commercializing high quality, innovative medicines for the treatment of major diseases such as cancer. Biotechnology Innovations 1.Chang, Wayne. “A little -known Chinese company made a drug that beat the world’s biggest -selling medicine,” CNN Business. Februar y 25, 2025. Retrieved on 6/30/2026. Holdings are subject to change. Please see page 25 for top 10 holdings.
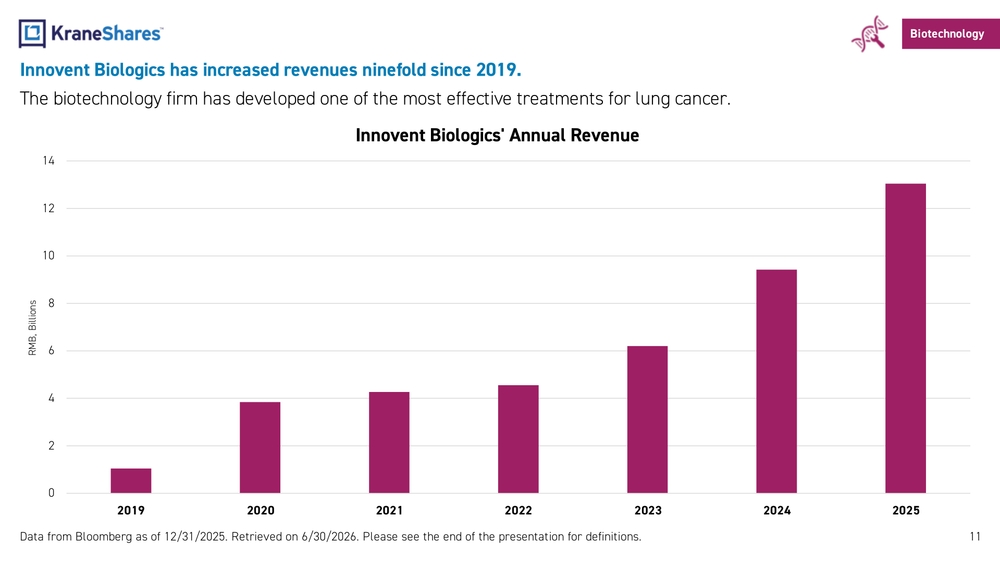
11Innovent Biologics has increased revenues ninefold since 2019. The biotechnology firm has developed one of the most effective treatments for lung cancer. Biotechnology Data from Bloomberg as of 12/31/2025. Retrieved on 6/30/2026. Please see the end of the presentation for definitions.02468101214 2019 2020 2021 2022 2023 2024 2025RMB, BillionsInnovent Biologics' Annual Revenue
12Out-Licensing and In -Licensing represent a significant opportunity for China’s pharmaceutical firms. The Hisun -Pfizer joint venture is mutually beneficial in international marketing and in the commercialization of generic medicines in China. Favorable Policies Several market -friendly policies have been introduced encouraging joint ventures between multinational companies and domestic companies, which include: •Increasing efficiency and transparency of drug review and approval processes •Maximizing quality of generic drugs •Enhancing efficiency in R&D innovations •The Chinese government has been working to speed up the approval process for new drugs and to encourage the development of innovative drugs in recent years.Pharmaceutical In -Licensing General Pharmaceuticals 1.News Release. “Lilly Announces Complete Response Letter for Sintilimab in Combination with Permetrexed and Platinum Chemotherapy for the First -Line Treatment of People with Nonsquamos Non-Small Cell Lung Cancer,” Eli Lilly. March 24, 2022. Retrieved on 6/30/2026. Holdings are subject to change. See page 25 for top 10 holdings. Eli Lilly developed a lung cancer treatment with Innovent.1Pharmaceutical Out -Licensing Medial Devices In -Licensing Fosun Pharma and Intuitive Surgical’s joint venture is mutually beneficial in biomedical technology and pharmaceutical manufacturing and distribution.Definitions: •Out-Licensing: The practice of selling pharmaceuticals or medical devices developed in China in international markets. •In-Licensing: The practice of selling pharmaceuticals or medical devices developed in international markets in China.
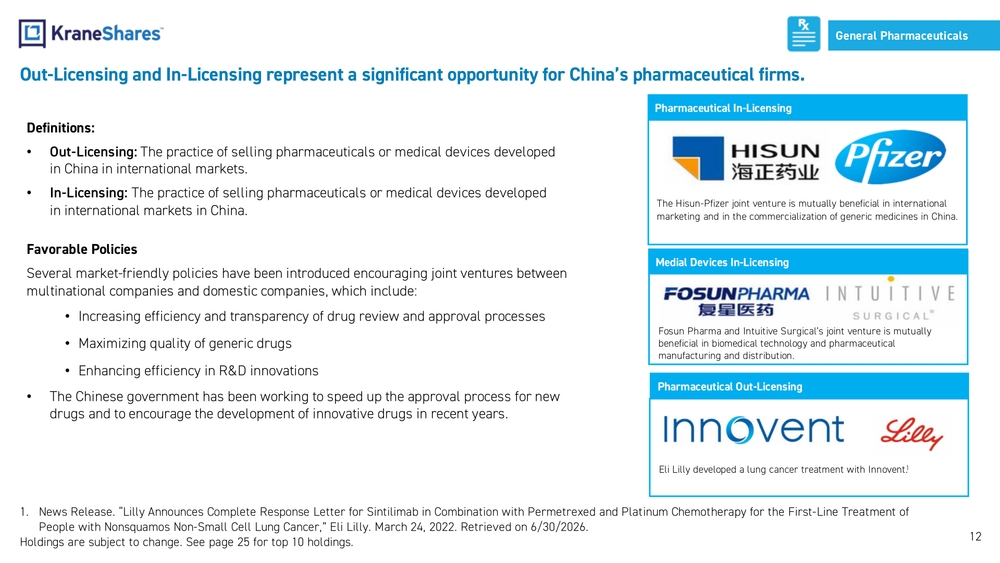
13The number of out -licensing deals has increased in recent years, leading to an even more global customer base for China’s pharmaceutical firms. Data from CLSA, McKinsey, Pharma DJ, Pharmavoice , Pharmasource , and PharmCube as of 12/31/2025. Includes estimates. General Pharmaceuticals 210 122142 4873 70 2037648583128 66170 19186 050100150200250300 2017 2018 2019 2020 2021 2022 2023 2024 2025No. of China Drug Licensing Deals: In vs. Out Out-Licensing In-Licensing
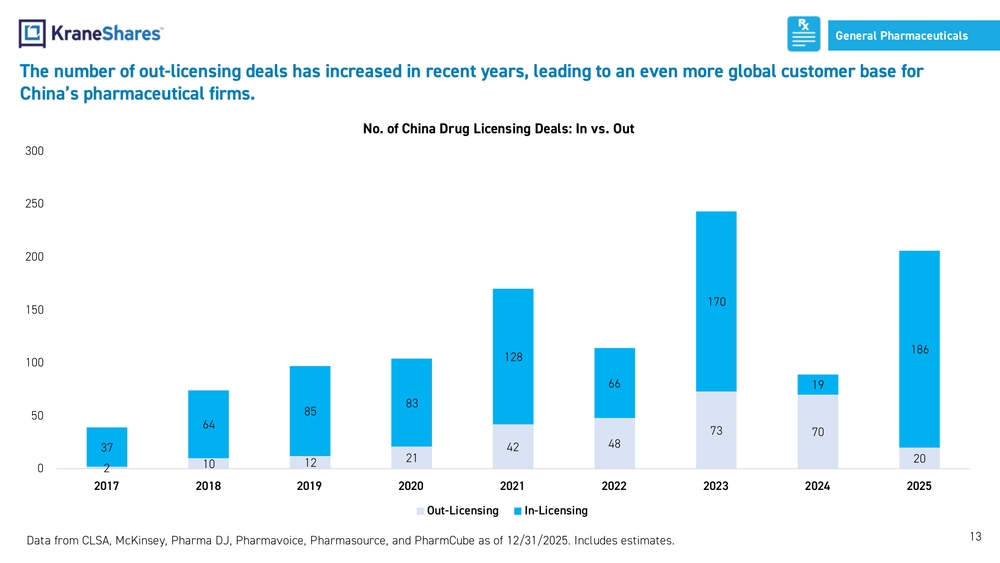
14•Due to perceived quality advantages, medical equipment imports from the U.S. and Europe remain high. However, as quality increases, Chinese domestic medical device companies are increasingly competing with U.S. and European companies, making particularly strong gains in medium -level technology niches. •In addition to benefitting from strong domestic demand, China’s top medical device companies have overseas operations and serve customers globally.Medical Devices Total Market Size ($ Billions) 45.0 Expected Compound Annual Growth Rate (CAGR) 2025 -2032 (%)9.40%China Medical Devices Market Medical Devices Data from US Department of Commerce, Statista, Fortune Business Insights as of 12/31/2025. Please see the end of the presentation for definitions. Medical Devices Mindray is a leading global supplier of in -vitro fertilization equipment, ventilators, among other key medical devices.China’s medical device market is world -class with both domestic and international customer bases. Holdings are subject to change. See page 25 for top 10 holdings.
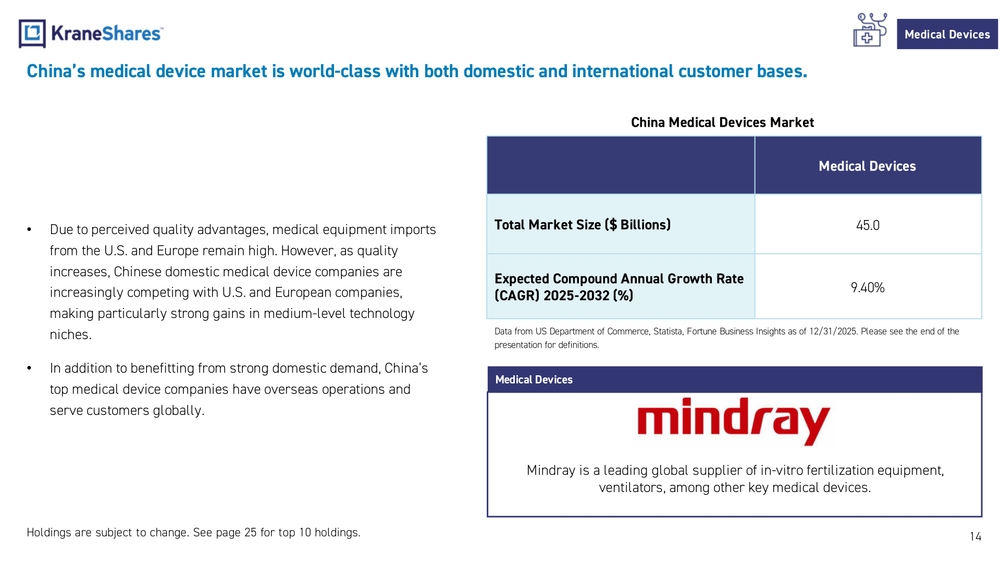
15 Medical Devices Global medical devices giant Mindray has doubled its revenue since 2019. Data from Bloomberg as of 12/31/2025. 2025 revenue is estimated. Please see the end of the presentation for definitions.0510152025303540 2019 2020 2021 2022 2023 2024 2025RMB, BillionsMindray Annual Revenue
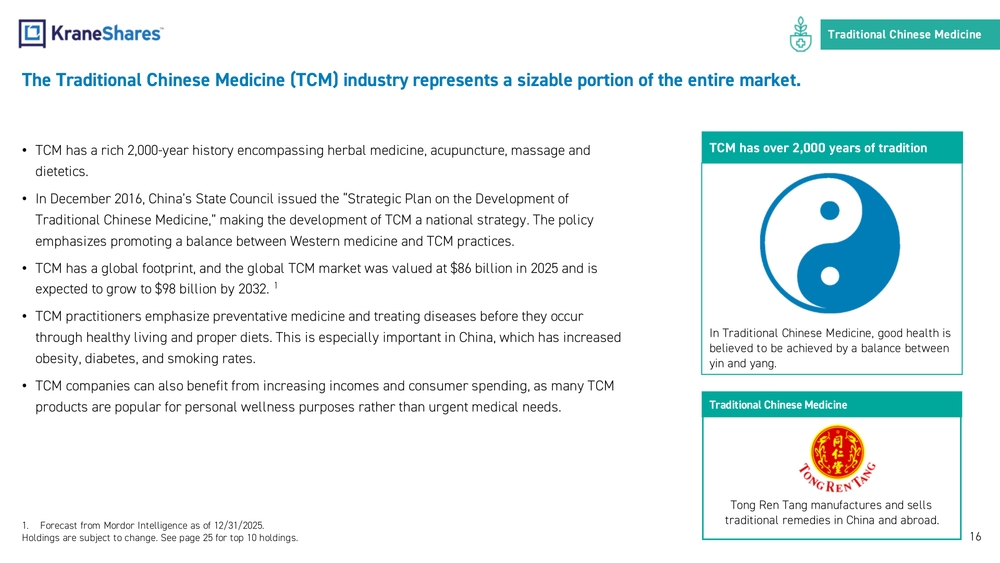
16•TCM has a rich 2,000 -year history encompassing herbal medicine, acupuncture, massage and dietetics. •In December 2016, China’s State Council issued the “Strategic Plan on the Development of Traditional Chinese Medicine,” making the development of TCM a national strategy. The policy emphasizes promoting a balance between Western medicine and TCM practices. •TCM has a global footprint, and the global TCM market was valued at $86 billion in 2025 and is expected to grow to $98 billion by 2032.1 •TCM practitioners emphasize preventative medicine and treating diseases before they occur through healthy living and proper diets. This is especially important in China, which has increased obesity, diabetes, and smoking rates. •TCM companies can also benefit from increasing incomes and consumer spending, as many TCM products are popular for personal wellness purposes rather than urgent medical needs. 1.Forecast from Mordor Intelligence as of 12/31/2025. Holdings are subject to change. See page 25 for top 10 holdings.The Traditional Chinese Medicine (TCM) industry represents a sizable portion of the entire market. TCM has over 2,000 years of tradition In Traditional Chinese Medicine, good health is believed to be achieved by a balance between yin and yang. Traditional Chinese Medicine Traditional Chinese Medicine Tong Ren Tang manufactures and sells traditional remedies in China and abroad.
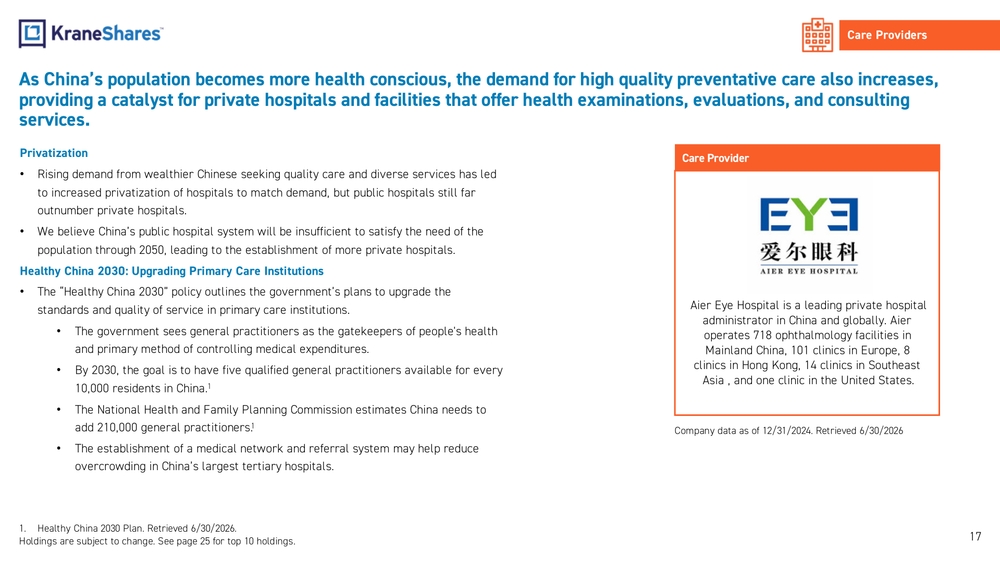
17 Care Providers As China’s population becomes more health conscious, the demand for high quality preventative care also increases, providing a catalyst for private hospitals and facilities that offer health examinations, evaluations, and consulting services. Privatization •Rising demand from wealthier Chinese seeking quality care and diverse services has led to increased privatization of hospitals to match demand, but public hospitals still far outnumber private hospitals. •We believe China’s public hospital system will be insufficient to satisfy the need of the population through 2050, leading to the establishment of more private hospitals. Healthy China 2030: Upgrading Primary Care Institutions •The “Healthy China 2030” policy outlines the government’s plans to upgrade the standards and quality of service in primary care institutions. •The government sees general practitioners as the gatekeepers of people's health and primary method of controlling medical expenditures. •By 2030, the goal is to have five qualified general practitioners available for every 10,000 residents in China.1 •The National Health and Family Planning Commission estimates China needs to add 210,000 general practitioners.1 •The establishment of a medical network and referral system may help reduce overcrowding in China’s largest tertiary hospitals. 1.Healthy China 2030 Plan. Retrieved 6/30/2026. Holdings are subject to change. See page 25 for top 10 holdings.Care Provider Aier Eye Hospital is a leading private hospital administrator in China and globally. Aier operates 718 ophthalmology facilities in Mainland China, 101 clinics in Europe, 8 clinics in Hong Kong, 14 clinics in Southeast Asia , and one clinic in the United States. Company data as of 12/31/2024. Retrieved 6/30/2026
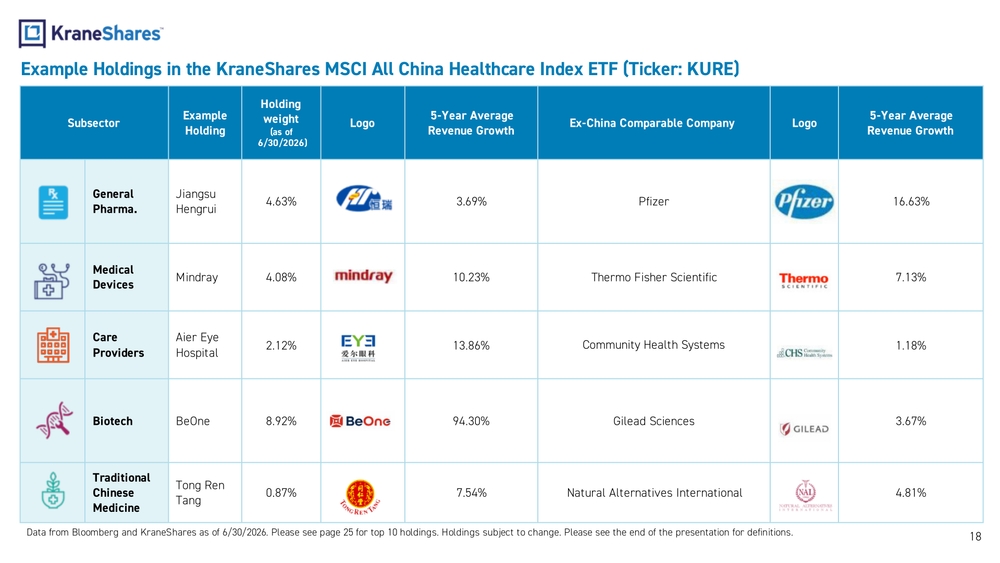
Example Holdings in the KraneShares MSCI All China Healthcare Index ETF (Ticker: KURE)
Data from Bloomberg and KraneShares as of 6/30/2026. Please see page 25 for top 10 holdings. Holdings subject to change. Plea se see the end of the presentation for definitions. SubsectorExample
HoldingHolding
weight
(as of
6/30/2026)Logo5-Year Average
Revenue GrowthEx-China Comparable Company Logo5-Year Average
Revenue Growth
General
Pharma.Jiangsu
Hengrui4.63% 3.69% Pfizer 16.63%
Medical
DevicesMindray 4.08% 10.23% Thermo Fisher Scientific 7.13%
Care
ProvidersAier Eye
Hospital2.12% 13.86% Community Health Systems 1.18%
Biotech BeOne 8.92% 94.30% Gilead Sciences 3.67%
Traditional
Chinese
MedicineTong Ren
Tang0.87% 7.54% Natural Alternatives International 4.81%
18
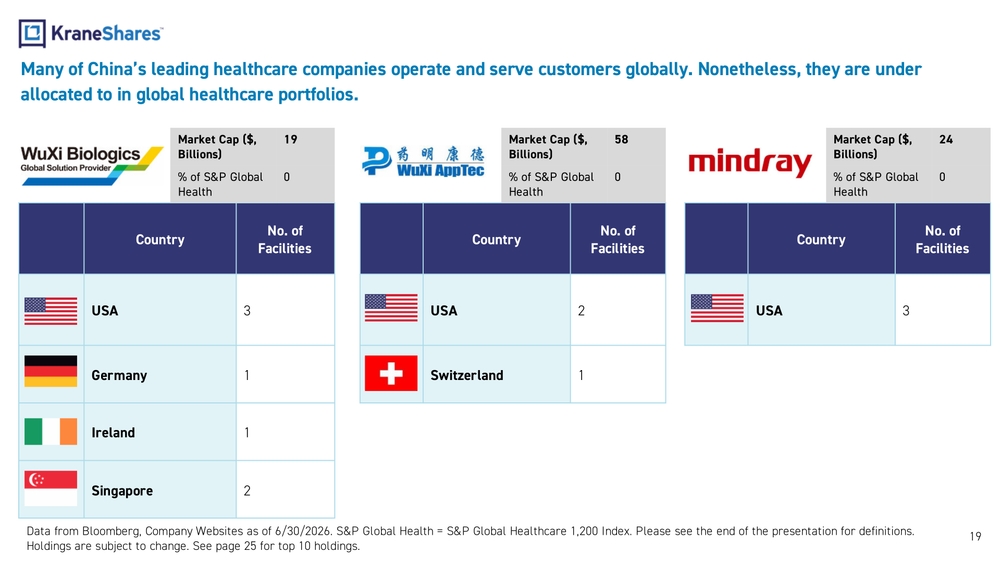
19Many of China’s leading healthcare companies operate and serve customers globally. Nonetheless, they are under allocated to in global healthcare portfolios. CountryNo. of Facilities USA 3 Germany 1 Ireland 1 Singapore 2 CountryNo. of Facilities USA 2 Switzerland 1 CountryNo. of Facilities USA 3 Market Cap ($, Billions)19 % of S&P Global Health0Market Cap ($, Billions)58 % of S&P Global Health0Market Cap ($, Billions)24 % of S&P Global Health0 Data from Bloomberg, Company Websites as of 6/30/2026. S&P Global Health = S&P Global Healthcare 1,200 Index. Please see the end of the presentation for definitions. Holdings are subject to change. See page 25 for top 10 holdings.
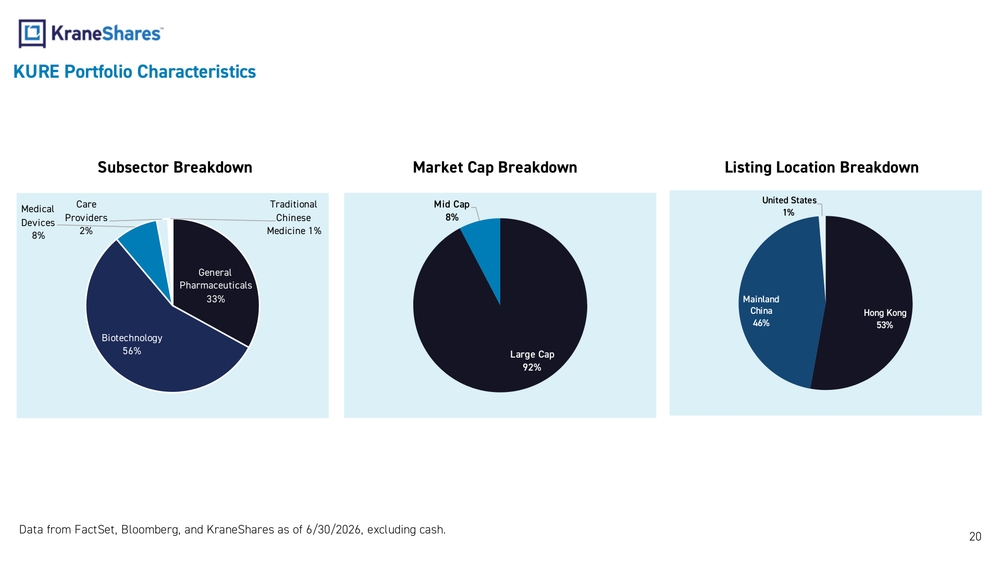
KURE Portfolio Characteristics Market Cap Breakdown Listing Location Breakdown Data from FactSet, Bloomberg, and KraneShares as of 6/30/2026, excluding cash.20Subsector Breakdown Large Cap 92%Mid Cap 8% Hong Kong 53%Mainland China 46%United States 1% General Pharmaceuticals 33% Biotechnology 56%Medical Devices 8%Care Providers 2%Traditional Chinese Medicine 1%
KraneShares MSCI AllChina Health Care Index ETF Investment Strategy: TheKraneShares MSCI AllChina Health Care Index ETF (KURE) seeks to measure theperformance ofMSCI China AllShares Health Care 10/40 Index. TheIndex isafree float adjusted market capitalization weighted index designed to track the equity market performance of Chinese companies engaged inthehealth care sector. Thesecurities in theIndex include alltypes ofpublicly issued shares ofChinese issuers, which are listed inMainland China, Hong Kong andUnited States. Issuers eligible forinclusion must beclassified under theGlobal Industry Classification Standard (GICS) asengaged inthehealthcare sector. Theissuers included intheUnderlying Index may include small - cap, mid-capand large -capcompanies.Fund Details Data as of 6/30/2026 Primary Exchange NYSE Arca, Inc. CUSIP 500767835 ISIN US5007678353 Total Annual Fund Operating Expense (Gross) 0.79% Total Annual Fund Operating Expense (Net)* 0.65% Inception Date 01/31/2018 Distribution Frequency Annual Underlying Index MSCI China All Shares Health Care 10/40 Index (USD) NetAssets $71,227,168 Number ofHoldings 76Top10Holdings asof 6/30/202 6Holdings are subject tochange.Ticker % BEONE MEDICINES LTD-H 6160 8.84 INNOVENT BIOLOGICS INC 1801 8.80 WUXI BIOLOGICS CAYMAN INC 2269 7.51 WUXI APPTEC COLTD-A 603259 5.79 JIANGSU HENGRUI PHARMACEUT -A 600276 4.59 SHENZHEN MINDRAY BIO-MEDIC -A 300760 4.27 AKESO INC 9926 3.72 CSPC PHARMACEUTICAL GROUP LT 1093 3.68 SINO BIOPHARMACEUTICAL 1177 3.39 WUXI APPTEC CO LTD -H 2359 3.35 KURE Performance History asof6/30/202 6: Cumulative % Average Annualized % 3Mo 6Mo Since Inception 1Yr 3Yr 5Yr Since Inception Fund NAV-7.56% -8.80% -23.43 % -3.15% -2.80% -16.07 % -3.12% Closing Price-7.73% -7.57% -22.89 % -3.16% -2.50% -15.92% -3.04% Underlying Index-7.40% -8.43% -18.57 % -2.45% -2.05% -15.54% -2.41% Theperformance data quoted represents past performance. Past performance does notguarantee future results. Theinvestment return andprincipal value ofaninvestment will fluctuate sothat aninvestors shares, when sold orredeemed, may beworth more orless than their original cost andcurrent performance may belower orhigher than theperformance quoted. Forperformance data current tothemost recent month end, please visit www.kraneshares.com/kure. Index returns areforillustrative purposes only. Index performance returns donotreflect anymanagement fees, transaction costs orexpenses. Indexes areunmanaged and onecannot invest directly inanindex. *Fee waivers arecontractual andineffect until August 1,2026 21
KraneShares Empowering investors with access to the world’ s most powerful growth themes through ETFs, private strategies, and innovative investment solutions. 22
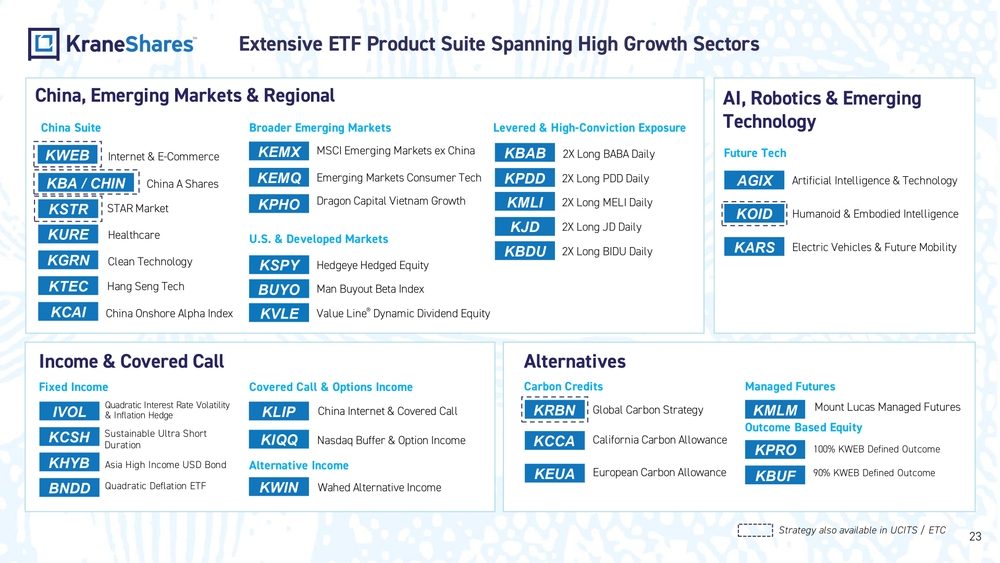
China, Emerging Markets & Regional Alternatives Income & Covered Call AI, Robotics & Emerging Technology KURE Healthcare KGRN Clean TechnologyKSTR STAR Market KTEC Hang Seng TechKWEB Internet & E -Commerce China A Shares KBA / CHIN KCAI China Onshore Alpha IndexAGIX Artificial Intelligence & Technology KOID Humanoid & Embodied Intelligence Electric Vehicles & Future Mobility KARSChina Suite Future TechBroader Emerging Markets KEMQ Emerging Markets Consumer Tech KPHODragon Capital Vietnam GrowthKEMX MSCI Emerging Markets ex China U.S. & Developed Markets KVLE Value Line® Dynamic Dividend EquityHedgeye Hedged Equity KSPY Man Buyout Beta Index BUYO Fixed Income BNDDQuadratic Deflation ETFIVOLQuadratic Interest Rate Volatility & Inflation Hedge KHYB Asia High Income USD BondSustainable Ultra Short DurationKCSH KEUA European Carbon AllowanceGlobal Carbon Strategy KRBNCarbon CreditsKPDD 2X Long PDD Daily KJD 2X Long JD DailyKBAB 2X Long BABA Daily KMLI 2X Long MELI Daily Covered Call & Options Income Managed Futures KMLMMount Lucas Managed Futures KWIN Wahed Alternative IncomeKLIP China Internet & Covered Call Outcome Based Equity KIQQ Nasdaq Buffer & Option IncomeLevered & High -Conviction Exposure KBUF90% KWEB Defined Outcome100% KWEB Defined Outcome KPRO Alternative Income KCCA California Carbon AllowanceExtensive ETF Product Suite Spanning High Growth Sectors Strategy also available in UCITS / ETCKBDU 2X Long BIDU Daily 23
Index Definitions:
S&P Global 1,200 Health Care Index :The S&P Global 1200 Health Care index consists of all members of the S&P Global 1200 that are classified within the GICS® hea lthcare sector, including both developed and emerging
markets. The index was launched on September 30, 1999.
MSCI World Health Care Index: The MSCI World Health Care Index is designed to capture the large and mid cap segments across 23 Developed Markets (DM) count ries*. All securities in the index are classified in the Health
Care as per the Global Industry Classification Standard (GICS®). The index was launched on September 15, 1999.
S&P Biotech Index: S&P Select Industry indexes are designed to measure the performance of narrow GICS sub -industries. The S&P Biotechnology Select Industry Index comprises stocks in the S&P Total Market Index that
are classified in the GICS Biotechnology sub -industry. The index was launched on January 27, 2006.
S&P 500 Index: The S&P 500 Index is widely regarded as the best single gauge of large -cap U.S. equities. There is over USD 9.9 trillion indexed or benchmarked to the index, with indexed assets comprising approximately
USD 3.4 trillion of this total. The index includes 500 leading companies and covers approximately 80% of available market cap italization. The index was launched on March 4, 1957.
MSCI All Country World Index (ACWI): The MSCI ACWI captures large and mid-cap representation across 23 Developed Markets (DM) and 24 Emerging Markets (EM) countries* . With 2,558 constituents, the index covers
approximately 85% of the global investable equity opportunity set. The index was launched on May 31, 1990.
Term Definitions :
Earnings before Interest and Taxes (EBIT): A company’s total revenue before deducting interest and taxes.
Price to Earnings Ratio (P/E): A company’s share price divided by its earnings per share. The P/E ratio is meant to provide a sense of whether a company is over or under -valued.
Revenue: The money a company makes from selling goods and services, before the deduction of any expenses.
Revenue Growth : The change in a company’s revenues over a specified period of time.
Compound Annual Growth Rate (CAGR): The compound annual growth rate is the rate of return would be required for an investment to grow from its beginning balance to its ending balance, assuming the profits were
reinvested at the end of each period of the investment’s life span.
Urban Population: Population of urban and suburban areas.
Disposable Income: The income that does not go towards housing and basic necessities.
Per Capit a Expenditure: The average annual spending per person on healthcare needs, including both out -of-pocket costs and covered expenses.
Correlation: The degree to which two variables, in this case investments, move in tandem with one another. It is expressed using a number between -1 and 1, with -1 indicating a perfectly inverse relationship, 0 indicating no
synchronization whatsoever, and 1 indicating they always move in lockstep with one another.
24
Important Notes:
Carefully consider the Funds’ investment objectives, risk factors, charges and expenses before investing. This and additional information can be found in the Funds' full and summary
prospectus, which may be obtained by visiting www.kraneshares.com/kure/ Read the prospectus carefully before investing.
Risk Disclosures:
Investing involves risk, including possible loss of principal. There can be no assurance that a Fund will achieve its stated objectives. Indices are unmanaged and do not include the effect of fees. One cannot
invest directly in an index.
This information should not be relied upon as research, investment advice, or a recommendation regarding any products, strategies, or any security in particular. This material is strictly for illustrative,
educational, or informational purposes and is subject to change. Certain content represents an assessment of the market environment at a specific time and is not intended to be a forecast of future events or a
guarantee of future results; material is as of the dates noted and is subject to change without notice.
The Fund may invest in derivatives, which are often more volatile than other investments and may magnify the Fund’s gains or losses. A derivative (i.e., futures/forward contracts, swaps, and options) is a
contract that derives its value from the performance of an underlying asset. The primary risk of derivatives is that changes in the asset’s market value and the derivative may not be proportionate, and some
derivatives can have the potential for unlimited losses. Derivatives are also subject to liquidity and counterparty risk. The Fund is subject to liquidity risk, meaning that certain investments may become difficult
to purchase or sell at a reasonable time and price. If a transaction for these securities is large, it may not be possible to initiate, which may cause the Fund to suffer losses. Counterparty risk is the risk of loss
in the event that the counterparty to an agreement fails to make required payments or otherwise comply with the terms of the derivative.
The ability of the Fund to achieve its respective investment objectives is dependent, in part, on the continuous availability of A Shares and the ability to obtain, if necessary, additional A Shares quota. If the Fund
is unable to obtain sufficient exposure to limited availability of A Share quota, the Fund could seek exposure to the component securities of the Underlying Index by investment in other types of securities. The
Fund is subject to political, social or economic instability within China which may cause decline in value. Emerging markets involve heightened risk related to the same factors as well as increase volatility and
lower trading volume. Fluctuations in currency of foreign countries may have an adverse effect to domestic currency values. The Fund may invest in Initial Public Offerings (IPOs). Securities issued in IPOs
have no trading history, and information about the companies may be available for very limited periods. In addition, the prices of securities sold in IPOs may be highly volatile. In addition, as the Fund increases
in size, the impact of IPOs on the Fund’s performance will generally decrease.
Narrowly focused investments typically exhibit higher volatility. The Fund’s assets are expected to be concentrated in a sector, industry, market, or group of concentrations to the extent that the Underlying
Index has such concentrations. The securities or futures in that concentration could react similarly to market developments. Thus, the Fund is subject to loss due to adverse occurrences that affect that
concentration. In addition to the normal risks associated with investing, investments in smaller companies typically exhibit higher volatility. KURE is non-diversified.
ETF shares are bought and sold on an exchange at market price (not NAV) and are not individually redeemed from the Fund. However, shares may be redeemed at NAV directly by certain authorized broker -
dealers (Authorized Participants) in very large creation/redemption units. The returns shown do not represent the returns you would receive if you traded shares at other times. Shares may trade at a
premium or discount to their NAV in the secondary market. Brokerage commissions will reduce returns. Beginning 12/23/2020, market price returns are based on the official closing price of an ETF share or, if
the official closing price isn't available, the midpoint between the national best bid and national best offer ("NBBO") as of the time the ETF calculates the current NAV per share. Prior to that date, market price
returns were based on the midpoint between the Bid and Ask price. NAVs are calculated using prices as of 4:00 PM Eastern Time.
The KraneShares ETFs and KFA Funds ETFs are distributed by SEI Investments Distribution Company (SIDCO), 1 Freedom Valley Drive, Oaks, PA 19456, which is not affiliated with Krane Funds Advisors,
LLC, the Investment Adviser for the Funds, or any sub-advisers for the Funds.
25