OBOR ETF: One Belt One Road | KraneShares
by Kraneshares
The One Belt One Road Initiative: A New Paradigm in Global Investing
An Overview of the KraneShares MSCI One Belt One Road ETF
(ticker: OBOR)
6/30/2025
Introduction to KraneShares
About KraneShares
Krane Funds Advisors, LLC is a specialist investment manager focused on China, Carbon, Climate, and other uncorrelated assets. KraneShares seeks to provide innovative, high conviction, and first to market strategies. The firm was founded in 2013 and manages for institutions and individuals globally. In 2017, KraneShares formed a strategic partnership with China International Capital Corporation (CICC) when they acquired a majority ownership stake. The firm is a signatory of the United Nations-supported Principles for Responsible Investment (UN PRI).
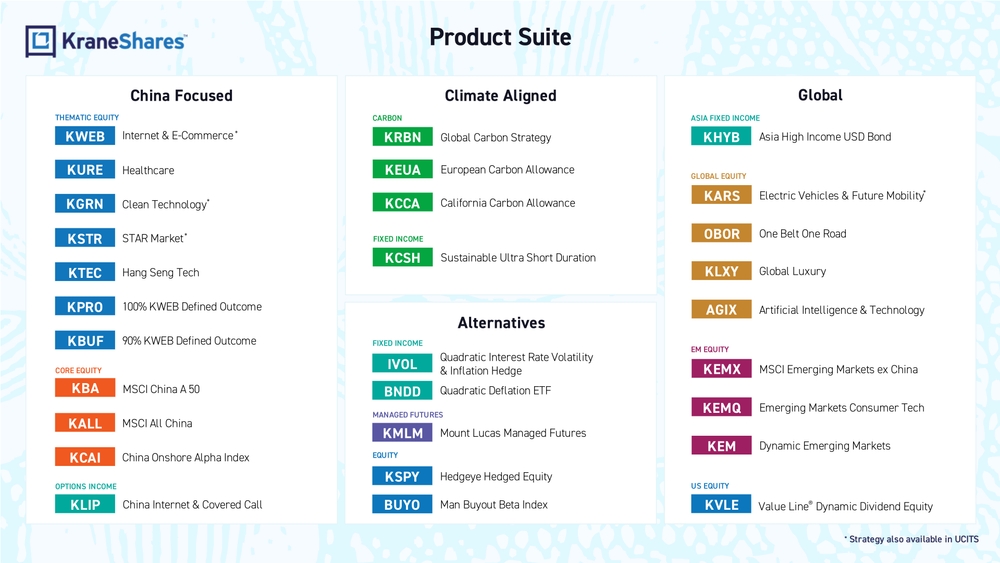
Product Suite
China Focused
Thematic Equity
- KWEB Internet & E-Commerce*
- KURE Healthcare
- KGRN Clean Technology*
- KSTR STAR Market*
- KTEC Hang Seng Tech
- KPRO 100% KWEB Defined Outcome
- KBUF 90% KWEB Defined Outcome
Core Equity
- KBA MSCI China A 50
- KALL MSCI All China
- KCAI China Onshore Alpha Index
Options Income
- KLIP China Internet & Covered Call
Climate Aligned
Carbon
- KRBN Global Carbon Strategy
- KEUA European Carbon Allowance
- KCCA California Carbon Allowance
Fixed Income
- KCSH Sustainable Ultra Short Duration
Alternatives
Fixed Income
- IVOL Quadratic Interest Rate Volatility & Inflation Hedge
- BNDD Quadratic Deflation ETF
Managed Futures
- KMLM Mount Lucas Managed Futures
Equity
- KSPY Hedgeye Hedged Equity
- BUYO Man Buyout Beta Index
Global
Asia Fixed Income
- KHYB Asia High Income USD Bond
Global Equity
- KARS Electric Vehicles & Future Mobility*
- OBOR One Belt One Road
- KLXY Global Luxury
- AGIX Artificial Intelligence & Technology
EM Equity
- KEMX MSCI Emerging Markets ex China
- KEMQ Emerging Markets Consumer Tech
- KEM Dynamic Emerging Markets
US Equity
- KVLE Value Line® Dynamic Dividend Equity
*Strategy also available in UCITS
KraneShares MSCI One Belt One Road ETF
Investment Strategy
The KraneShares MSCI One Belt One Road ETF (ticker: OBOR) seeks to provide investment results that track the price and yield performance of the MSCI Global China Infrastructure Exposure Index. The Index aims to identify potential beneficiaries of the One Belt One Road (OBOR) initiative based on how their geography, revenue, and sector attributes align with the broad theme. OBOR seeks to capture the economic growth and monetize the potential upside for the companies involved in China's One Belt One Road initiative.
OBOR Initiative Facts
- The One Belt One Road (OBOR) initiative, established by President Xi Jinping of China, is an extensive long-term infrastructure initiative modernizing the original Silk Road trading routes. The initiative has two core components:
- Economic land belt: linking countries by land along the ancient Silk Road through Central Asia, West Asia, the Middle East, and Europe.
- Maritime road: linking countries by sea along the Eastern coast of Africa pushing up through the Suez Canal into the Mediterranean.
- China has signed cooperation agreements with over 150 countries and international organizations, which, including China, represent 60% of the world's population and more than a third of global GDP.
- The OBOR initiative could see $4-8 trillion in investment in the coming years and is poised to reshape global trade.
OBOR ETF Highlights
- Invests in countries who may benefit from the OBOR initiative, including China, South Africa, Singapore, Malaysia, and Israel.
- Invests in sectors of primary focus to the OBOR initiative, including industrials, utilities, materials, financials, and energy.
- Benchmarked to MSCI, a global leader in international indexing.
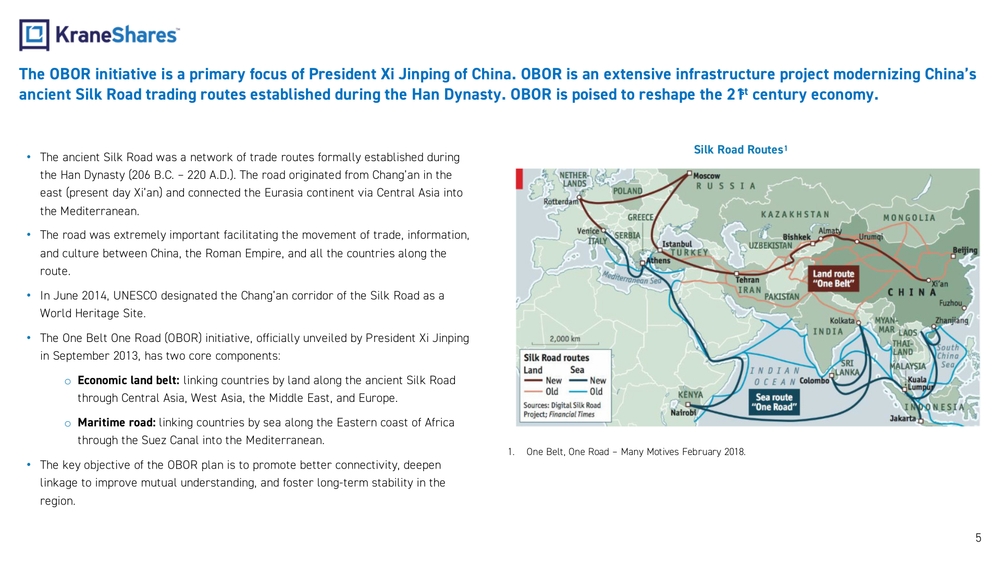
Silk Road Routes
The OBOR initiative is a primary focus of President Xi Jinping of China. OBOR is an extensive infrastructure project modernizing China's ancient Silk Road trading routes established during the Han Dynasty. OBOR is poised to reshape the 21st century economy.
- The ancient Silk Road was a network of trade routes formally established during the Han Dynasty (206 B.C. – 220 A.D.). The road originated from Chang'an in the east (present day Xi'an) and connected the Eurasia continent via Central Asia into the Mediterranean.
- The road was extremely important facilitating the movement of trade, information, and culture between China, the Roman Empire, and all the countries along the route.
- In June 2014, UNESCO designated the Chang'an corridor of the Silk Road as a World Heritage Site.
- The One Belt One Road (OBOR) initiative, officially unveiled by President Xi Jinping in September 2013, has two core components:
- Economic land belt: linking countries by land along the ancient Silk Road through Central Asia, West Asia, the Middle East, and Europe.
- Maritime road: linking countries by sea along the Eastern coast of Africa through the Suez Canal into the Mediterranean.
- The key objective of the OBOR plan is to promote better connectivity, deepen linkage to improve mutual understanding, and foster long-term stability in the region.
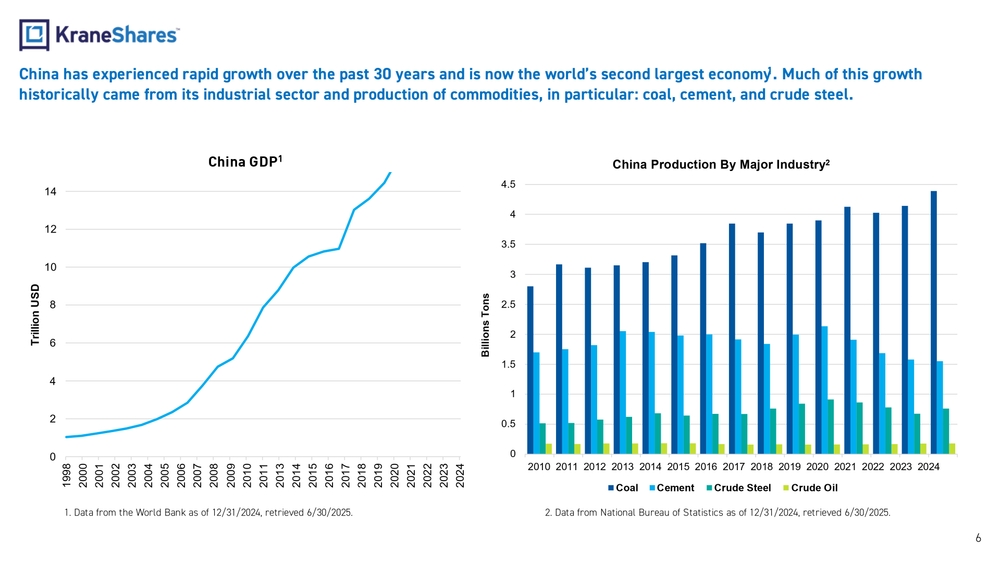
China's Economic Growth and Industrial Production
China has experienced rapid growth over the past 30 years and is now the world's second largest economy. Much of this growth historically came from its industrial sector and production of commodities, in particular: coal, cement, and crude steel.
China GDP
(Chart: China GDP in Trillion USD from 1998 to 2024, showing significant growth)
China Production By Major Industry
(Chart: China production in Billions of Tons from 2010 to 2024, showing Coal, Cement, Crude Steel, and Crude Oil)
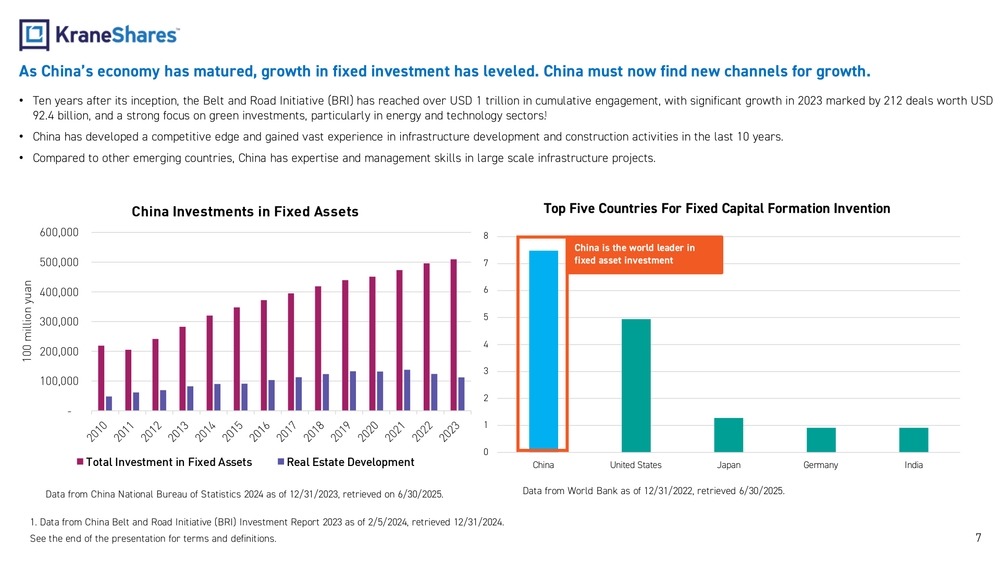
China's Fixed Investment and New Growth Channels
As China's economy has matured, growth in fixed investment has leveled. China must now find new channels for growth.
- Ten years after its inception, the Belt and Road Initiative (BRI) has reached over USD 1 trillion in cumulative engagement, with significant growth in 2023 marked by 212 deals worth USD 92.4 billion, and a strong focus on green investments, particularly in energy and technology sectors.
- China has developed a competitive edge and gained vast experience in infrastructure development and construction activities in the last 10 years.
- Compared to other emerging countries, China has expertise and management skills in large scale infrastructure projects.
China Investments in Fixed Assets
(Chart: Total Investment in Fixed Assets and Real Estate Development in 100 million yuan from 2010 to 2023)
Top Five Countries For Fixed Capital Formation Invention
(Chart: China is the world leader in fixed asset investment, compared to United States, Japan, Germany, and India)
Infrastructure Demand Among OBOR Countries
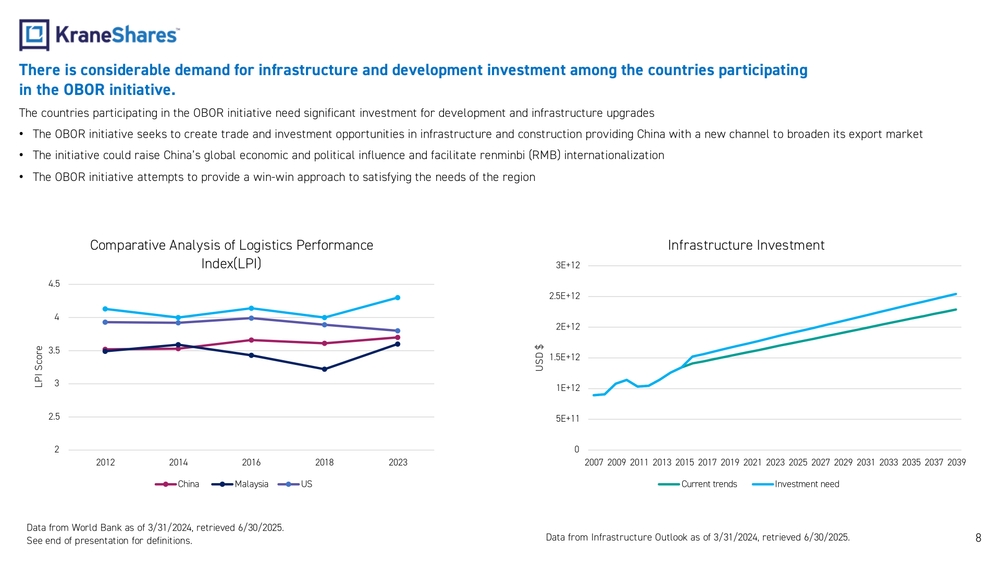
There is considerable demand for infrastructure and development investment among the countries participating in the OBOR initiative.
The countries participating in the OBOR initiative need significant investment for development and infrastructure upgrades.
- The OBOR initiative seeks to create trade and investment opportunities in infrastructure and construction providing China with a new channel to broaden its export market.
- The initiative could raise China's global economic and political influence and facilitate renminbi (RMB) internationalization.
- The OBOR initiative attempts to provide a win-win approach to satisfying the needs of the region.
Comparative Analysis of Logistics Performance Index (LPI)
(Chart: LPI Score comparison for China, Malaysia, and US from 2012 to 2023)
Infrastructure Investment
(Chart: Current trends vs. Investment need in USD $ from 2007 to 2039)
Infrastructure Investment Needs in OBOR Countries
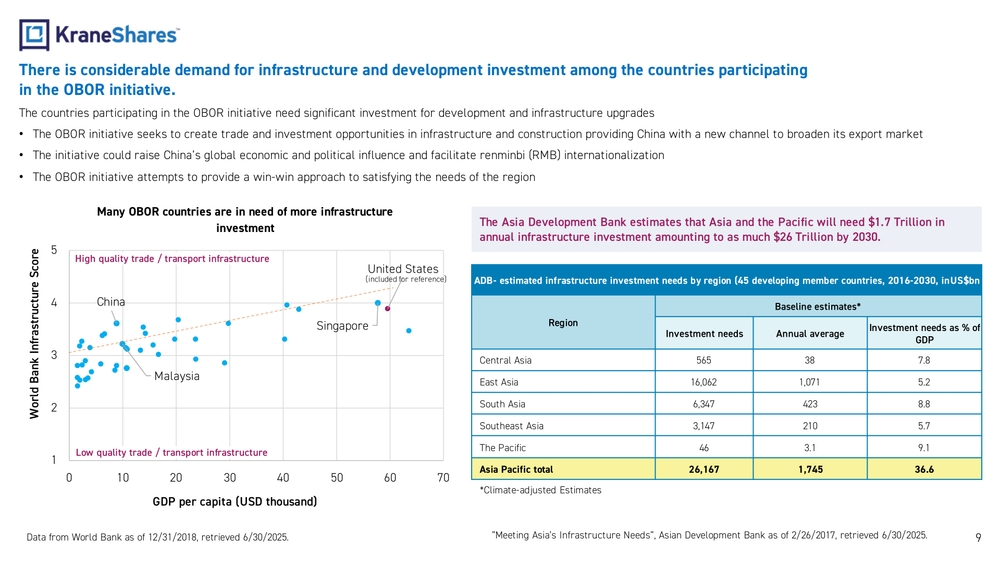
There is considerable demand for infrastructure and development investment among the countries participating in the OBOR initiative.
The countries participating in the OBOR initiative need significant investment for development and infrastructure upgrades.
- The OBOR initiative seeks to create trade and investment opportunities in infrastructure and construction providing China with a new channel to broaden its export market.
- The initiative could raise China's global economic and political influence and facilitate renminbi (RMB) internationalization.
- The OBOR initiative attempts to provide a win-win approach to satisfying the needs of the region.
Many OBOR countries are in need of more infrastructure investment
(Chart: World Bank Infrastructure Score vs. GDP per capita for OBOR countries including China, Malaysia, Singapore, United States)
ADB Estimated Infrastructure Investment Needs by Region (45 developing member countries, 2016-2030, in US$bn)
| Region | Investment needs | Annual average | Investment needs as % of GDP |
|---|---|---|---|
| Central Asia | 565 | 38 | 7.8 |
| East Asia | 16,062 | 1,071 | 5.2 |
| South Asia | 6,347 | 423 | 8.8 |
| Southeast Asia | 3,147 | 210 | 5.7 |
| The Pacific | 46 | 3.1 | 9.1 |
| Asia Pacific total | 26,167 | 1,745 | 36.6 |
Climate-adjusted Estimates
The Asia Development Bank estimates that Asia and the Pacific will need $1.7 Trillion in annual infrastructure investment amounting to as much $26 Trillion by 2030.
China's Overseas Projects
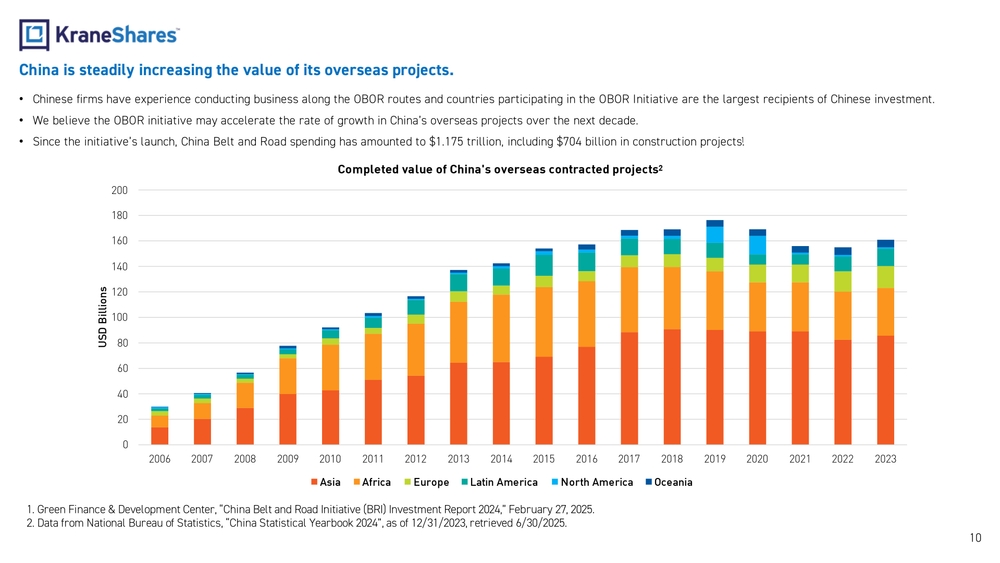
China is steadily increasing the value of its overseas projects.
- Chinese firms have experience conducting business along the OBOR routes and countries participating in the OBOR Initiative are the largest recipients of Chinese investment.
- We believe the OBOR initiative may accelerate the rate of growth in China's overseas projects over the next decade.
- Since the initiative's launch, China Belt and Road spending has amounted to $1.175 trillion, including $704 billion in construction projects.
Completed value of China's overseas contracted projects
(Chart: USD Billions from 2006 to 2023, broken down by region: Asia, Africa, Europe, Latin America, North America, Oceania)
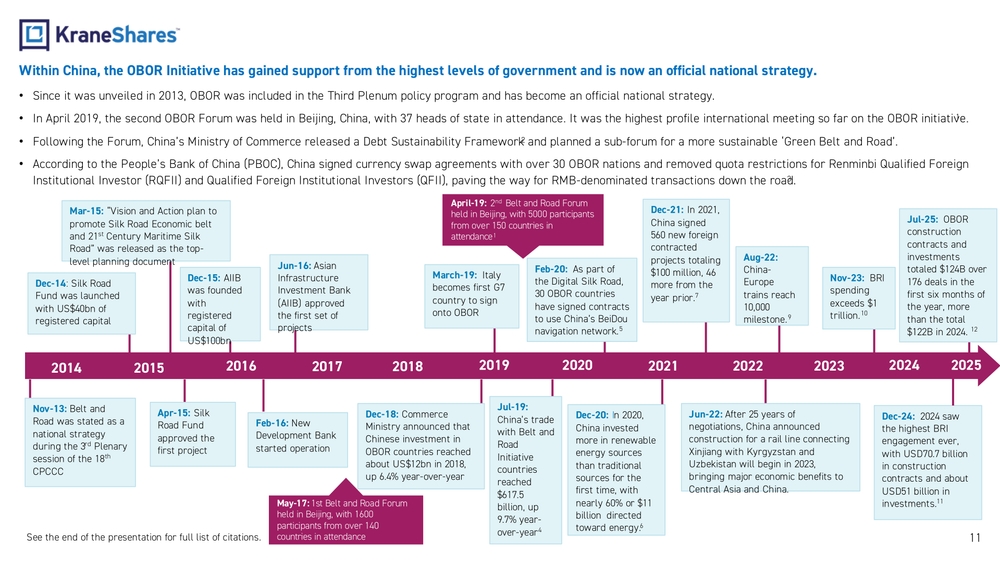
Within China, the OBOR Initiative has gained support from the highest levels of government and is now an official national strategy.
- Since it was unveiled in 2013, OBOR was included in the Third Plenum policy program and has become an official national strategy.
- In April 2019, the second OBOR Forum was held in Beijing, China, with 37 heads of state in attendance. It was the highest profile international meeting so far on the OBOR initiative.
- Following the Forum, China's Ministry of Commerce released a Debt Sustainability Framework and planned a sub-forum for a more sustainable 'Green Belt and Road'.
- According to the People's Bank of China (PBOC), China signed currency swap agreements with over 30 OBOR nations and removed quota restrictions for Renminbi Qualified Foreign Institutional Investor (RQFII) and Qualified Foreign Institutional Investors (QFII), paving the way for RMB-denominated transactions down the road.
Key Timeline Milestones
- Nov-13: Belt and Road was stated as a national strategy during the 3rd Plenary session of the 18th CPCCC
- Dec-14: Silk Road Fund was launched with US$40bn of registered capital
- Mar-15: "Vision and Action plan to promote Silk Road Economic belt and 21st Century Maritime Silk Road" was released as the top-level planning document
- Apr-15: Silk Road Fund approved the first project
- Dec-15: AIIB was founded with registered capital of US$100bn
- Feb-16: New Development Bank started operation
- Jun-16: Asian Infrastructure Investment Bank (AIIB) approved the first set of projects
- May-17: 1st Belt and Road Forum held in Beijing, with 1600 participants from over 140 countries in attendance
- Dec-18: Commerce Ministry announced that Chinese investment in OBOR countries reached about US$12bn in 2018, up 6.4% year-over-year
- March-19: Italy becomes first G7 country to sign onto OBOR
- April-19: 2nd Belt and Road Forum held in Beijing, with 5000 participants from over 150 countries in attendance
- Jul-19: China's trade with Belt and Road Initiative countries reached $617.5 billion, up 9.7% year-over-year
- Feb-20: As part of the Digital Silk Road, 30 OBOR countries have signed contracts to use China's BeiDou navigation network.
- Dec-20: In 2020, China invested more in renewable energy sources than traditional sources for the first time, with nearly 60% or $11 billion directed toward energy.
- Dec-21: In 2021, China signed 560 new foreign contracted projects totaling $100 million, 46 more from the year prior.
- Jun-22: After 25 years of negotiations, China announced construction for a rail line connecting Xinjiang with Kyrgyzstan and Uzbekistan will begin in 2023, bringing major economic benefits to Central Asia and China.
- Aug-22: China-Europe trains reach 10,000 milestone.
- Nov-23: BRI spending exceeds $1 trillion.
- Dec-24: 2024 saw the highest BRI engagement ever, with USD70.7 billion in construction contracts and about USD51 billion in investments.
- Jul-25: OBOR construction contracts and investments totaled $124B over 176 deals in the first six months of the year, more than the total $122B in 2024.
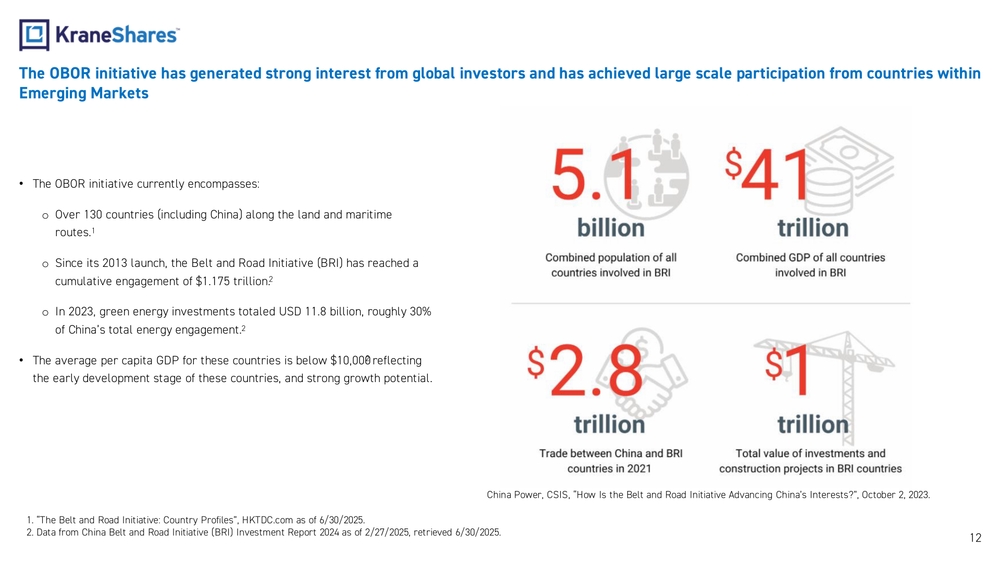
The OBOR initiative has generated strong interest from global investors and has achieved large scale participation from countries within Emerging Markets
- The OBOR initiative currently encompasses:
- Over 130 countries (including China) along the land and maritime routes.
- Since its 2013 launch, the Belt and Road Initiative (BRI) has reached a cumulative engagement of $1.175 trillion.
- In 2023, green energy investments totaled USD 11.8 billion, roughly 30% of China's total energy engagement.
- The average per capita GDP for these countries is below $10,000 reflecting the early development stage of these countries, and strong growth potential.
Key Statistics
- 5.1 billion – Combined population of all countries involved in BRI
- $41 trillion – Combined GDP of all countries involved in BRI
- $2.8 trillion – Trade between China and BRI countries in 2021
- $1 trillion – Total value of investments and construction projects in BRI countries
OBOR Countries as % of World (as of 2021)
- Population: 78%
- Land Area: 60%
- GDP: 43%
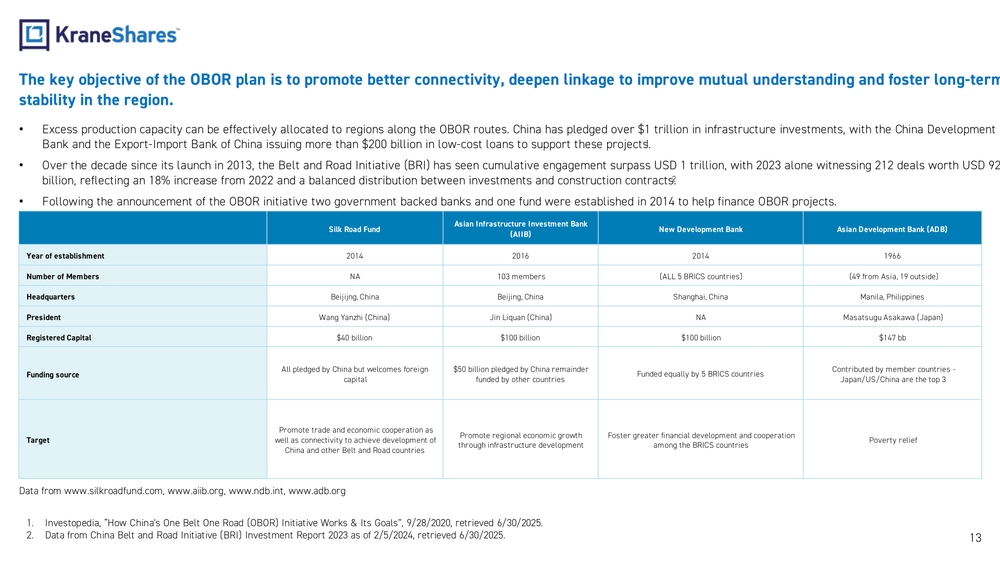
The key objective of the OBOR plan is to promote better connectivity, deepen linkage to improve mutual understanding and foster long-term stability in the region.
- Excess production capacity can be effectively allocated to regions along the OBOR routes. China has pledged over $1 trillion in infrastructure investments, with the China Development Bank and the Export-Import Bank of China issuing more than $200 billion in low-cost loans to support these projects.
- Over the decade since its launch in 2013, the Belt and Road Initiative (BRI) has seen cumulative engagement surpass USD 1 trillion, with 2023 alone witnessing 212 deals worth USD 92.4 billion, reflecting an 18% increase from 2022 and a balanced distribution between investments and construction contracts.
- Following the announcement of the OBOR initiative two government backed banks and one fund were established in 2014 to help finance OBOR projects.
Financing Institutions Comparison
| Silk Road Fund | Asian Infrastructure Investment Bank (AIIB) | New Development Bank | Asian Development Bank (ADB) | |
|---|---|---|---|---|
| Year of establishment | 2014 | 2016 | 2014 | 1966 |
| Number of Members | NA | 103 members | ALL 5 BRICS countries | 49 from Asia, 19 outside |
| Headquarters | Beijing, China | Beijing, China | Shanghai, China | Manila, Philippines |
| President | Wang Yanzhi (China) | Jin Liquan (China) | NA | Masatsugu Asakawa (Japan) |
| Registered Capital | $40 billion | $100 billion | $100 billion | $147 billion |
| Funding source | All pledged by China but welcomes foreign capital | $50 billion pledged by China, remainder funded by other countries | Funded equally by 5 BRICS countries | Contributed by member countries - Japan/US/China are the top 3 |
| Target | Promote trade and economic cooperation as well as connectivity to achieve development of China and other Belt and Road countries | Promote regional economic growth through infrastructure development | Foster greater financial development and cooperation among the BRICS countries | Poverty relief |
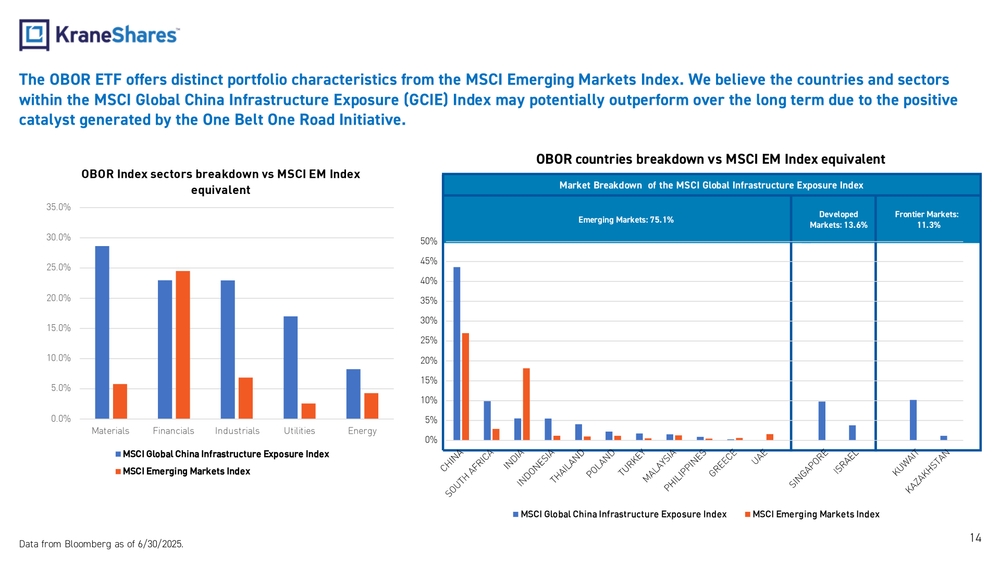
The OBOR ETF offers distinct portfolio characteristics from the MSCI Emerging Markets Index. We believe the countries and sectors within the MSCI Global China Infrastructure Exposure (GCIE) Index may potentially outperform over the long term due to the positive catalyst generated by the One Belt One Road Initiative.
OBOR Index Sectors Breakdown vs MSCI EM Index Equivalent
- Materials: MSCI Global China Infrastructure Exposure Index ~29%, MSCI Emerging Markets Index ~6%
- Financials: Both indices approximately ~23-24%
- Industrials: MSCI Global China Infrastructure Exposure Index ~23%, MSCI Emerging Markets Index lower
- Utilities: MSCI Global China Infrastructure Exposure Index ~17%, MSCI Emerging Markets Index ~2%
- Energy: MSCI Global China Infrastructure Exposure Index ~8%, MSCI Emerging Markets Index ~4%
OBOR Countries Breakdown vs MSCI EM Index Equivalent
Market Breakdown of the MSCI Global Infrastructure Exposure Index
- Emerging Markets: 75.1%
- Developed Markets: 13.6%
- Frontier Markets: 11.3%
Countries represented include: China, South Africa, India, Indonesia, Thailand, Poland, Turkey, Malaysia, Philippines, Greece, UAE, Singapore, Israel, Kuwait, Kazakhstan.
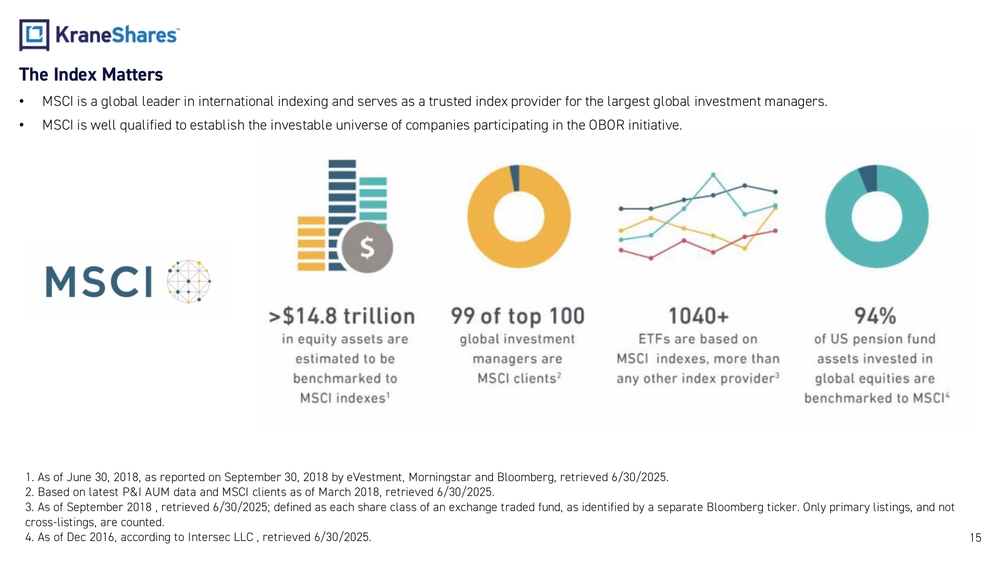
The Index Matters
- MSCI is a global leader in international indexing and serves as a trusted index provider for the largest global investment managers.
- MSCI is well qualified to establish the investable universe of companies participating in the OBOR initiative.
Key MSCI Statistics
- >$14.8 trillion in equity assets are estimated to be benchmarked to MSCI indexes
- 99 of top 100 global investment managers are MSCI clients
- 1040+ ETFs are based on MSCI indexes, more than any other index provider
- 94% of US pension fund assets invested in global equities are benchmarked to MSCI
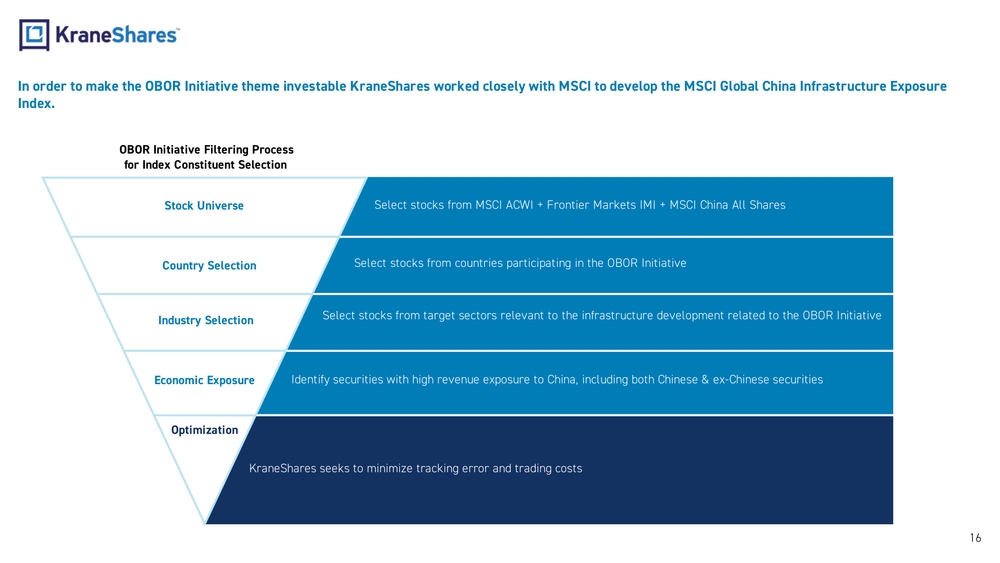
In order to make the OBOR Initiative theme investable KraneShares worked closely with MSCI to develop the MSCI Global China Infrastructure Exposure Index.
OBOR Initiative Filtering Process for Index Constituent Selection
| Step | Criteria |
|---|---|
| A. Stock Universe | Select stocks from MSCI ACWI + Frontier Markets IMI + MSCI China All Shares |
| B. Country Selection | Select stocks from countries participating in the OBOR Initiative |
| C. Industry Selection | Select stocks from target sectors relevant to the infrastructure development related to the OBOR Initiative |
| D. Economic Exposure | Identify securities with high revenue exposure to China, including both Chinese & ex-Chinese securities |
| E. Optimization | KraneShares seeks to minimize tracking error and trading costs |
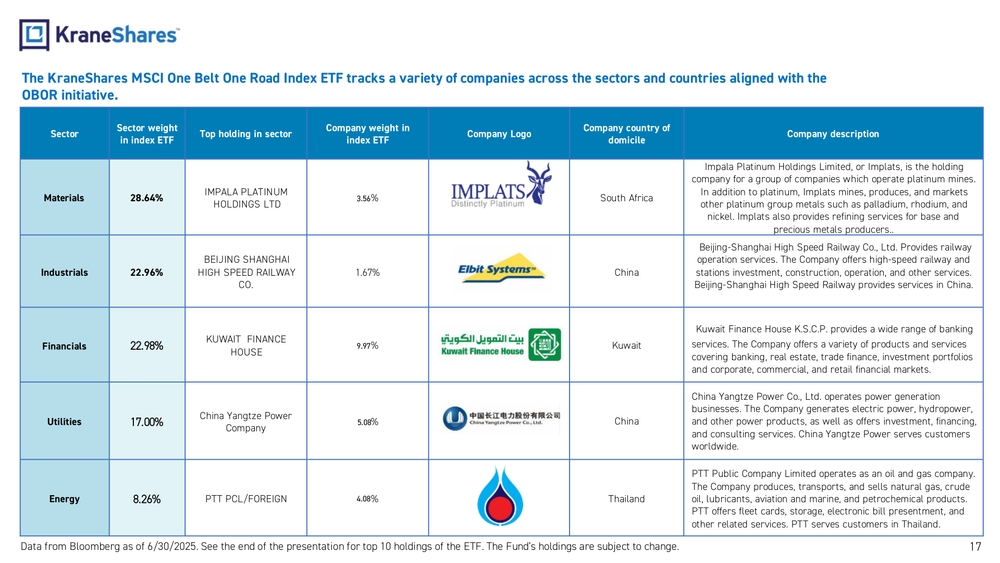
The KraneShares MSCI One Belt One Road Index ETF tracks a variety of companies across the sectors and countries aligned with the OBOR initiative.
Top Holdings by Sector
| Sector | Sector Weight in Index ETF | Top Holding in Sector | Company Weight in Index ETF | Company Country of Domicile | Company Description |
|---|---|---|---|---|---|
| Materials | 28.64% | IMPALA PLATINUM HOLDINGS LTD | 3.56% | South Africa | Impala Platinum Holdings Limited, or Implats, is the holding company for a group of companies which operate platinum mines. In addition to platinum, Implats mines, produces, and markets other platinum group metals such as palladium, rhodium, and nickel. Implats also provides refining services for base and precious metals producers. |
| Industrials | 22.96% | BEIJING SHANGHAI HIGH SPEED RAILWAY CO. | 1.67% | China | Beijing-Shanghai High Speed Railway Co., Ltd. Provides railway operation services. The Company offers high-speed railway and stations investment, construction, operation, and other services. Beijing-Shanghai High Speed Railway provides services in China. |
| Financials | 22.98% | KUWAIT FINANCE HOUSE | 9.97% | Kuwait | Kuwait Finance House K.S.C.P. provides a wide range of banking services. The Company offers a variety of products and services covering banking, real estate, trade finance, investment portfolios and corporate, commercial, and retail financial markets. |
| Utilities | 17.00% | China Yangtze Power Company | 5.08% | China | China Yangtze Power Co., Ltd. operates power generation businesses. The Company generates electric power, hydropower, and other power products, as well as offers investment, financing, and consulting services. China Yangtze Power serves customers worldwide. |
| Energy | 8.26% | PTT PCL/FOREIGN | 4.08% | Thailand | PTT Public Company Limited operates as an oil and gas company. The Company produces, transports, and sells natural gas, crude oil, lubricants, aviation and marine, and petrochemical products. PTT offers fleet cards, storage, electronic bill presentment, and other related services. PTT serves customers in Thailand. |
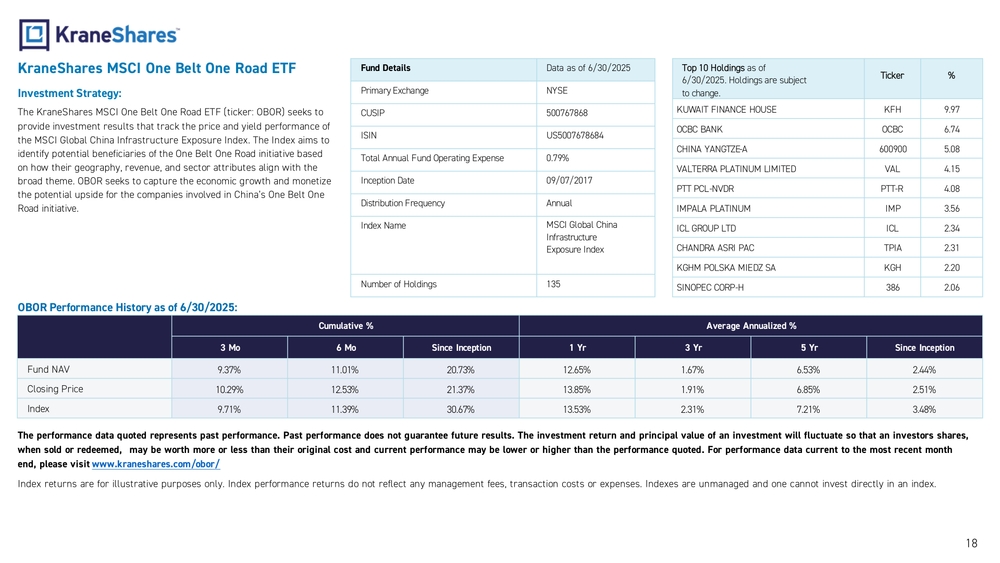
KraneShares MSCI One Belt One Road ETF
Investment Strategy
The KraneShares MSCI One Belt One Road ETF (ticker: OBOR) seeks to provide investment results that track the price and yield performance of the MSCI Global China Infrastructure Exposure Index. The Index aims to identify potential beneficiaries of the One Belt One Road initiative based on how their geography, revenue, and sector attributes align with the broad theme. OBOR seeks to capture the economic growth and monetize the potential upside for the companies involved in China's One Belt One Road initiative.
Fund Details (Data as of 6/30/2025)
| Primary Exchange | NYSE |
| CUSIP | 500767868 |
| ISIN | US5007678684 |
| Total Annual Fund Operating Expense | 0.79% |
| Inception Date | 09/07/2017 |
| Distribution Frequency | Annual |
| Index Name | MSCI Global China Infrastructure Exposure Index |
| Number of Holdings | 135 |
Top 10 Holdings as of 6/30/2025
| Company | Ticker | % |
|---|---|---|
| KUWAIT FINANCE HOUSE | KFH | 9.97 |
| OCBC BANK | OCBC | 6.74 |
| CHINA YANGTZE-A | 600900 | 5.08 |
| VALTERRA PLATINUM LIMITED | VAL | 4.15 |
| PTT PCL-NVDR | PTT-R | 4.08 |
| IMPALA PLATINUM | IMP | 3.56 |
| ICL GROUP LTD | ICL | 2.34 |
| CHANDRA ASRI PAC | TPIA | 2.31 |
| KGHM POLSKA MIEDZ SA | KGH | 2.20 |
| SINOPEC CORP-H | 386 | 2.06 |
OBOR Performance History as of 6/30/2025
| Cumulative % | Average Annualized % | ||||||
|---|---|---|---|---|---|---|---|
| 3 Mo | 6 Mo | Since Inception | 1 Yr | 3 Yr | 5 Yr | Since Inception | |
| Fund NAV | 9.37% | 11.01% | 20.73% | 12.65% | 1.67% | 6.53% | 2.44% |
| Closing Price | 10.29% | 12.53% | 21.37% | 13.85% | 1.91% | 6.85% | 2.51% |
| Index | 9.71% | 11.39% | 30.67% | 13.53% | 2.31% | 7.21% | 3.48% |
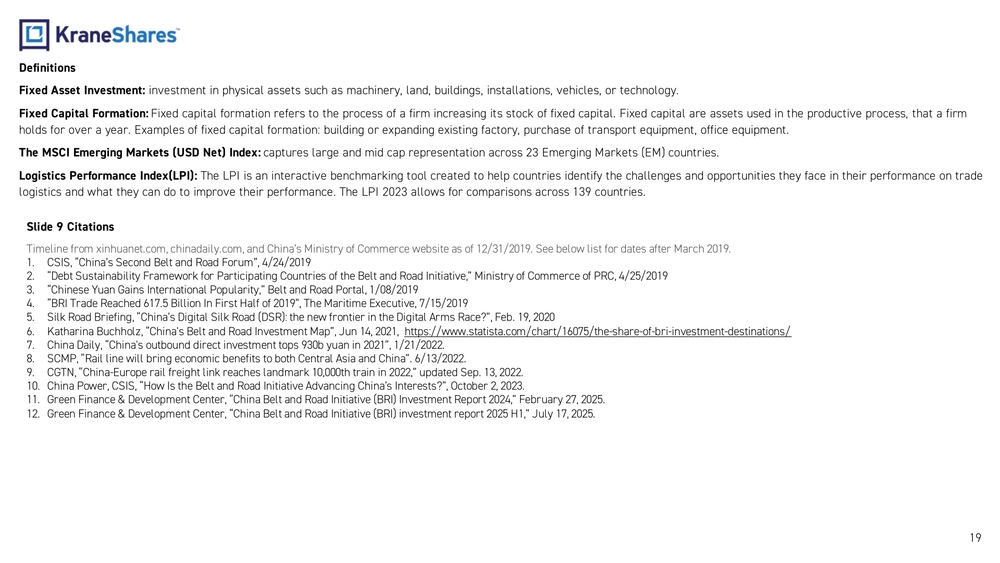
Definitions
Fixed Asset Investment: investment in physical assets such as machinery, land, buildings, installations, vehicles, or technology.
Fixed Capital Formation: Fixed capital formation refers to the process of a firm increasing its stock of fixed capital. Fixed capital are assets used in the productive process, that a firm holds for over a year. Examples of fixed capital formation: building or expanding existing factory, purchase of transport equipment, office equipment.
The MSCI Emerging Markets (USD Net) Index: captures large and mid cap representation across 23 Emerging Markets (EM) countries.
Logistics Performance Index (LPI): The LPI is an interactive benchmarking tool created to help countries identify the challenges and opportunities they face in their performance on trade logistics and what they can do to improve their performance. The LPI 2023 allows for comparisons across 139 countries.
Slide 9 Citations
- CSIS, "China's Second Belt and Road Forum", 4/24/2019
- "Debt Sustainability Framework for Participating Countries of the Belt and Road Initiative," Ministry of Commerce of PRC, 4/25/2019
- "Chinese Yuan Gains International Popularity," Belt and Road Portal, 1/08/2019
- "BRI Trade Reached 617.5 Billion In First Half of 2019", The Maritime Executive, 7/15/2019
- Silk Road Briefing, "China's Digital Silk Road (DSR): the new frontier in the Digital Arms Race?", Feb. 19, 2020
- Katharina Buchholz, "China's Belt and Road Investment Map", Jun 14, 2021
- China Daily, "China's outbound direct investment tops 930b yuan in 2021", 1/21/2022
- SCMP, "Rail line will bring economic benefits to both Central Asia and China". 6/13/2022
- CGTN, "China-Europe rail freight link reaches landmark 10,000th train in 2022," updated Sep. 13, 2022
- China Power, CSIS, "How Is the Belt and Road Initiative Advancing China's Interests?", October 2, 2023
- Green Finance & Development Center, "China Belt and Road Initiative (BRI) Investment Report 2024," February 27, 2025
- Green Finance & Development Center, "China Belt and Road Initiative (BRI) investment report 2025 H1," July 17, 2025
Important Notes
Carefully consider the Funds' investment objectives, risk factors, charges and expenses before investing. This and additional information can be found in the Funds' full and summary prospectus, which may be obtained by visiting www.kraneshares.com/obor/ Read the prospectus carefully before investing.
Risk Disclosures
This information should not be relied upon as research, investment advice, or a recommendation regarding any products, strategies, or any security in particular. This material is strictly for illustrative, educational, or informational purposes and is subject to change.
The Fund may invest in derivatives, which are often more volatile than other investments and may magnify the Fund's gains or losses. A derivative (i.e., futures/forward contracts, swaps, and options) is a contract that derives its value from the performance of an underlying asset. The primary risk of derivatives is that changes in the asset's market value and the derivative may not be proportionate, and some derivatives can have the potential for unlimited losses. Derivatives are also subject to liquidity and counterparty risk.
The Fund is subject to liquidity risk, meaning that certain investments may become difficult to purchase or sell at a reasonable time and price. Counterparty risk is the risk of loss in the event that the counterparty to an agreement fails to make required payments or otherwise comply with the terms of the derivative.
The ability of the Fund to achieve its respective investment objectives is dependent, in part, on the continuous availability of A Shares and the ability to obtain, if necessary, additional A Shares quota. The Fund is subject to political, social or economic instability within China which may cause decline in value. Emerging markets involve heightened risk related to the same factors as well as increase volatility and lower trading volume. Fluctuations in currency of foreign countries may have an adverse effect to domestic currency values. The Fund may invest in Initial Public Offerings (IPOs). Securities issued in IPOs have no trading history, and information about the companies may be available for very limited periods. In addition, the prices of securities sold in IPOs may be highly volatile.
Risk Disclosures Continued:
Narrowly focused investments typically exhibit higher volatility. The Fund's assets are expected to be concentrated in a sector, industry, market, or group of concentrations to the extent that the Underlying Index has such concentrations. The securities or futures in that concentration could react similarly to market developments. Thus, the Fund is subject to loss due to adverse occurrences that affect that concentration. In addition to the normal risks associated with investing, investments in smaller companies typically exhibit higher volatility.
ETF shares are bought and sold on an exchange at market price (not NAV) and are not individually redeemed from the Fund. However, shares may be redeemed at NAV directly by certain authorized broker-dealers (Authorized Participants) in very large creation/redemption units. The returns shown do not represent the returns you would receive if you traded shares at other times. Shares may trade at a premium or discount to their NAV in the secondary market. Brokerage commissions will reduce returns. Beginning 12/23/2020, market price returns are based on the official closing price of an ETF share or, if the official closing price isn't available, the midpoint between the national best bid and national best offer ("NBBO") as of the time the ETF calculates the current NAV per share. Prior to that date, market price returns were based on the midpoint between the Bid and Ask price. NAVs are calculated using prices as of 4:00 PM Eastern Time.
The KraneShares ETFs, KFA Funds ETFs, and KraneShares Mutual Funds are distributed by SEI Investments Distribution Company (SIDCO), 1 Freedom Valley Drive, Oaks, PA 19456, which is not affiliated with Krane Funds Advisors, LLC, the Investment Adviser for the Funds, or any sub-advisers for the Funds.